One-Way ANOVA Report: Analysis of Student Ages in College

Verified

Added on  2023/03/23

|4
|494
|66
Report
AI Summary
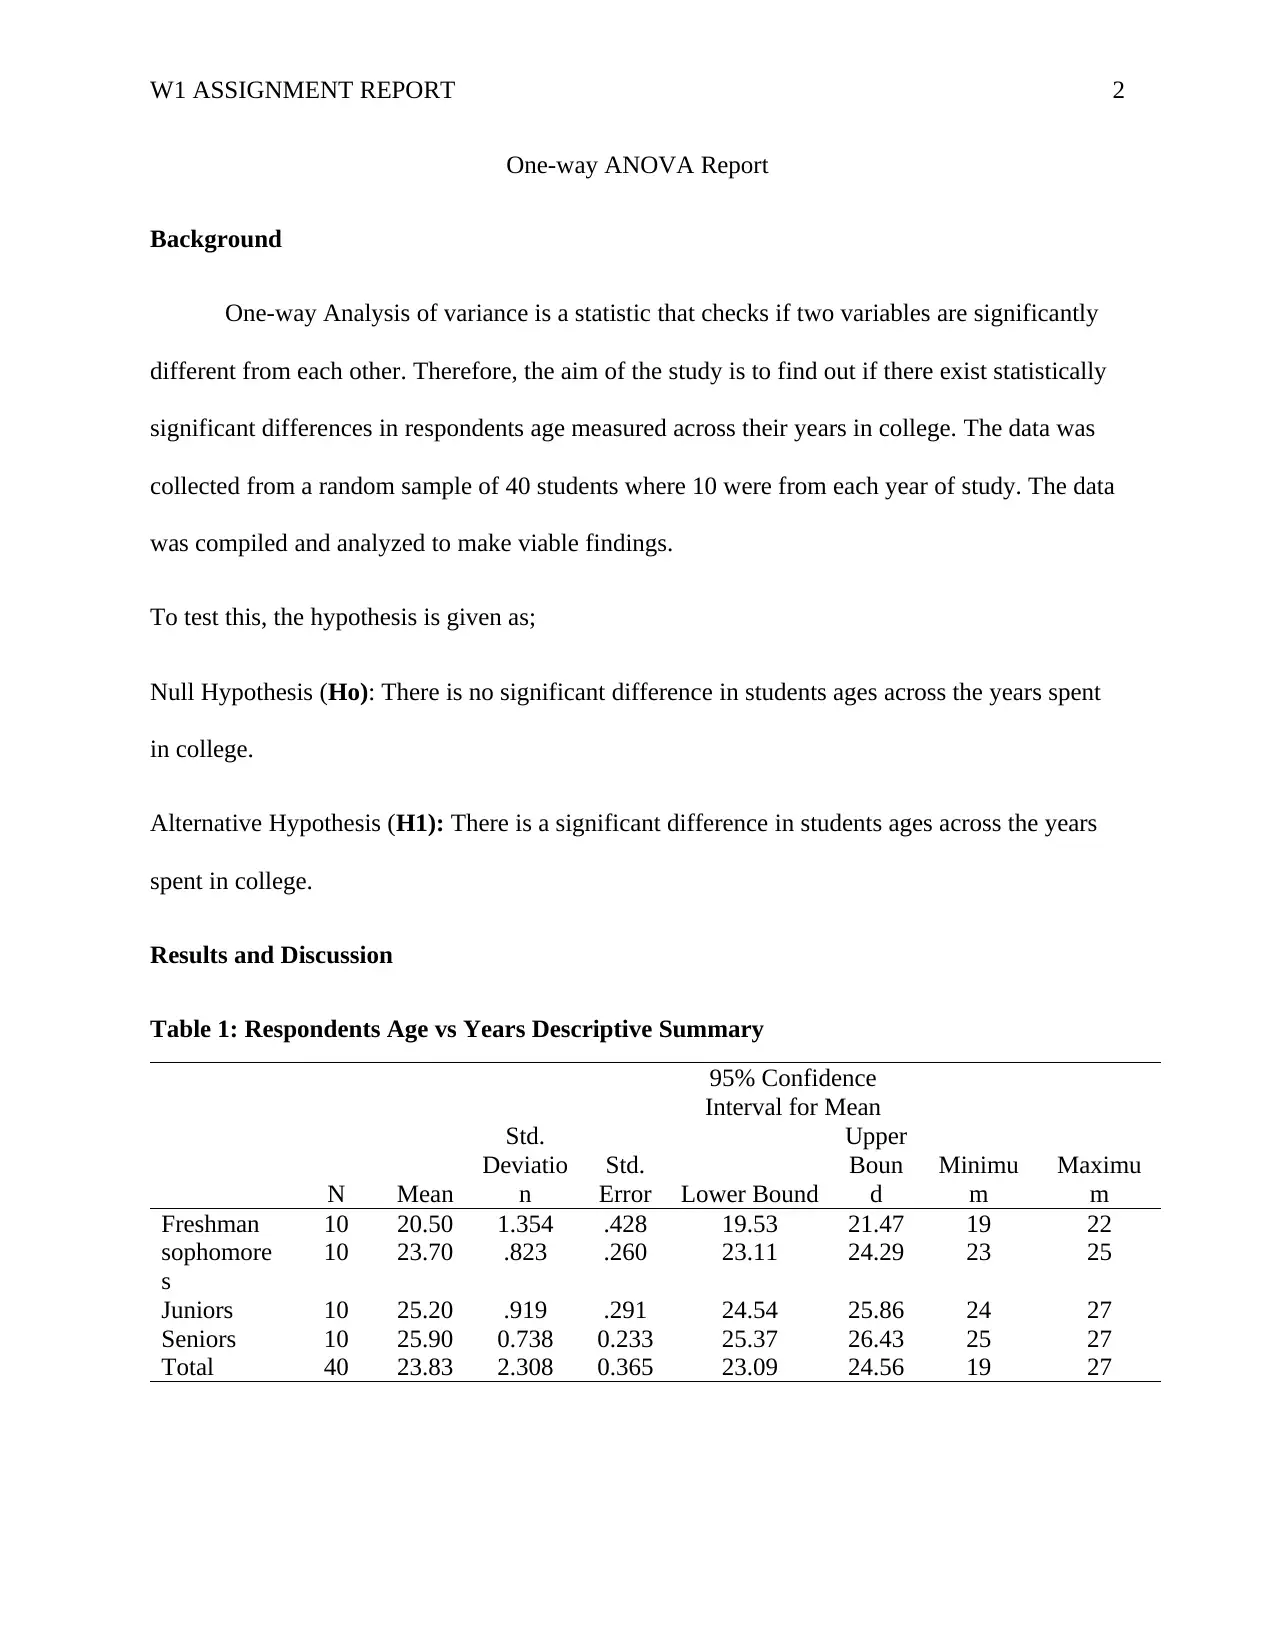
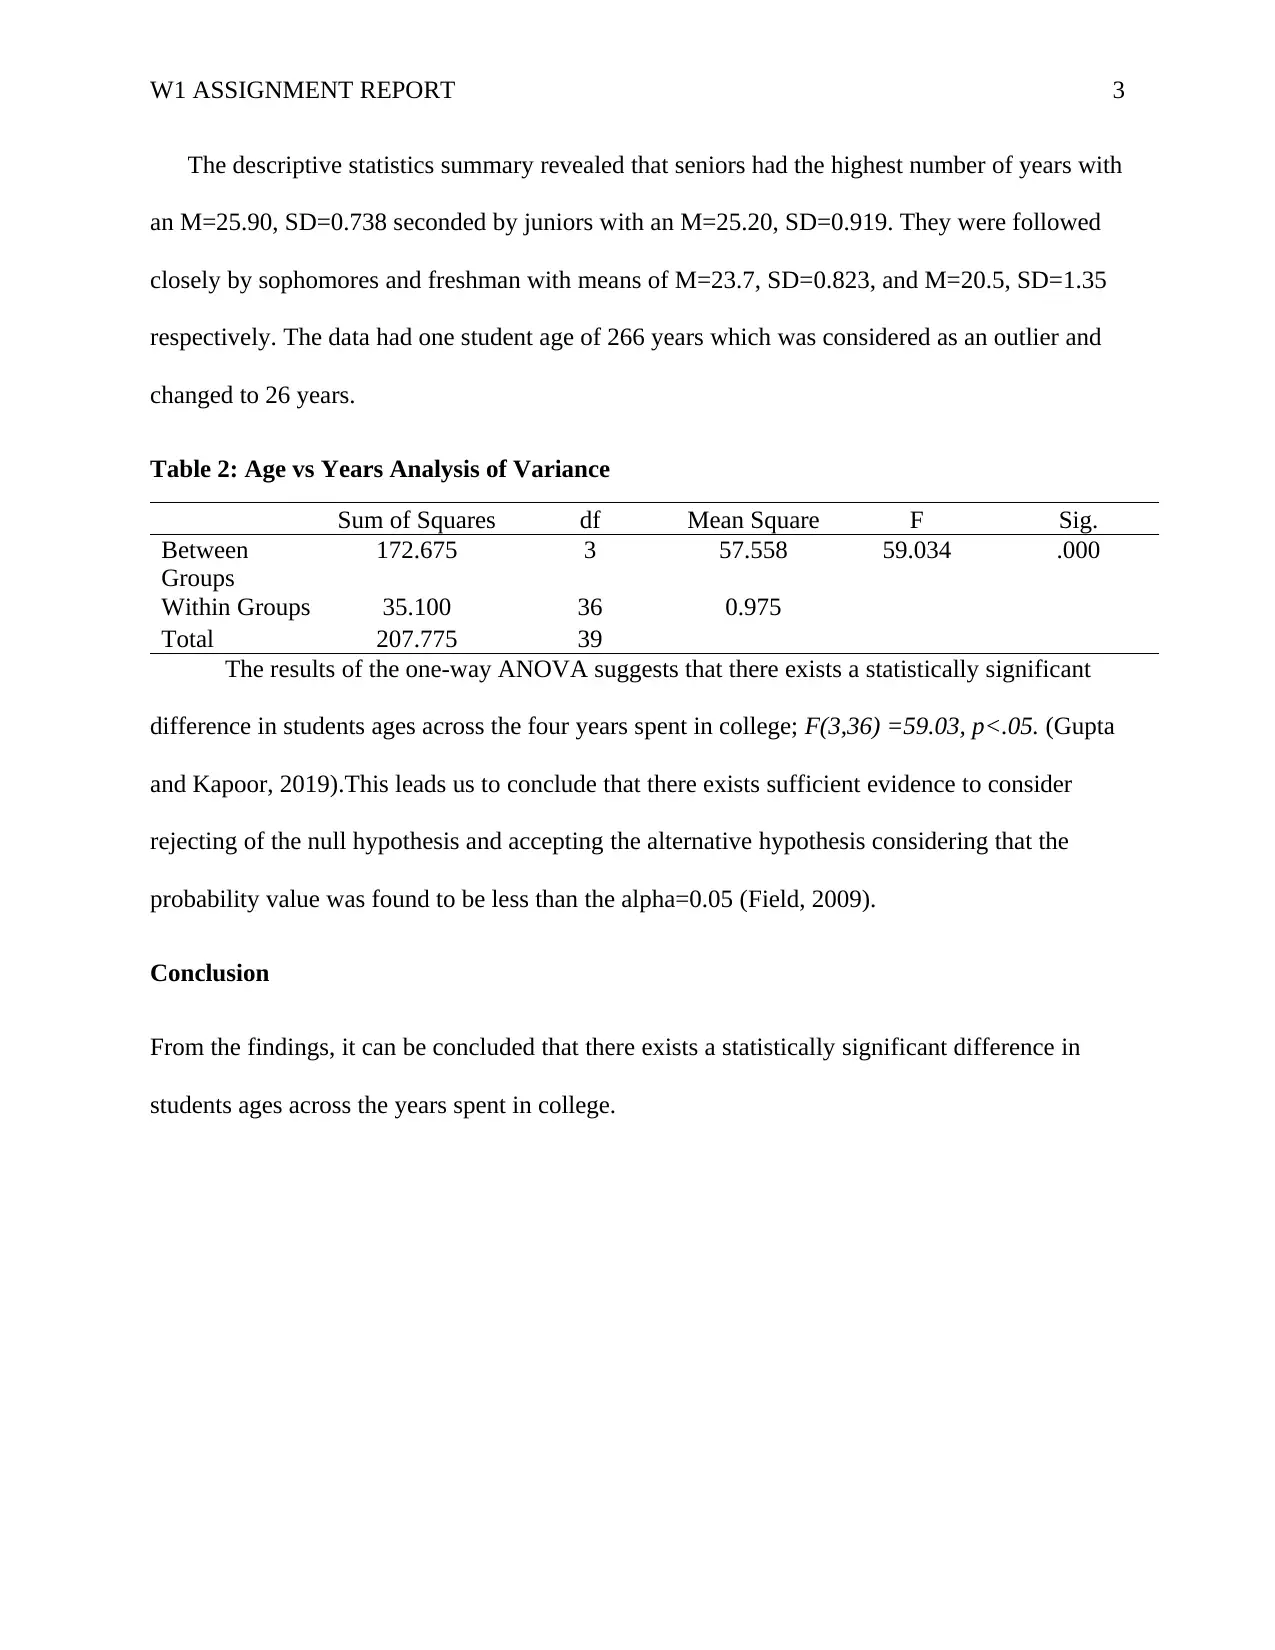
This report presents the findings of a one-way ANOVA analysis conducted to determine if there are statistically significant differences in student ages across their years in college. The study involved a random sample of 40 students, with 10 from each year of study (freshman, sophomore, junior, and senior). The report includes descriptive statistics, such as means and standard deviations, for each year group. The analysis revealed a statistically significant difference in student ages across the four years (F(3,36) = 59.03, p < .05), leading to the rejection of the null hypothesis. The conclusion indicates that there is sufficient evidence to support the alternative hypothesis, suggesting that student age varies significantly depending on their year in college. The report includes tables summarizing the data and references supporting the statistical methods and findings.
Document Page
Running head: W1 ASSIGNMENT REPORT 1
One-way ANOVA Report
Name
Institution
tabler-icon-diamond-filled.svg

Secure Best Marks with AI Grader

Need help grading? Try our AI Grader for instant feedback on your assignments.
Document Page
W1 ASSIGNMENT REPORT 2
One-way ANOVA Report
Background
One-way Analysis of variance is a statistic that checks if two variables are significantly
different from each other. Therefore, the aim of the study is to find out if there exist statistically
significant differences in respondents age measured across their years in college. The data was
collected from a random sample of 40 students where 10 were from each year of study. The data
was compiled and analyzed to make viable findings.
To test this, the hypothesis is given as;
Null Hypothesis (Ho): There is no significant difference in students ages across the years spent
in college.
Alternative Hypothesis (H1): There is a significant difference in students ages across the years
spent in college.
Results and Discussion
Table 1: Respondents Age vs Years Descriptive Summary
N Mean
Std.
Deviatio
n
Std.
Error
95% Confidence
Interval for Mean
Minimu
m
Maximu
mLower Bound
Upper
Boun
d
Freshman 10 20.50 1.354 .428 19.53 21.47 19 22
sophomore
s
10 23.70 .823 .260 23.11 24.29 23 25
Juniors 10 25.20 .919 .291 24.54 25.86 24 27
Seniors 10 25.90 0.738 0.233 25.37 26.43 25 27
Total 40 23.83 2.308 0.365 23.09 24.56 19 27
Document Page
W1 ASSIGNMENT REPORT 3
The descriptive statistics summary revealed that seniors had the highest number of years with
an M=25.90, SD=0.738 seconded by juniors with an M=25.20, SD=0.919. They were followed
closely by sophomores and freshman with means of M=23.7, SD=0.823, and M=20.5, SD=1.35
respectively. The data had one student age of 266 years which was considered as an outlier and
changed to 26 years.
Table 2: Age vs Years Analysis of Variance
Sum of Squares df Mean Square F Sig.
Between
Groups
172.675 3 57.558 59.034 .000
Within Groups 35.100 36 0.975
Total 207.775 39
The results of the one-way ANOVA suggests that there exists a statistically significant
difference in students ages across the four years spent in college; F(3,36) =59.03, p<.05. (Gupta
and Kapoor, 2019).This leads us to conclude that there exists sufficient evidence to consider
rejecting of the null hypothesis and accepting the alternative hypothesis considering that the
probability value was found to be less than the alpha=0.05 (Field, 2009).
Conclusion
From the findings, it can be concluded that there exists a statistically significant difference in
students ages across the years spent in college.
Document Page
W1 ASSIGNMENT REPORT 4
References
Field, Andy. (2009), Discovering statistics using SPSS. 3rd ed. London: Sage Publications Ltd.
Gupta, S.C. and Kapoor, V.K. (2019), Fundamentals of applied statistics. Sulthan Chand &
Sons.
chevron_up_icon
1 out of 4
circle_padding
hide_on_mobile
zoom_out_icon
[object Object]