Eating Attitudes, Dieting, and Body Composition in Female Students
VerifiedAdded on 2023/04/25
|16
|2025
|153
Report
AI Summary
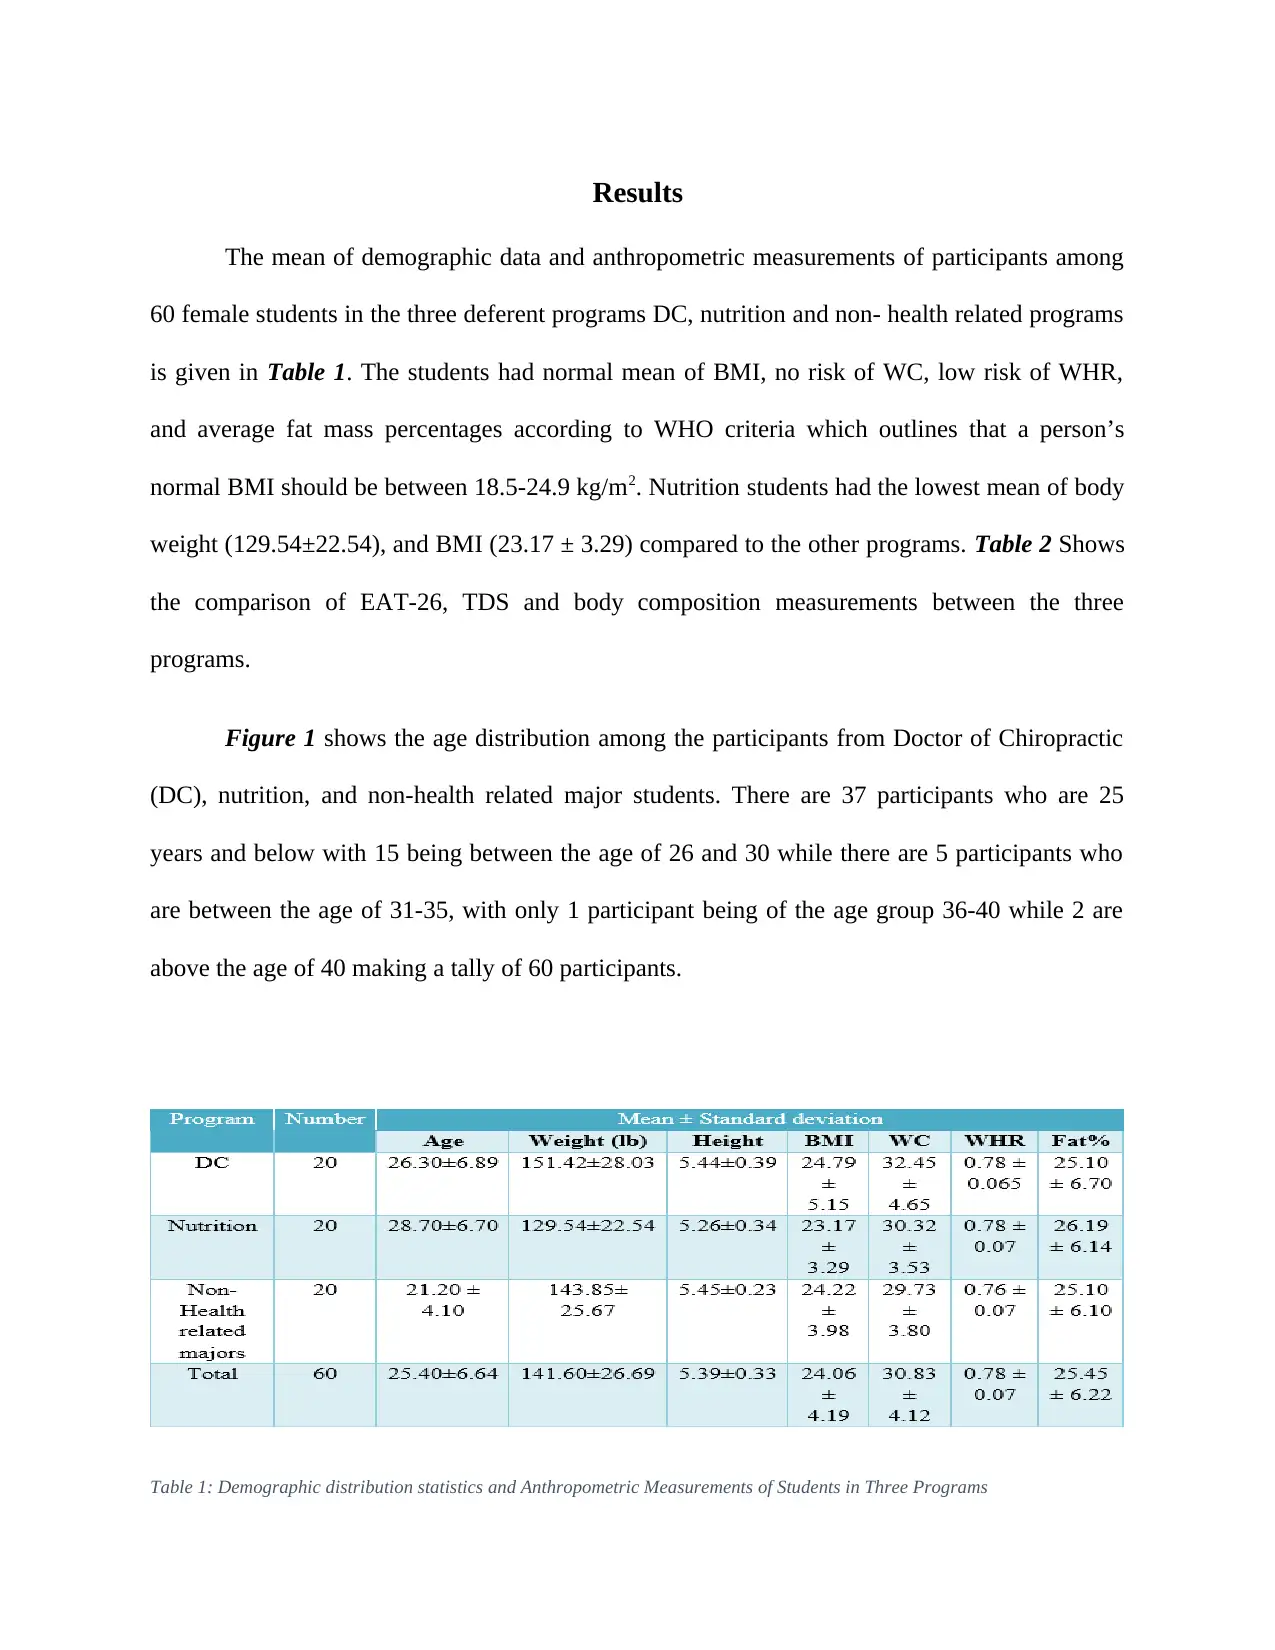
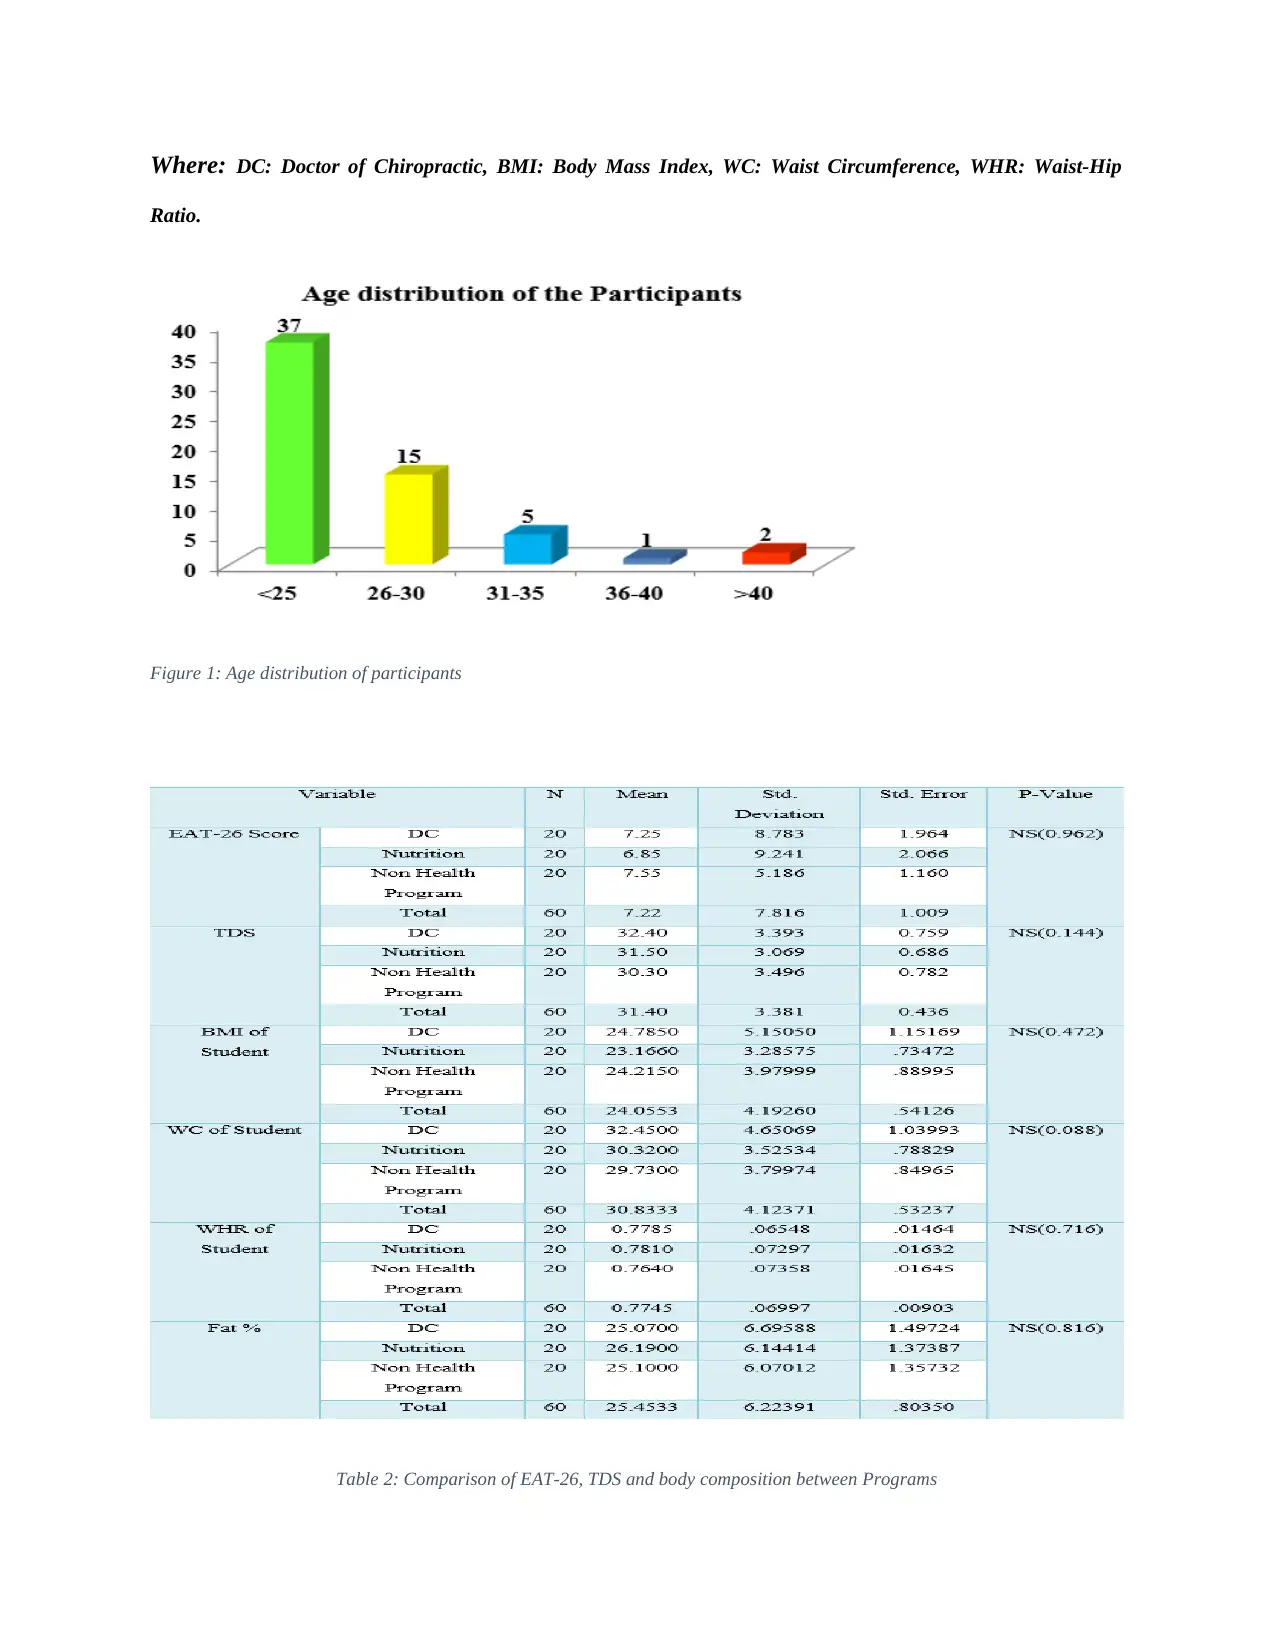
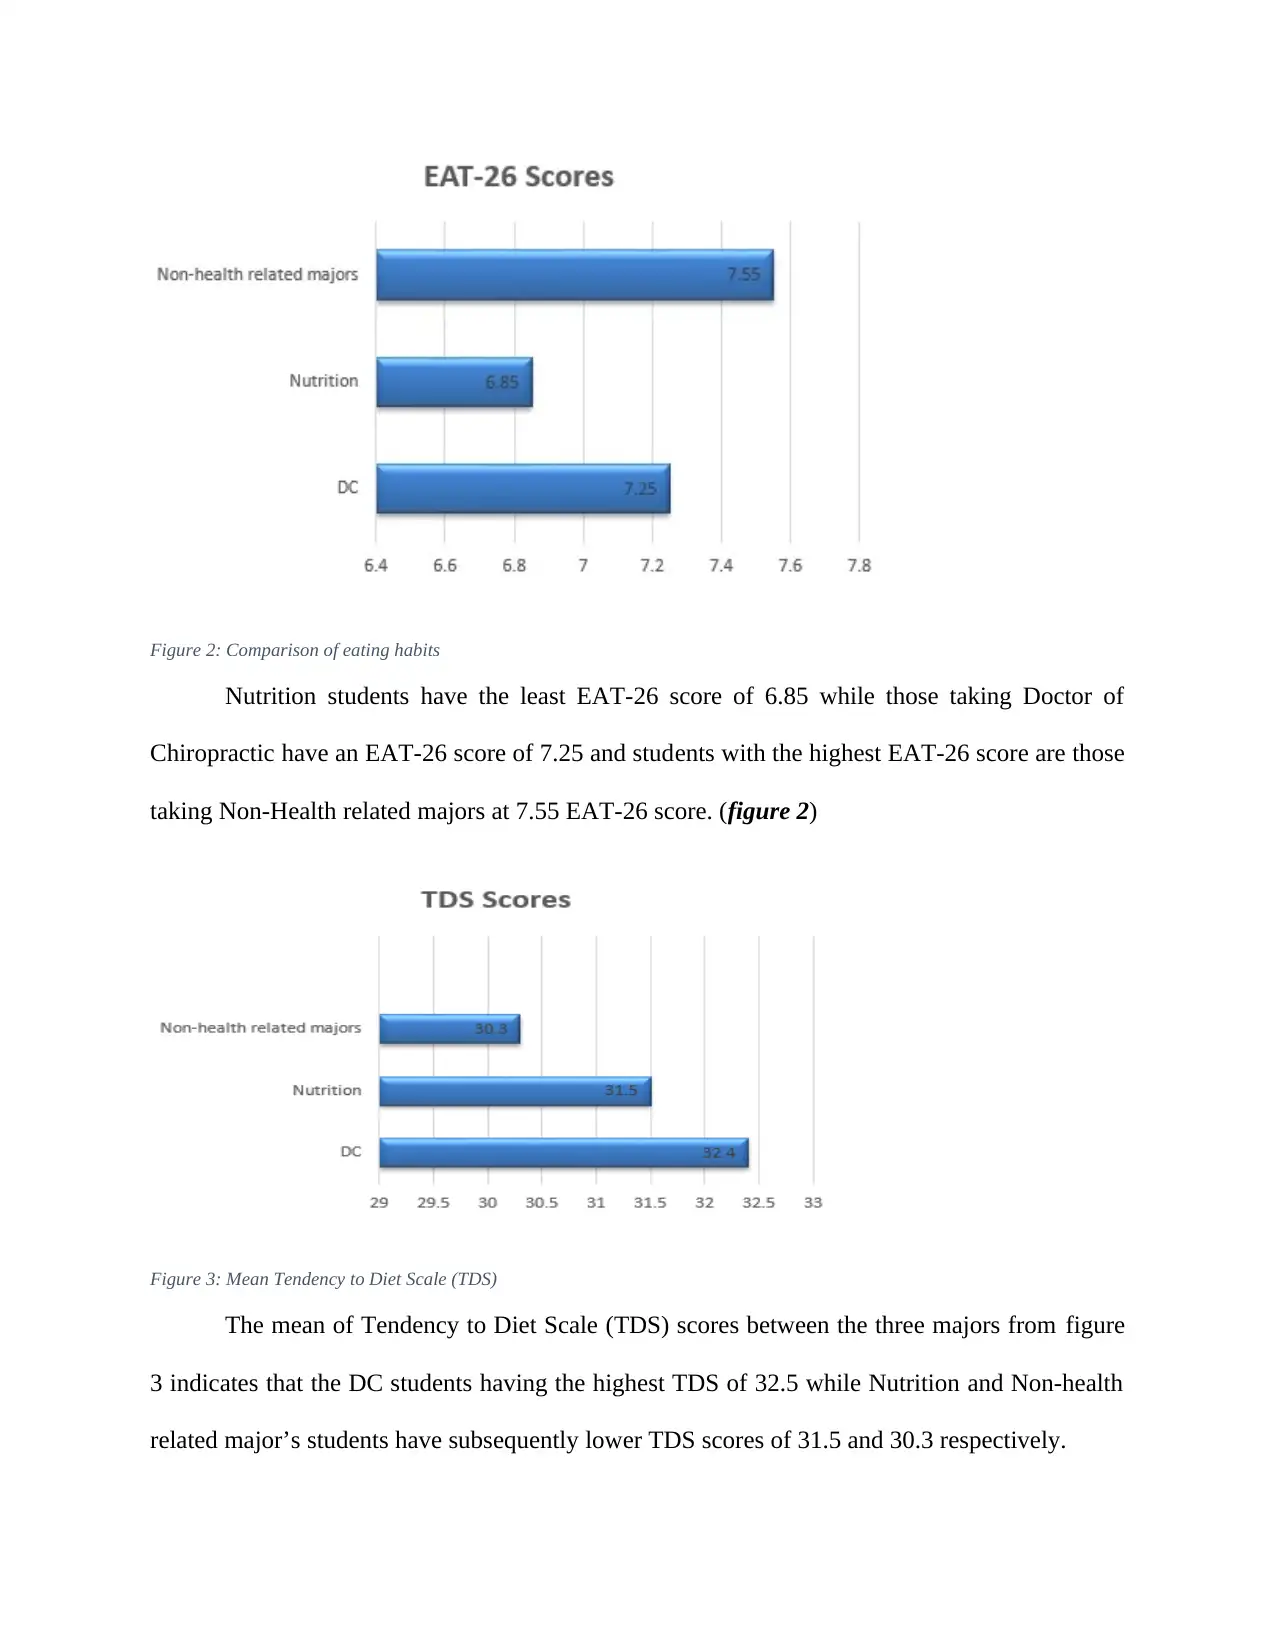
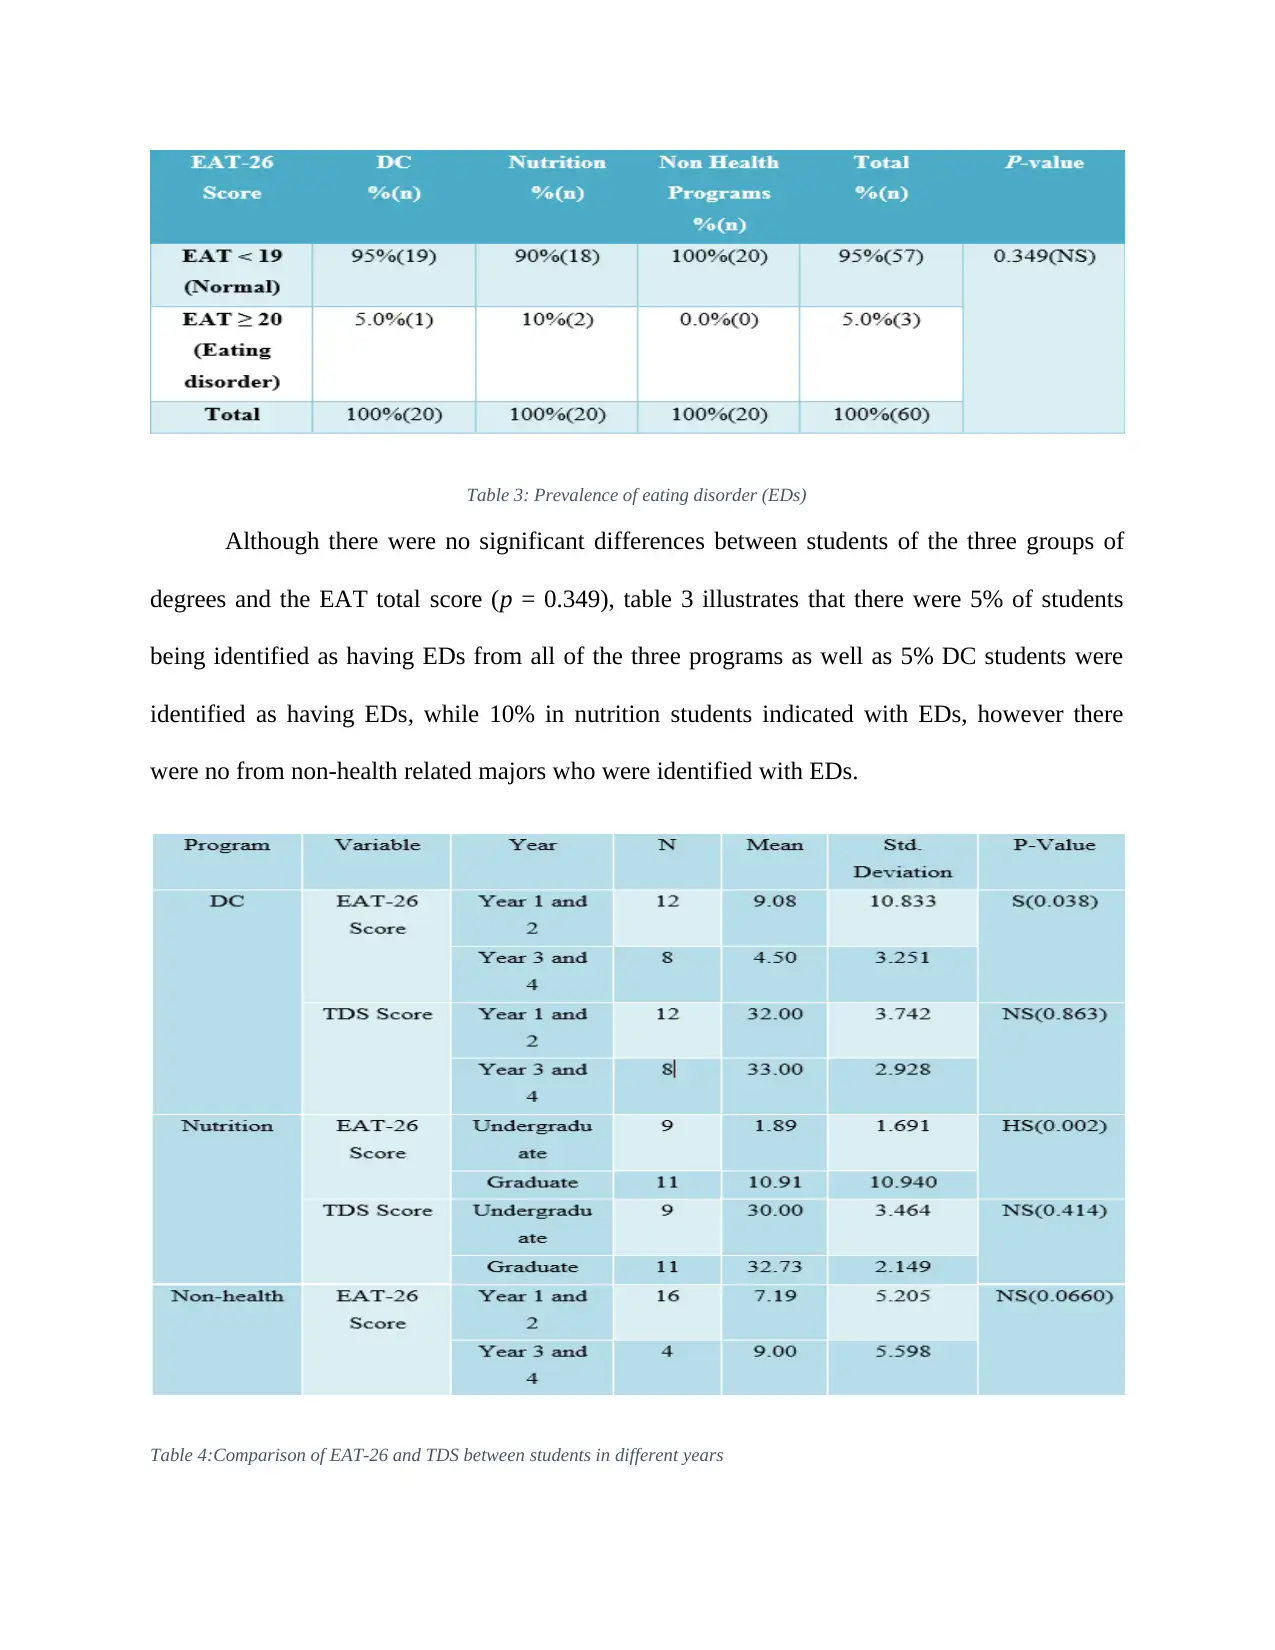
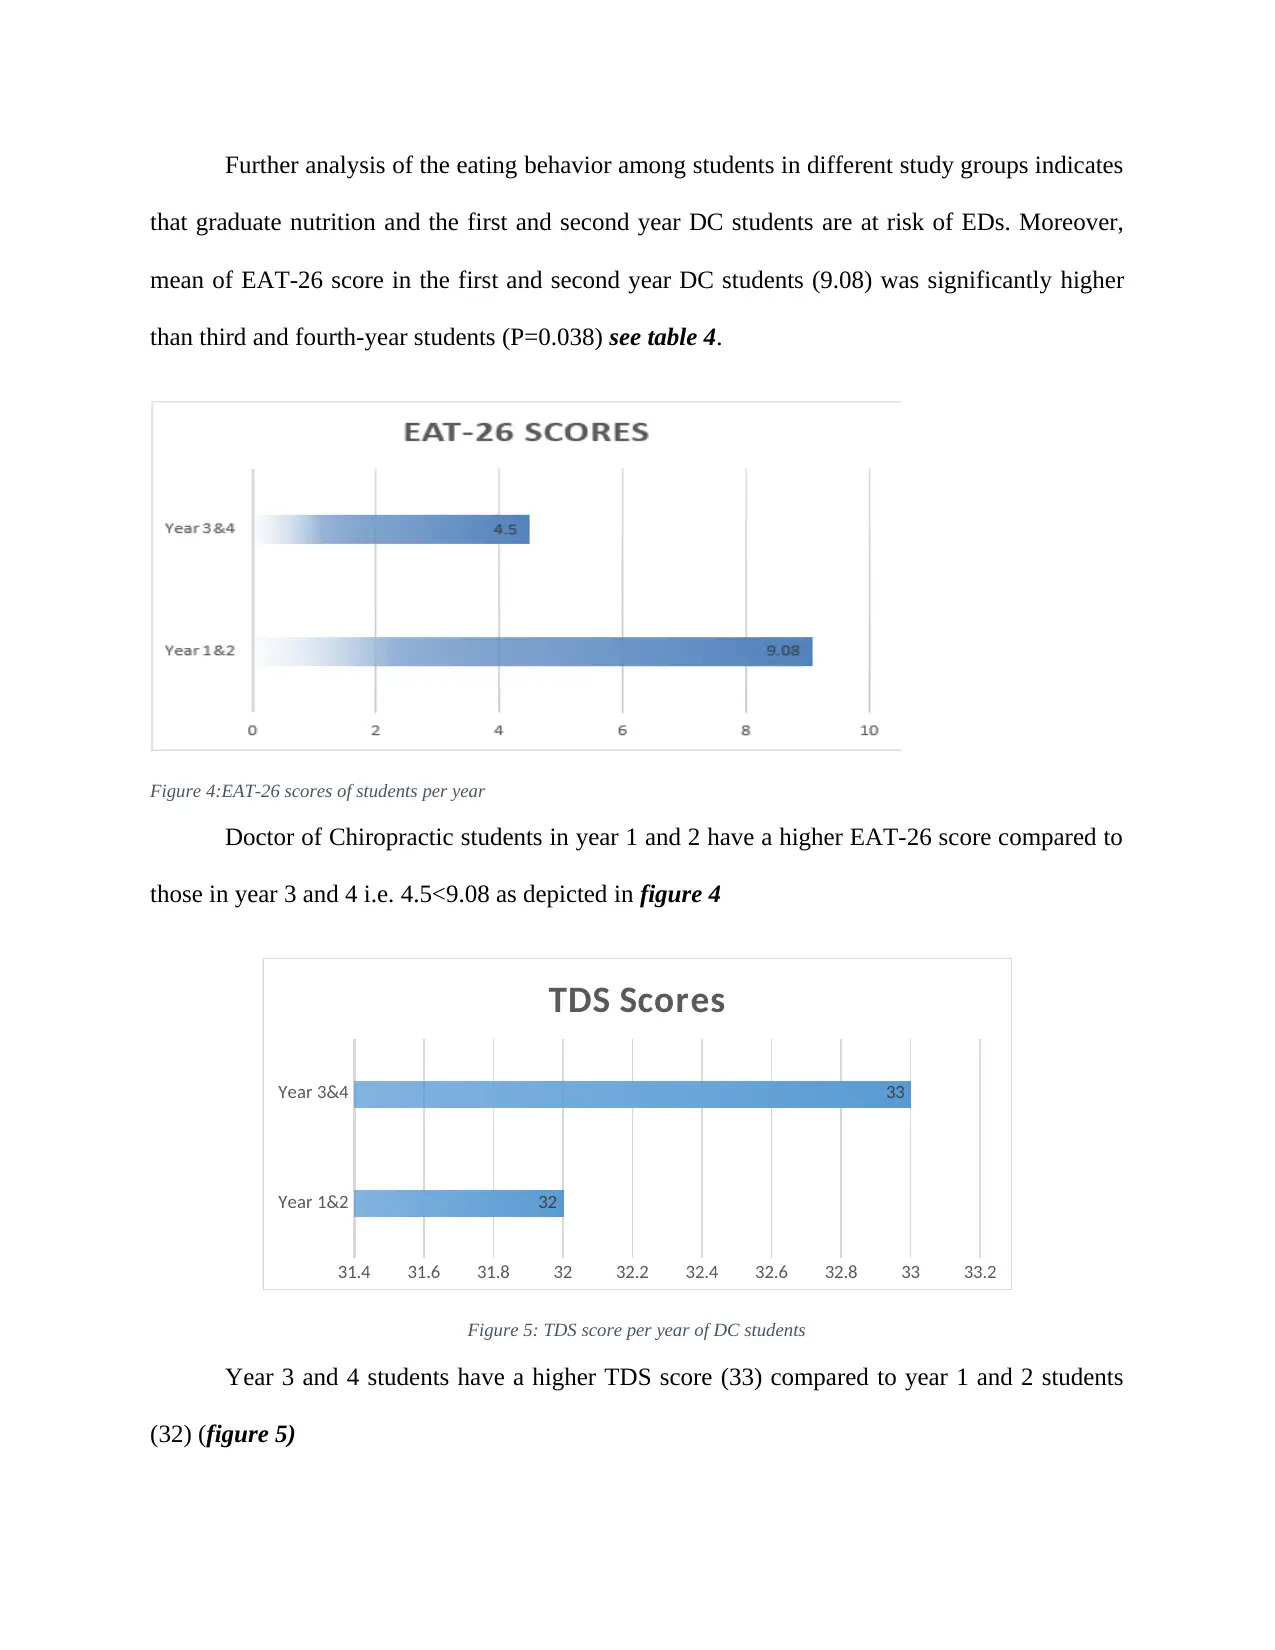
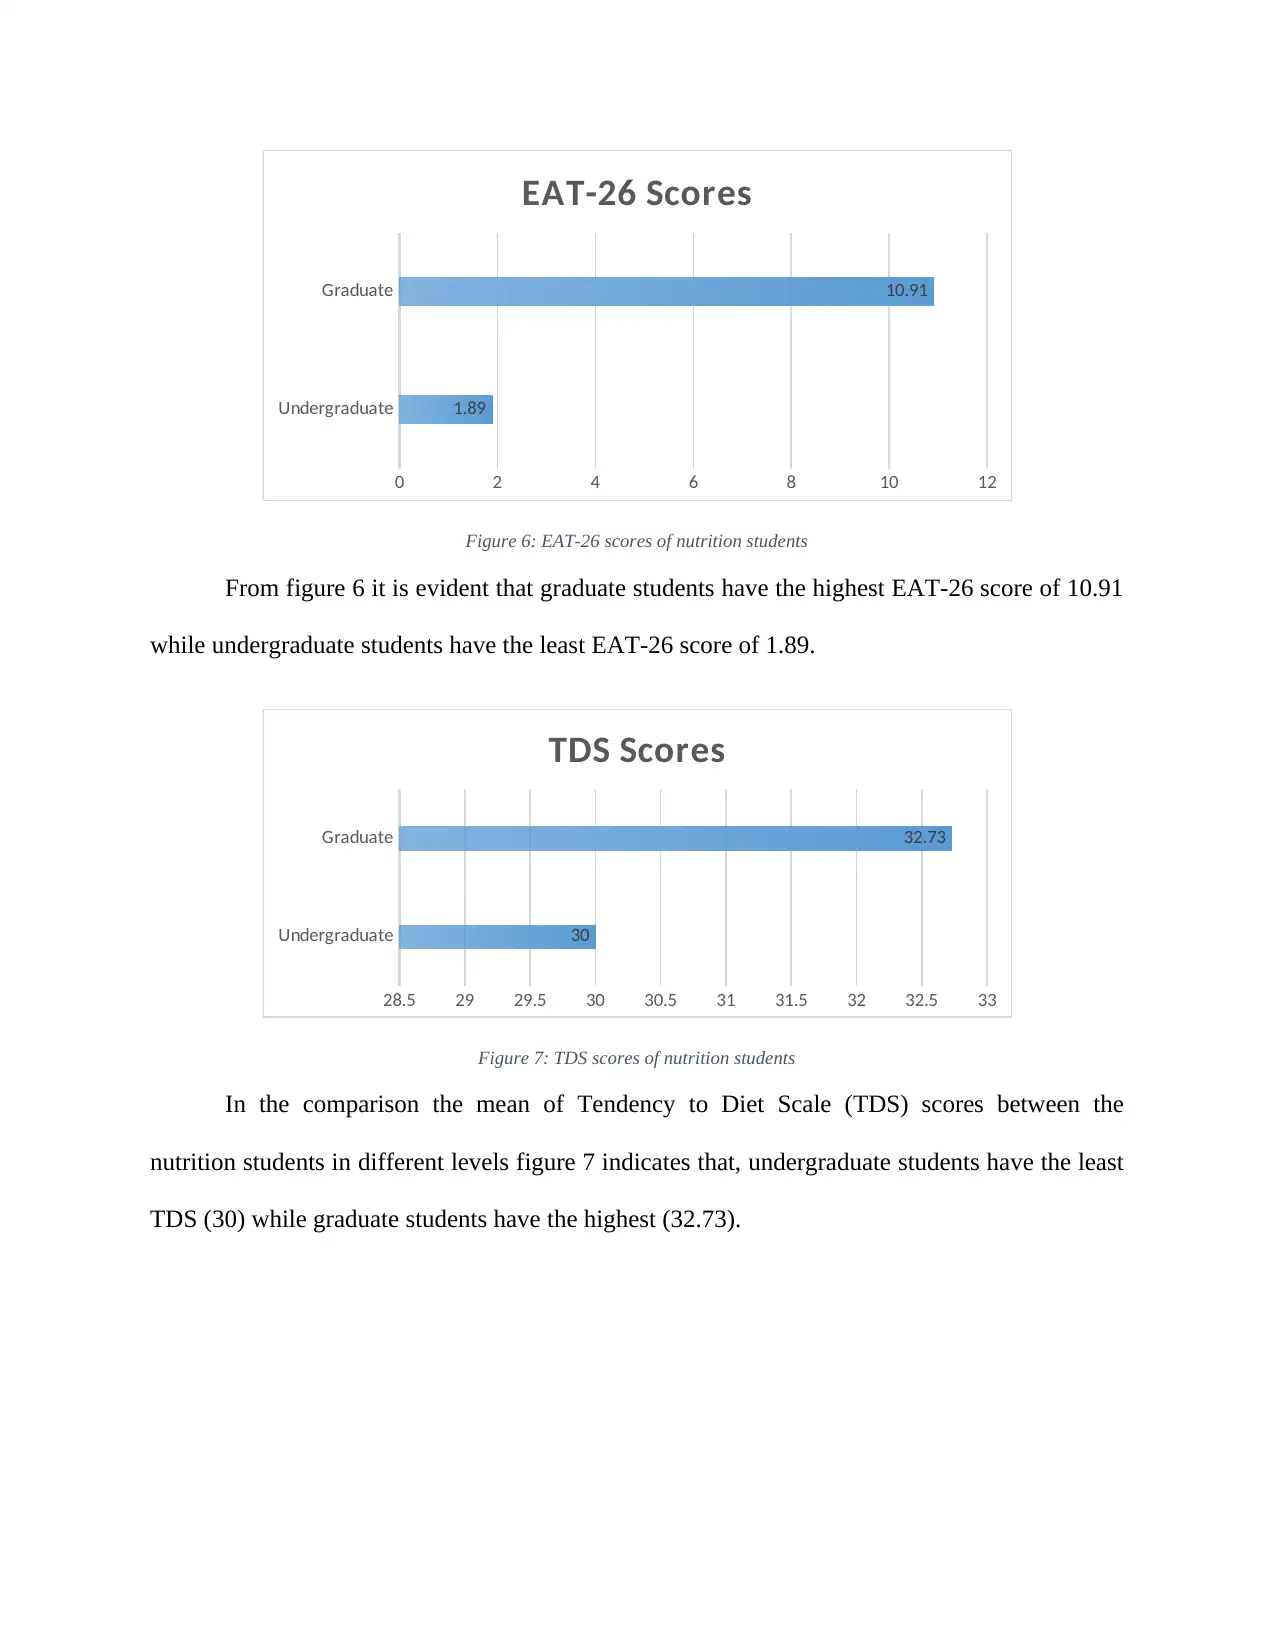
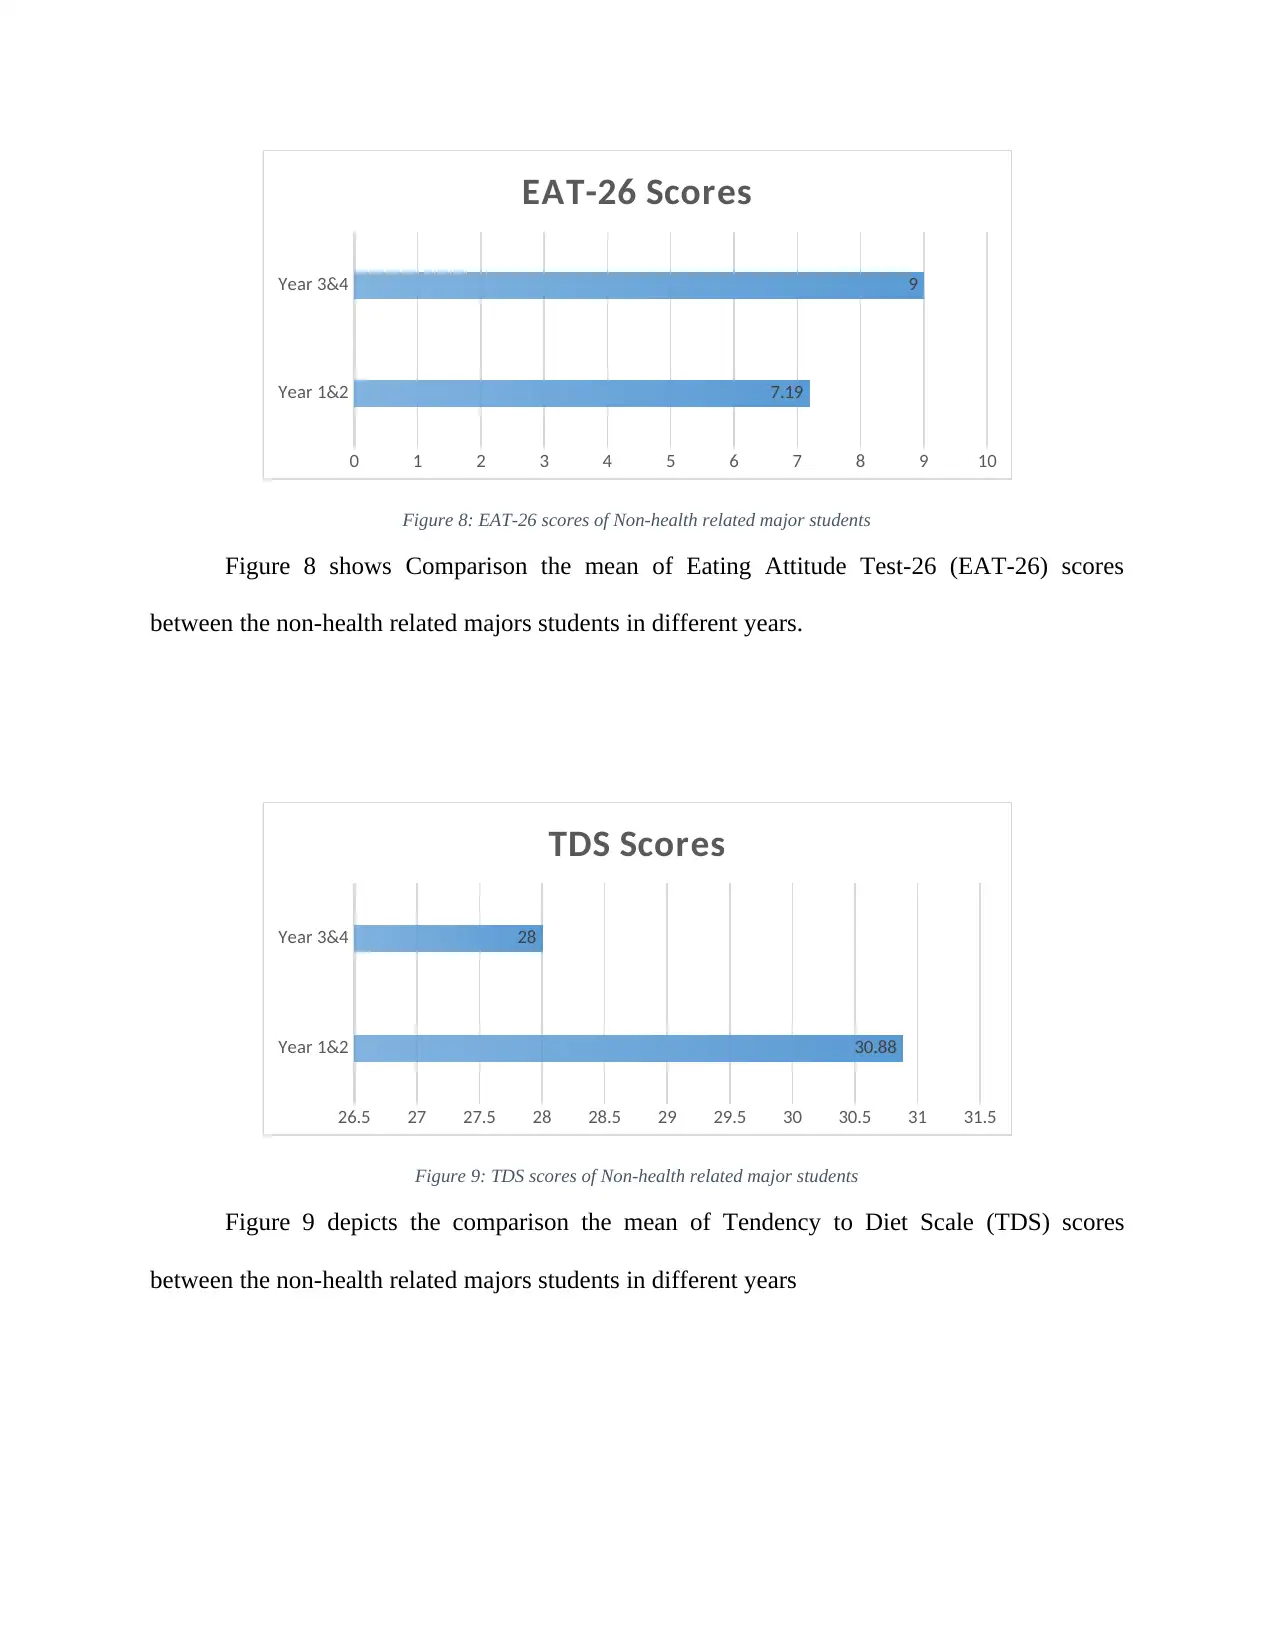
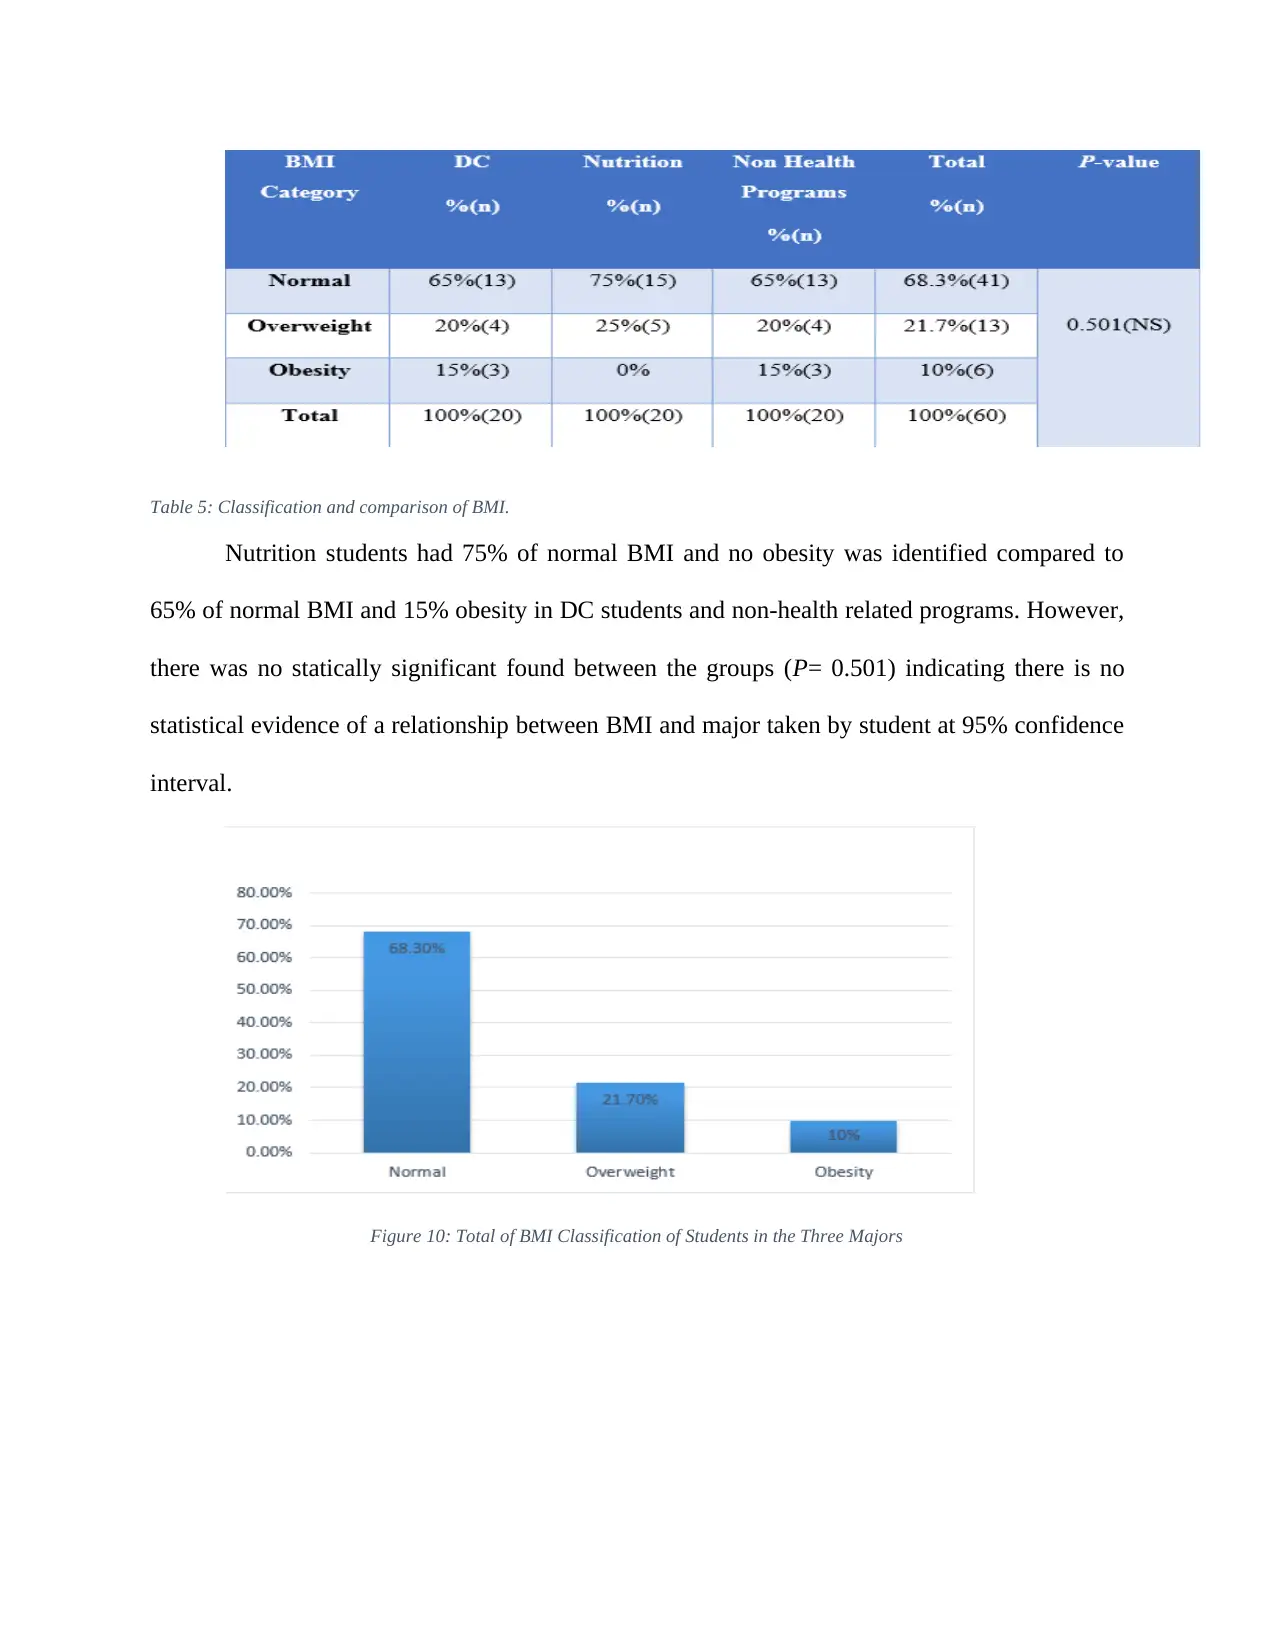
This report presents an analysis of demographic data, anthropometric measurements, eating attitudes, and body composition among 60 female students from Doctor of Chiropractic (DC), nutrition, and non-health-related programs. The study examines the prevalence of eating disorders using the Eating Attitude Test-26 (EAT-26) and Tendency to Diet Scale (TDS), and compares these factors across different programs and academic years. Key findings include that nutrition students have the lowest mean BMI, and a small percentage of students across all programs are identified as having eating disorders. Further analysis reveals that first and second-year DC students have significantly higher EAT-26 scores compared to their senior counterparts, and graduate nutrition students exhibit higher EAT-26 scores than undergraduates. While no significant correlations are found between EAT-26 and body composition measurements, a significant correlation exists between TDS and BMI, as well as TDS and waist circumference. The report concludes that nutrition knowledge influences eating behavior, as evidenced by differences in eating patterns between junior and senior students. Access more detailed reports and study tools on Desklib.
1 out of 16

Your All-in-One AI-Powered Toolkit for Academic Success.
+13062052269
info@desklib.com
Available 24*7 on WhatsApp / Email
![[object Object]](/_next/static/media/star-bottom.7253800d.svg)
Copyright © 2020–2026 A2Z Services. All Rights Reserved. Developed and managed by ZUCOL.