QMTH104 - Analyzing Expenditure Patterns of Int'l Students in AU
VerifiedAdded on 2023/06/07
|17
|3233
|75
Report
AI Summary
This report investigates the expenditure patterns of international students in Australia, examining the relationship between income and spending habits. Data was collected through questionnaires from a sample of 20 international students, covering aspects like rent, entertainment, transport, internet, and meals. Descriptive analysis revealed that rent constitutes the highest expenditure, while entertainment accounts for the lowest. Regression analysis indicated a positive correlation between income and expenditure, suggesting that students with lower incomes tend to minimize their spending. The study recommends providing proper incentives to support international students in achieving their educational goals. Desklib offers a platform to explore similar reports and past papers.
RUNNING HEADER: EXPENDITURE PATTERNS OF INTERNATIONAL STUDENTS IN AUSTRALIA 1
Expenditure Patterns of International Students in Australia
(ExPat Survey, T2 2018)
Student’s name:
Student’s ID:
Course:
Expenditure Patterns of International Students in Australia
(ExPat Survey, T2 2018)
Student’s name:
Student’s ID:
Course:
Paraphrase This Document
Need a fresh take? Get an instant paraphrase of this document with our AI Paraphraser
Expenditure Patterns of International Students in Australia 2
Executive summary
Over the years, students across the world choose to go to Australia to further their studies.
However, life in Australia is different due to the high standards of living in the country. As a
result, the Australian migration makes it a point to evaluate ones financial capability before
being permitted entry. From this, the following study aimed to find out how these international
students are impacted on their expenditure by their income level. It was found out that there was
a positive relationship between income and expenditure. Thus as income increased, expenditure
also increased. Due to this, it was seen that most international students opted to cut down on their
costs. Rent expenditure and income expenditure were less affected by cost minimization.
However, the international students chose to minimize on the meals, internet and entertainment
cost. Thus proper incentives have to be provided to ensure international students are able to focus
on their studies to achieve their educational dreams.
Table of Contents
Expenditure Patterns of International Students in Australia 3
Executive summary.........................................................................................................................2
Introduction......................................................................................................................................4
Method of data collection................................................................................................................5
Summary of the data set..................................................................................................................6
Descriptive data analysis.................................................................................................................7
Simple linear regression analysis...................................................................................................11
Conclusion and recommendations.................................................................................................13
References......................................................................................................................................14
Appendix 1.....................................................................................................................................16
⊘ This is a preview!⊘
Do you want full access?
Subscribe today to unlock all pages.
Trusted by 1+ million students worldwide
Expenditure Patterns of International Students in Australia 4
Introduction
In an economy, it is expected that the citizens need to be progressing economically and socially
with the minimal basket of basic human needs of a nation (Schwartz, 2012). Economic and
social progression due to the changes in the basic needs can only be affordable through the level
of income. The level of income of an individual or a household ensures the minimum living
standards of the society. To assess the well-being of a population, consumption expenditure and
income are the two straight-forward monetary measures which are employed. Consumption
expenditure is usually preferred to income since it reveals the long-term economic status of a
household, especially in low-income countries (D’Acunto, Hoang, Weber, 2015).
It is vital to note that there is a difference between expenditure and income which may make
expenditure even a better gauge of well-being for various reasons (Aguiar & Bils, 2015). One of
them is that there is a possibility of consumption without expenditure at within the same period
(Meyer & Sullivan, 2011). Expenditure is supposed to reflect better on the long-term or
permanent income. From this view, it is considered to be a better economic measure of the well-
being and the respective inequalities. Developing countries have income estimates of income
which are under-reported, vary across seasons and are drawn from multiple sources (Ravallion
&Chen, 2011). The process of collecting consumption expenditure that is collected in many
developing countries is time-consuming, expensive and needs household size adjustment for
composition and price level. Due to these difficulties, the proxies of the economy are collected to
measure the household economic status for both small and large scale population-based surveys.
In Australia, nearly half of all international students enrolled feel concerned about their financial
situation (Verbik & Lasanowski, 2007). This in contrast to what many believe that foreign
Paraphrase This Document
Need a fresh take? Get an instant paraphrase of this document with our AI Paraphraser
Expenditure Patterns of International Students in Australia 5
international students in Australian universities have an abundance of money to spend. 49.1
percent of international students in Australia feel worried about their finances (Rieckmann,
2012). The figure is slightly lower than the domestic student numbers of 59.5 percent. For an
international student to maneuver through this financial conundrum and study, they are forced to
limit their spending and lower their living standards (Becker & Kolte, 2012). It should be noted
that most of these students rely on their families’ support. Thus, they are forced to cut down on
their expenses especially diet, public transport and textbook cost.
International students face a myriad of challenges that are worsened by the fact that they are far
from home (Guruz, 2011). Due to these challenges, the following study aims at looking at how
the level of income influences their expenditure. Recommendations were made which will opt to
give a solution to how the international students in Australia can be aided so as to ensure they
pursue they dream through studying.
Method of data collection
To collect the data, questionnaires were designed. A sample questionnaire can be seen in
appendix 1. The survey questionnaire developed consisted of 3 parts with 10 questions. The first
part contained categorical variables. The variables included gender, age, education, and country.
The second part contained 5 questions which were related to expenditure. The questions that
related to expenditure included monthly rent expenditure, monthly entertainment expenditure,
monthly transport expenditure, monthly internet expenditure, and monthly meals expenditure.
The last part contained 1 question which pertained to the average monthly income.
The questionnaire was admitted to a sample of 20 international students. Ethical consideration
was kept in mind as the participants were not forced to answer the questionnaire in order to
Expenditure Patterns of International Students in Australia 6
influence their answers. Moreover, they were assured that the information that they give will be
used for educational purposes only. Consequently, the information they gave was treated with
the highest confidentiality.
The shortfall of using the survey questionnaires in collecting data is that they are expensive
especially in the printing of materials and that they are time-consuming especially during the
collection of data. Moreover, the data collection process was limited to a single area.
Summary of the data set
From the questionnaire, the data set collected entailed 10 variables. The variables are classified
as seen in the table below:
Table 1: Category of variables
Variable Category
Gender Categorical
Age Nominal
Education Categorical
Country Categorical
Rent Nominal
Entertainment Nominal
Transport Nominal
Internet Nominal
Meals Nominal
Income Nominal
Total
expenditure
Nominal
The data were coded and then collated into an excel workbook. The data was then to be analyzed
using the analysis tools add-in from excel. The chosen analysis was descriptive analysis and
⊘ This is a preview!⊘
Do you want full access?
Subscribe today to unlock all pages.
Trusted by 1+ million students worldwide
Expenditure Patterns of International Students in Australia 7
linear regression. The use of graphical images (graphs and pie-charts) were used in presenting
frequencies of categorical variables. Other descriptive analysis methods that were put into
consideration were mean standard deviation and variance. From the results obtained, discussion,
conclusion, and recommendation were made.
Descriptive data analysis
Gender
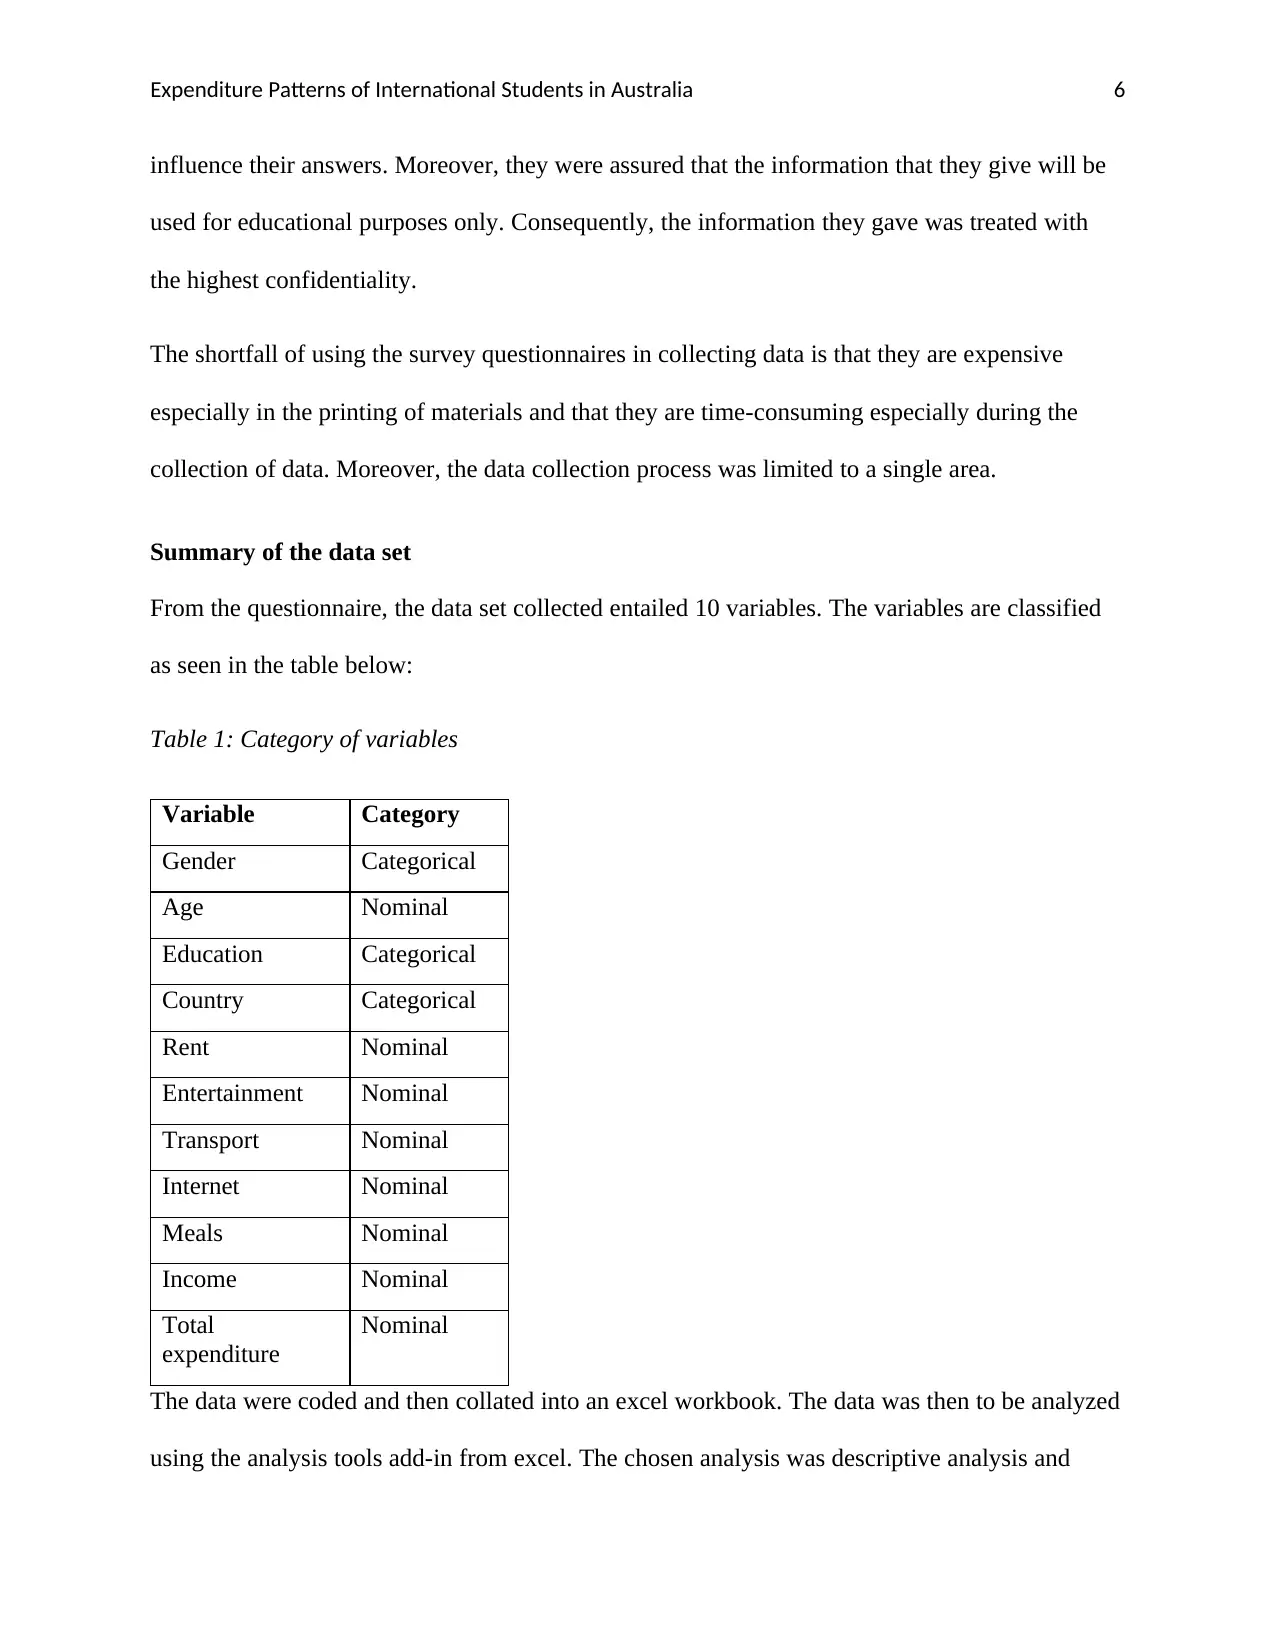
Figure 1: Gender
In figure 1 above, it is evident that most of the survey participants were male with a
representation of 55% of the sample. On the other hand, 45% of the participants in the survey
were female with a representation of 45% of the sample.
Age
linear regression. The use of graphical images (graphs and pie-charts) were used in presenting
frequencies of categorical variables. Other descriptive analysis methods that were put into
consideration were mean standard deviation and variance. From the results obtained, discussion,
conclusion, and recommendation were made.
Descriptive data analysis
Gender
Figure 1: Gender
In figure 1 above, it is evident that most of the survey participants were male with a
representation of 55% of the sample. On the other hand, 45% of the participants in the survey
were female with a representation of 45% of the sample.
Age
Paraphrase This Document
Need a fresh take? Get an instant paraphrase of this document with our AI Paraphraser
Expenditure Patterns of International Students in Australia 8
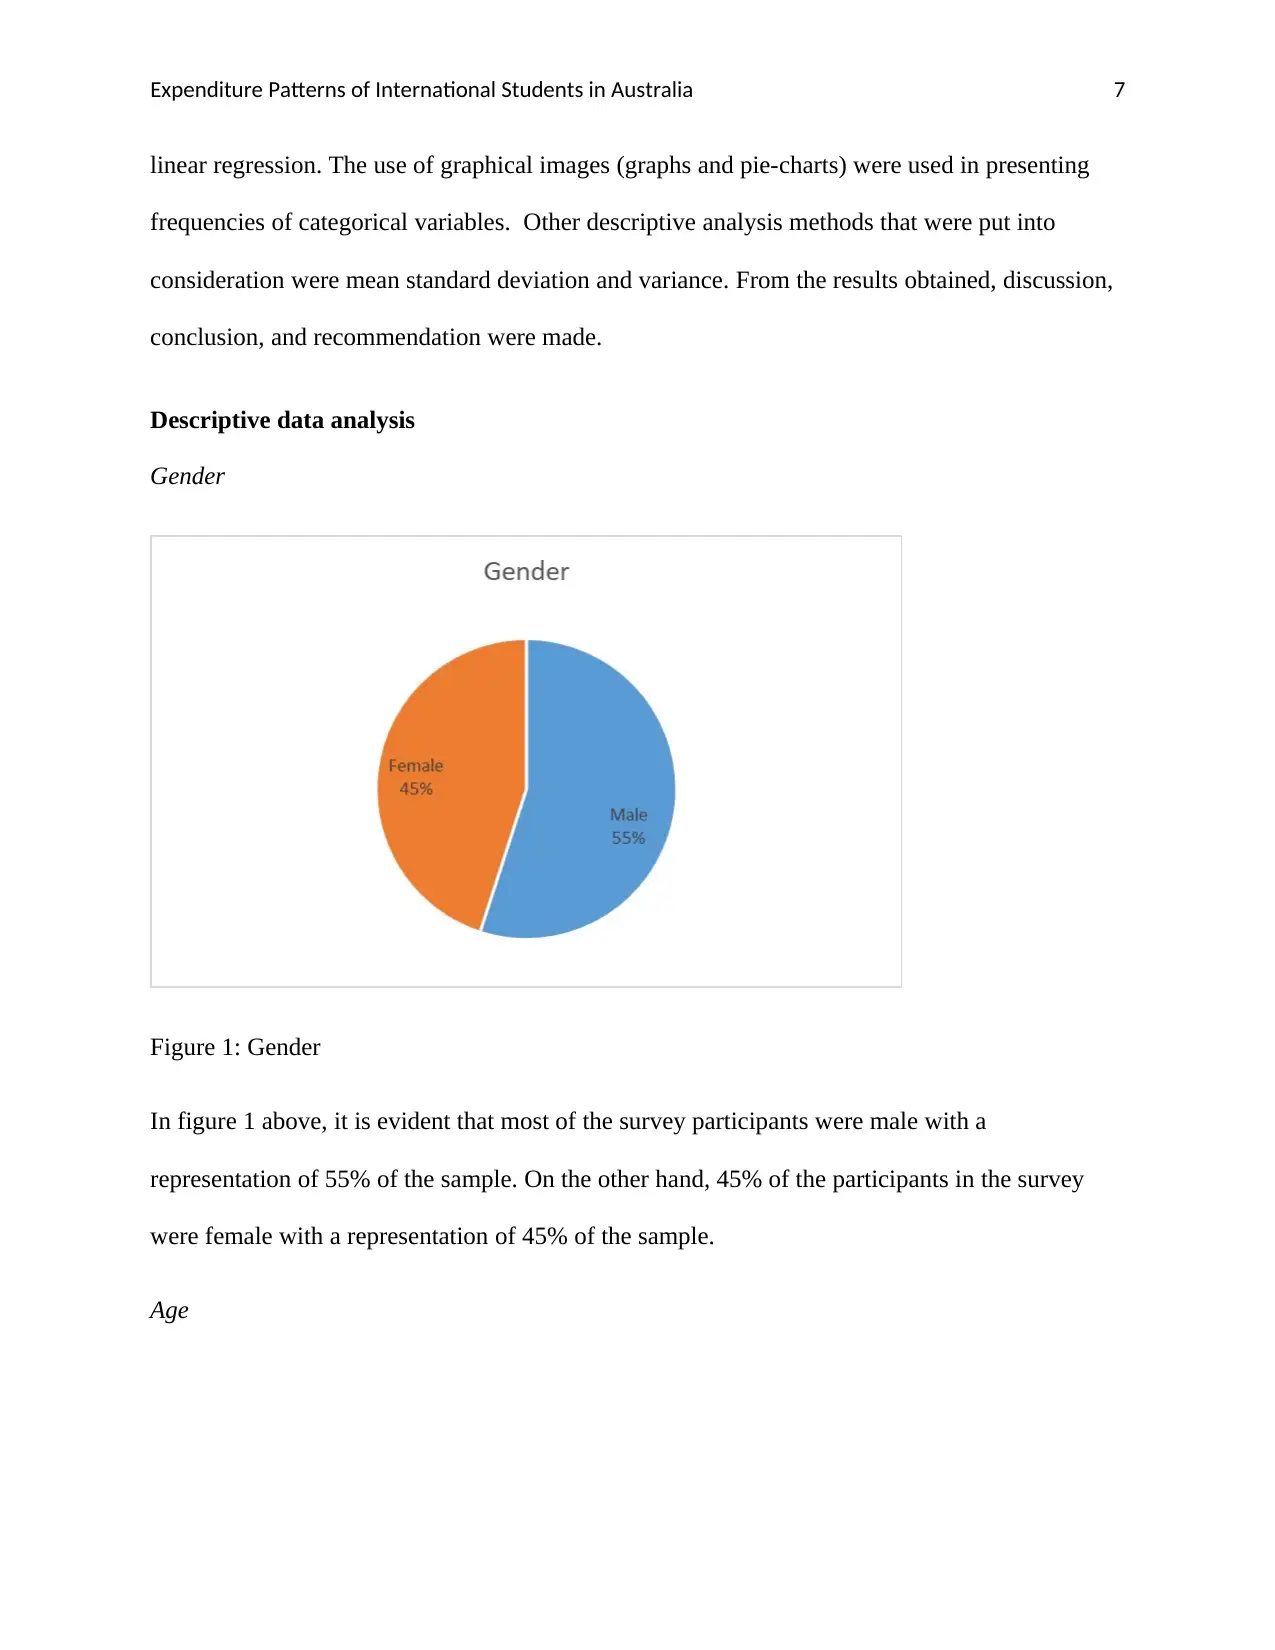
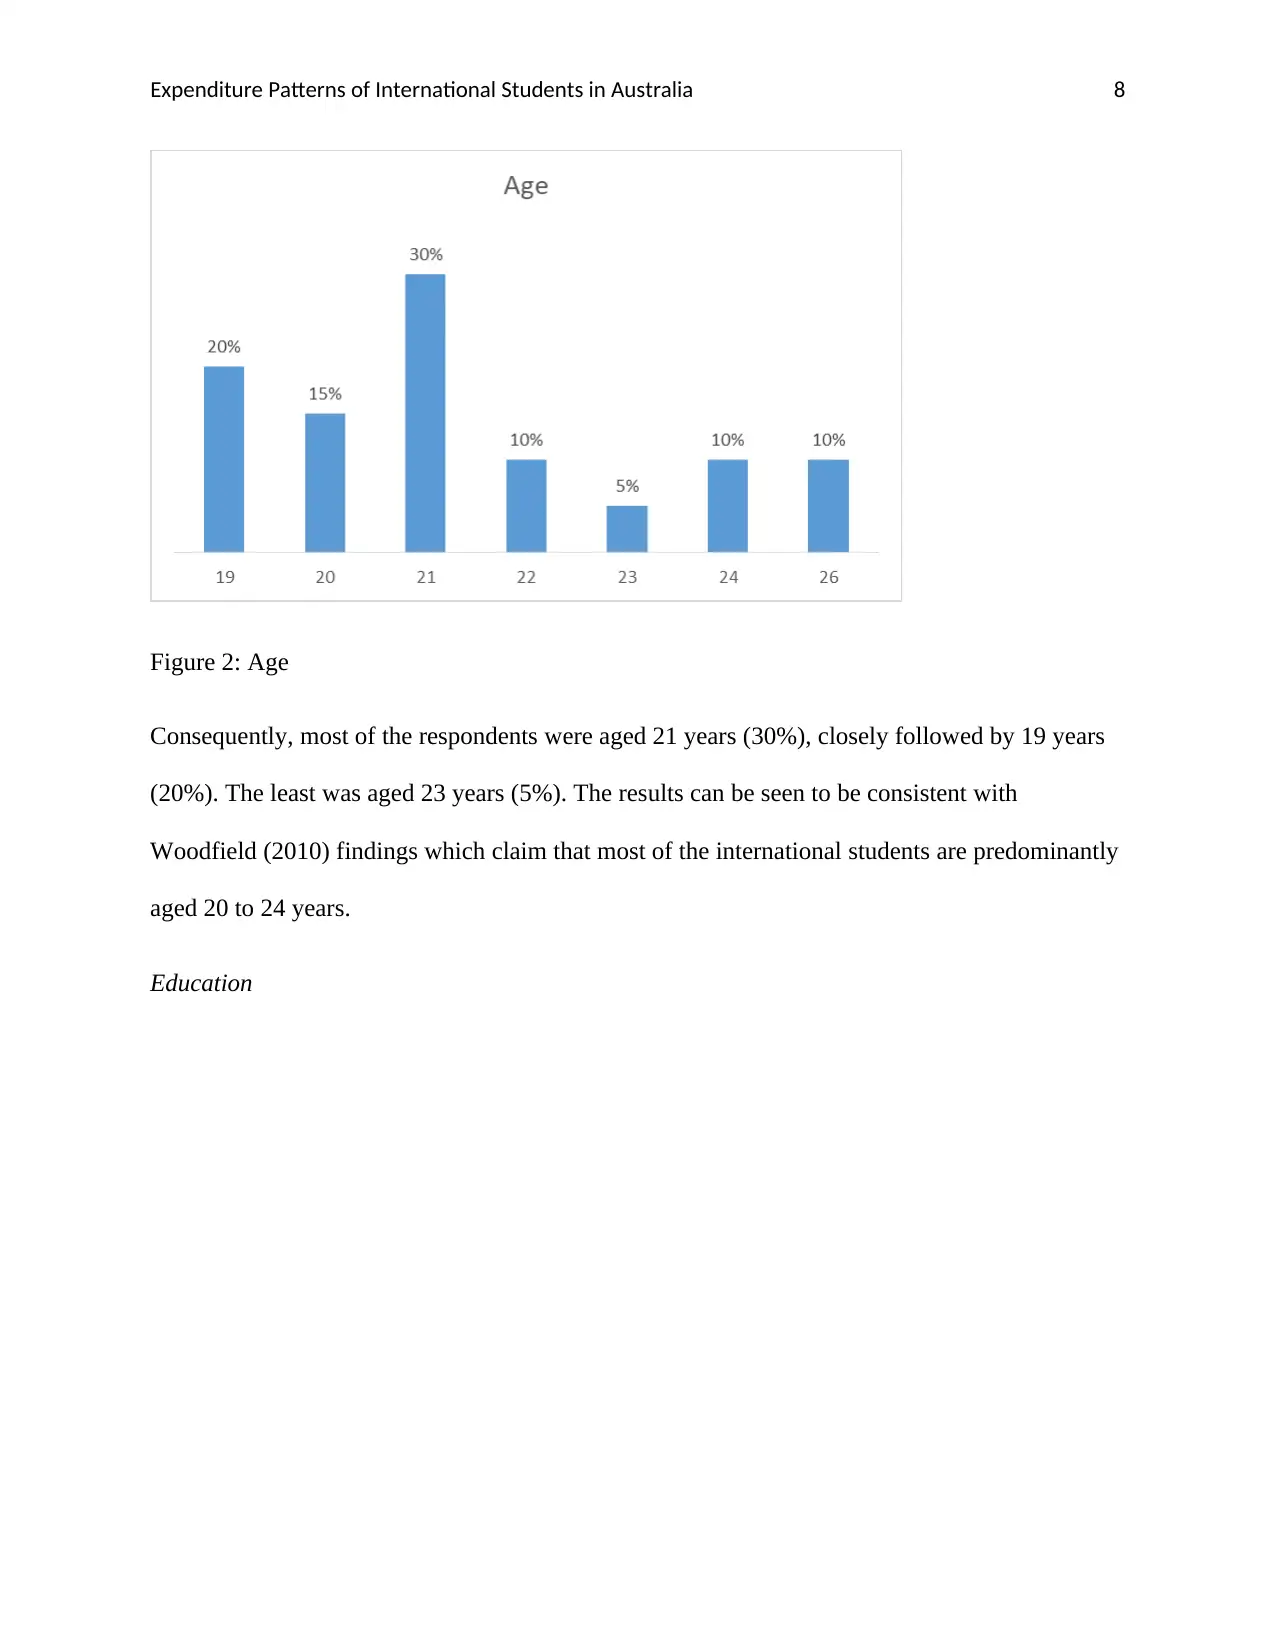
Figure 2: Age
Consequently, most of the respondents were aged 21 years (30%), closely followed by 19 years
(20%). The least was aged 23 years (5%). The results can be seen to be consistent with
Woodfield (2010) findings which claim that most of the international students are predominantly
aged 20 to 24 years.
Education
Expenditure Patterns of International Students in Australia 9
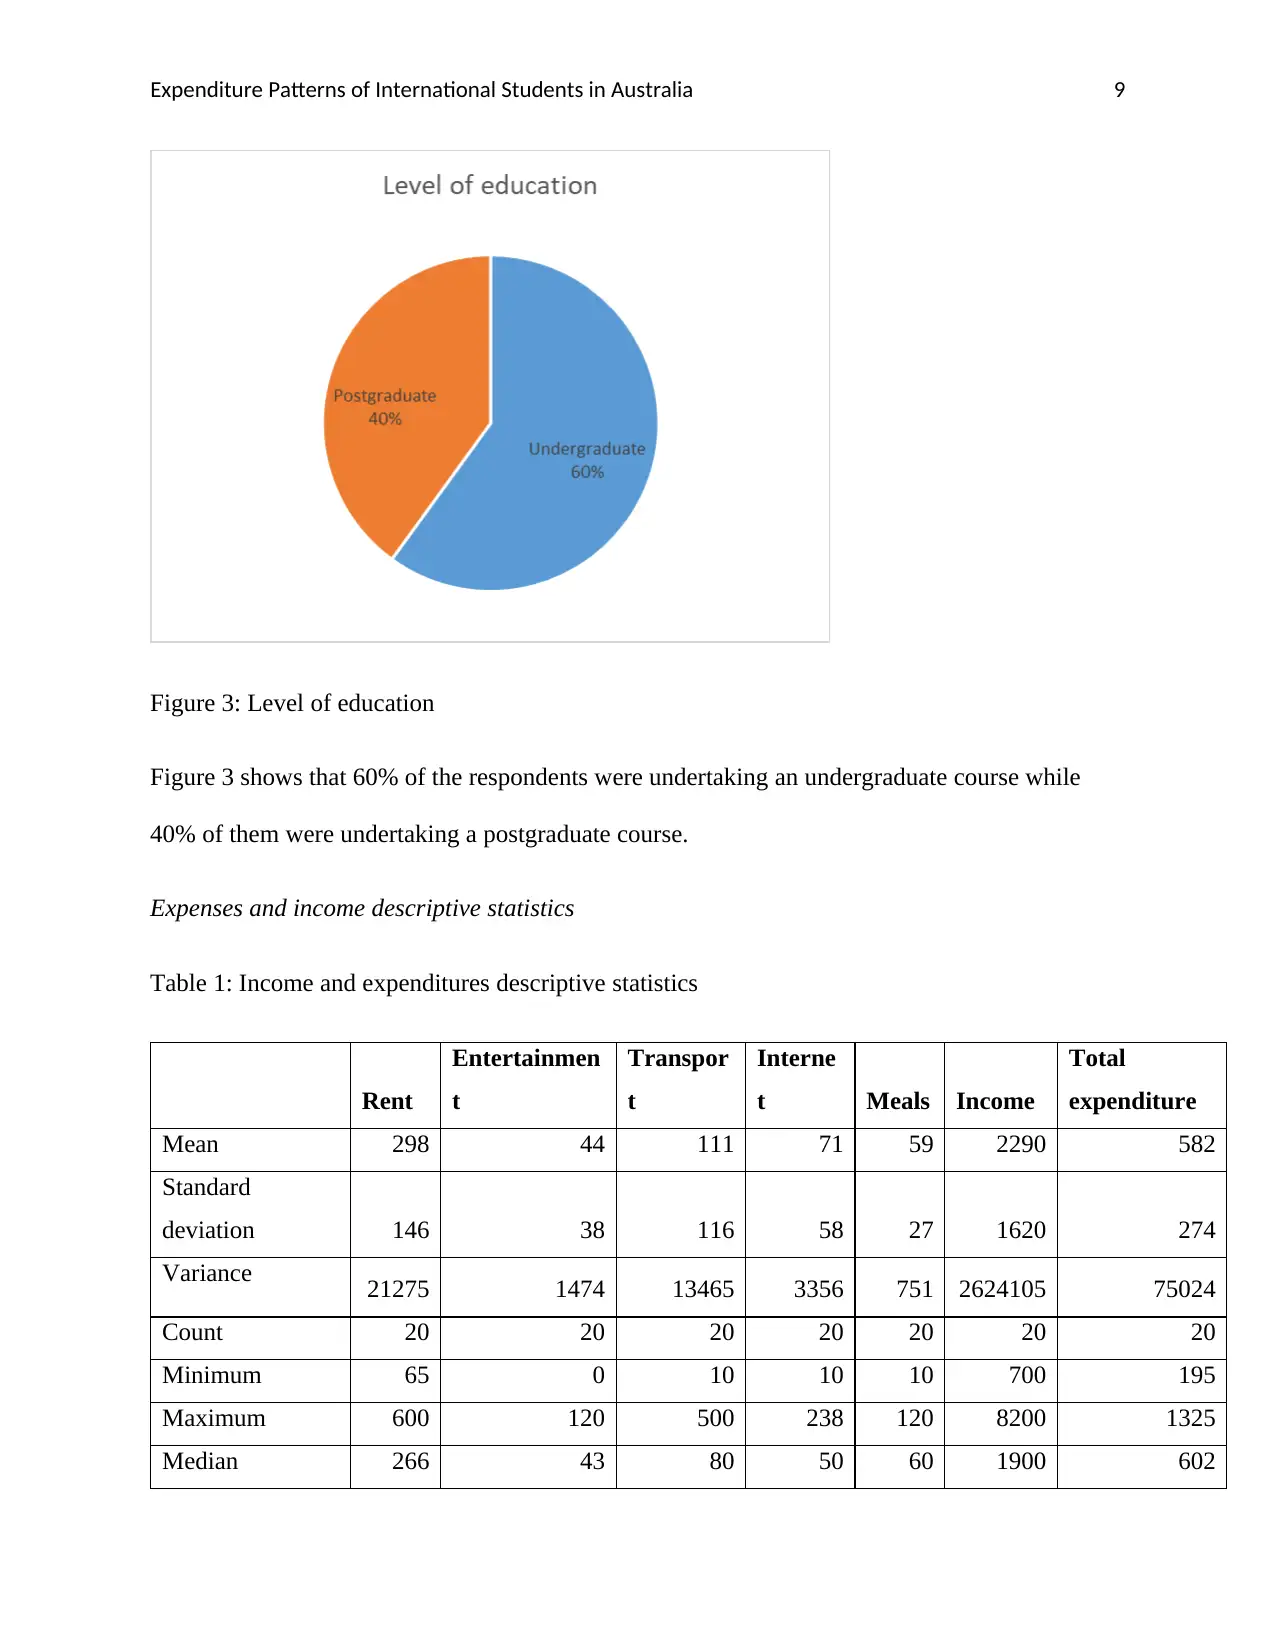
Figure 3: Level of education
Figure 3 shows that 60% of the respondents were undertaking an undergraduate course while
40% of them were undertaking a postgraduate course.
Expenses and income descriptive statistics
Table 1: Income and expenditures descriptive statistics
Rent
Entertainmen
t
Transpor
t
Interne
t Meals Income
Total
expenditure
Mean 298 44 111 71 59 2290 582
Standard
deviation 146 38 116 58 27 1620 274
Variance 21275 1474 13465 3356 751 2624105 75024
Count 20 20 20 20 20 20 20
Minimum 65 0 10 10 10 700 195
Maximum 600 120 500 238 120 8200 1325
Median 266 43 80 50 60 1900 602
⊘ This is a preview!⊘
Do you want full access?
Subscribe today to unlock all pages.
Trusted by 1+ million students worldwide
Expenditure Patterns of International Students in Australia 10
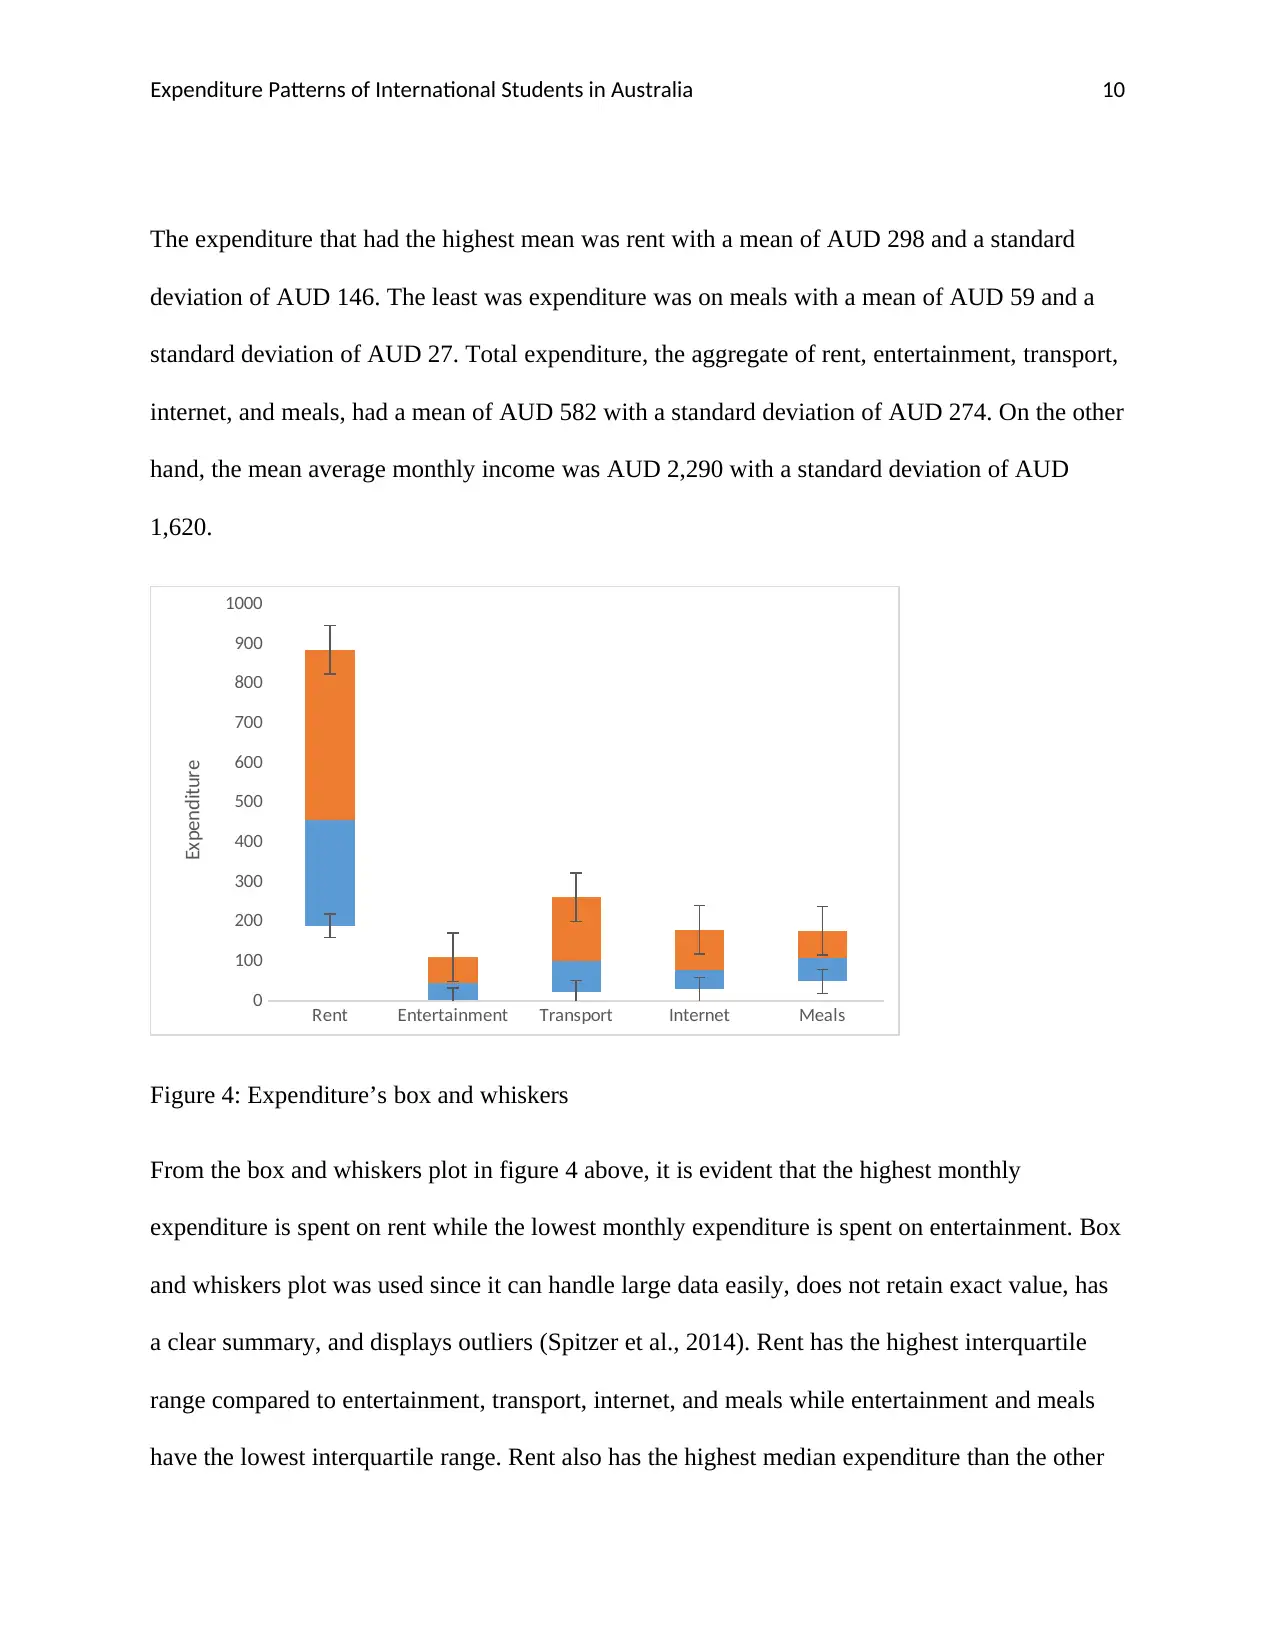
The expenditure that had the highest mean was rent with a mean of AUD 298 and a standard
deviation of AUD 146. The least was expenditure was on meals with a mean of AUD 59 and a
standard deviation of AUD 27. Total expenditure, the aggregate of rent, entertainment, transport,
internet, and meals, had a mean of AUD 582 with a standard deviation of AUD 274. On the other
hand, the mean average monthly income was AUD 2,290 with a standard deviation of AUD
1,620.
Rent Entertainment Transport Internet Meals
0
100
200
300
400
500
600
700
800
900
1000
Expenditure
Figure 4: Expenditure’s box and whiskers
From the box and whiskers plot in figure 4 above, it is evident that the highest monthly
expenditure is spent on rent while the lowest monthly expenditure is spent on entertainment. Box
and whiskers plot was used since it can handle large data easily, does not retain exact value, has
a clear summary, and displays outliers (Spitzer et al., 2014). Rent has the highest interquartile
range compared to entertainment, transport, internet, and meals while entertainment and meals
have the lowest interquartile range. Rent also has the highest median expenditure than the other
Paraphrase This Document
Need a fresh take? Get an instant paraphrase of this document with our AI Paraphraser
Expenditure Patterns of International Students in Australia 11
four items. The results, therefore, suggest that the highest expenditure is consistently spent on
rent while the lowest expenditure is consistently spent on entertainment. The results are
consistent with the finding of Robertson (2014) which ascertains that international students
spend most of their income on rent.
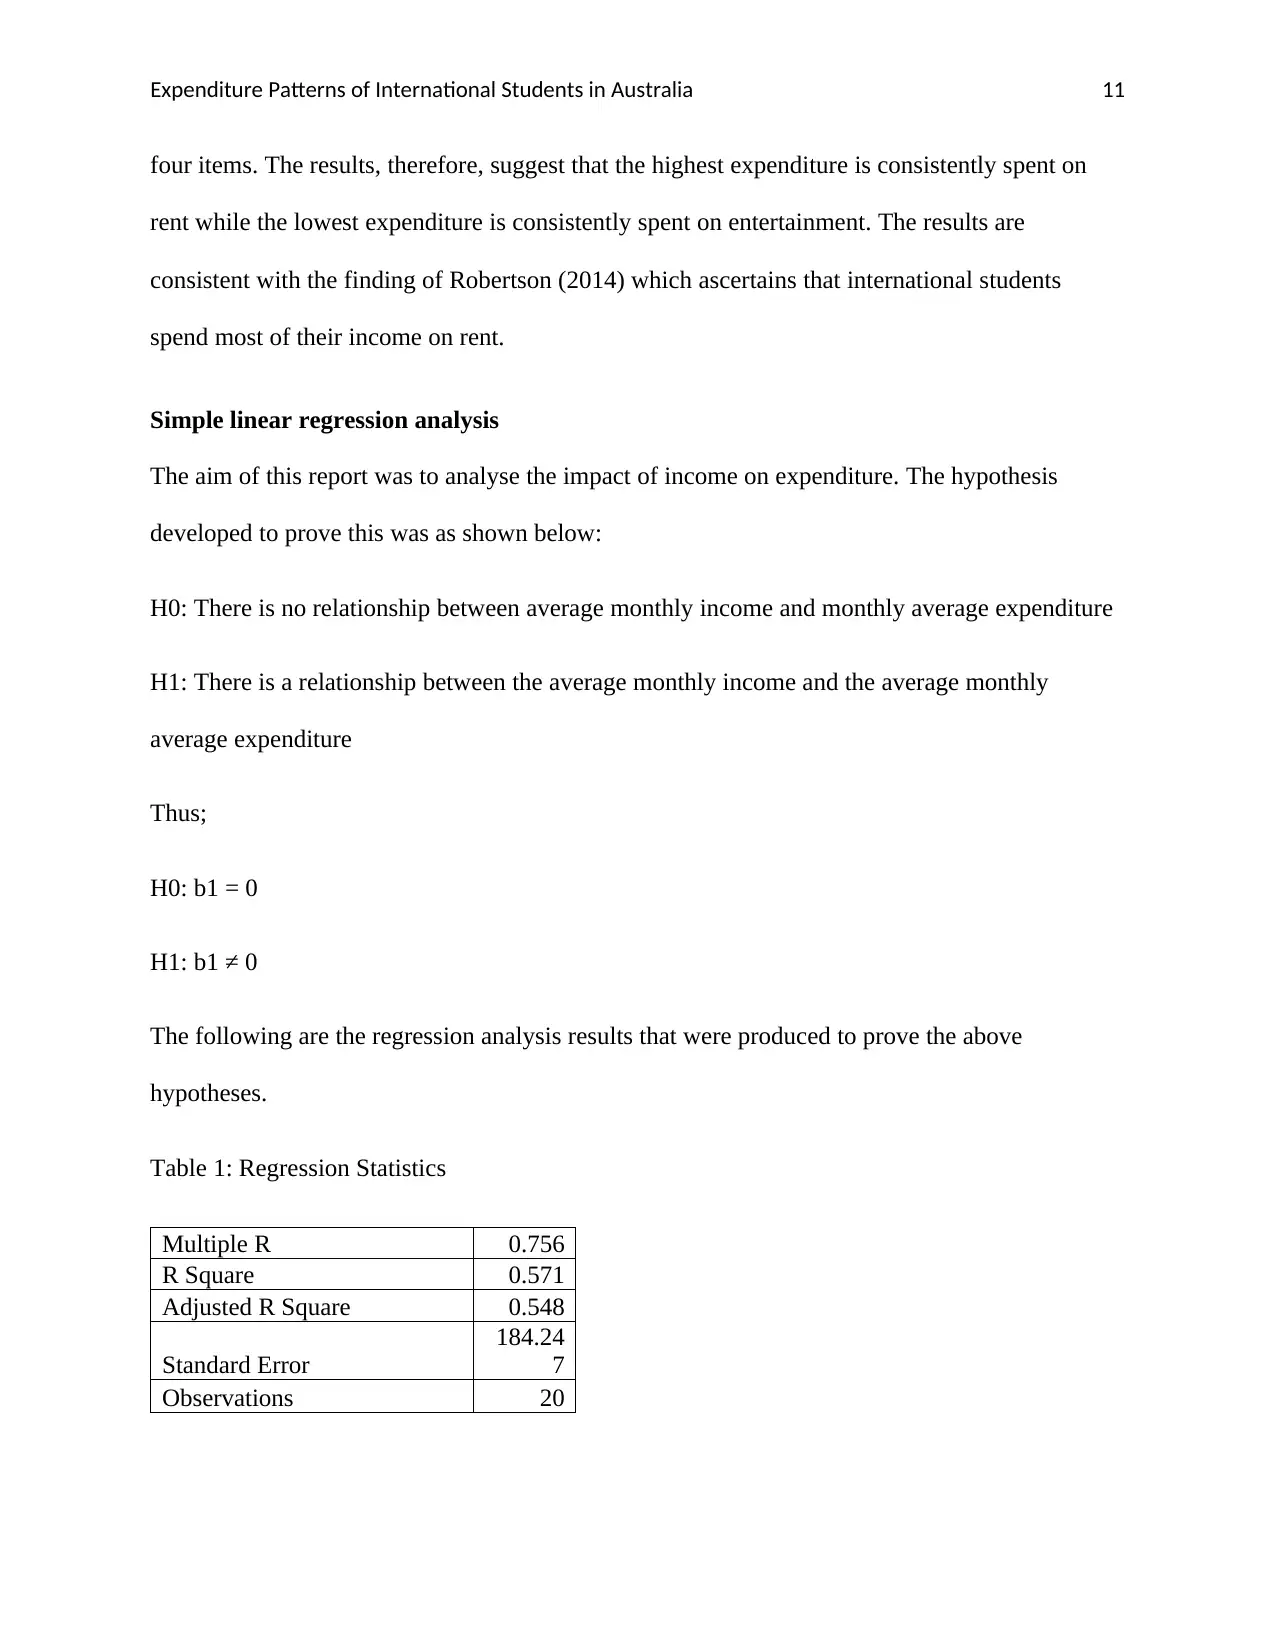
Simple linear regression analysis
The aim of this report was to analyse the impact of income on expenditure. The hypothesis
developed to prove this was as shown below:
H0: There is no relationship between average monthly income and monthly average expenditure
H1: There is a relationship between the average monthly income and the average monthly
average expenditure
Thus;
H0: b1 = 0
H1: b1 ≠ 0
The following are the regression analysis results that were produced to prove the above
hypotheses.
Table 1: Regression Statistics
Multiple R 0.756
R Square 0.571
Adjusted R Square 0.548
Standard Error
184.24
7
Observations 20
four items. The results, therefore, suggest that the highest expenditure is consistently spent on
rent while the lowest expenditure is consistently spent on entertainment. The results are
consistent with the finding of Robertson (2014) which ascertains that international students
spend most of their income on rent.
Simple linear regression analysis
The aim of this report was to analyse the impact of income on expenditure. The hypothesis
developed to prove this was as shown below:
H0: There is no relationship between average monthly income and monthly average expenditure
H1: There is a relationship between the average monthly income and the average monthly
average expenditure
Thus;
H0: b1 = 0
H1: b1 ≠ 0
The following are the regression analysis results that were produced to prove the above
hypotheses.
Table 1: Regression Statistics
Multiple R 0.756
R Square 0.571
Adjusted R Square 0.548
Standard Error
184.24
7
Observations 20
Expenditure Patterns of International Students in Australia 12
From table 1 above it can be seen that the adjusted coefficient of determination is 0.548. Thus, it
is evident that the variables in the model account for 54.8% of the variability. On the other hand,
45.2% of the variability is explained by other factors which are not in the model.
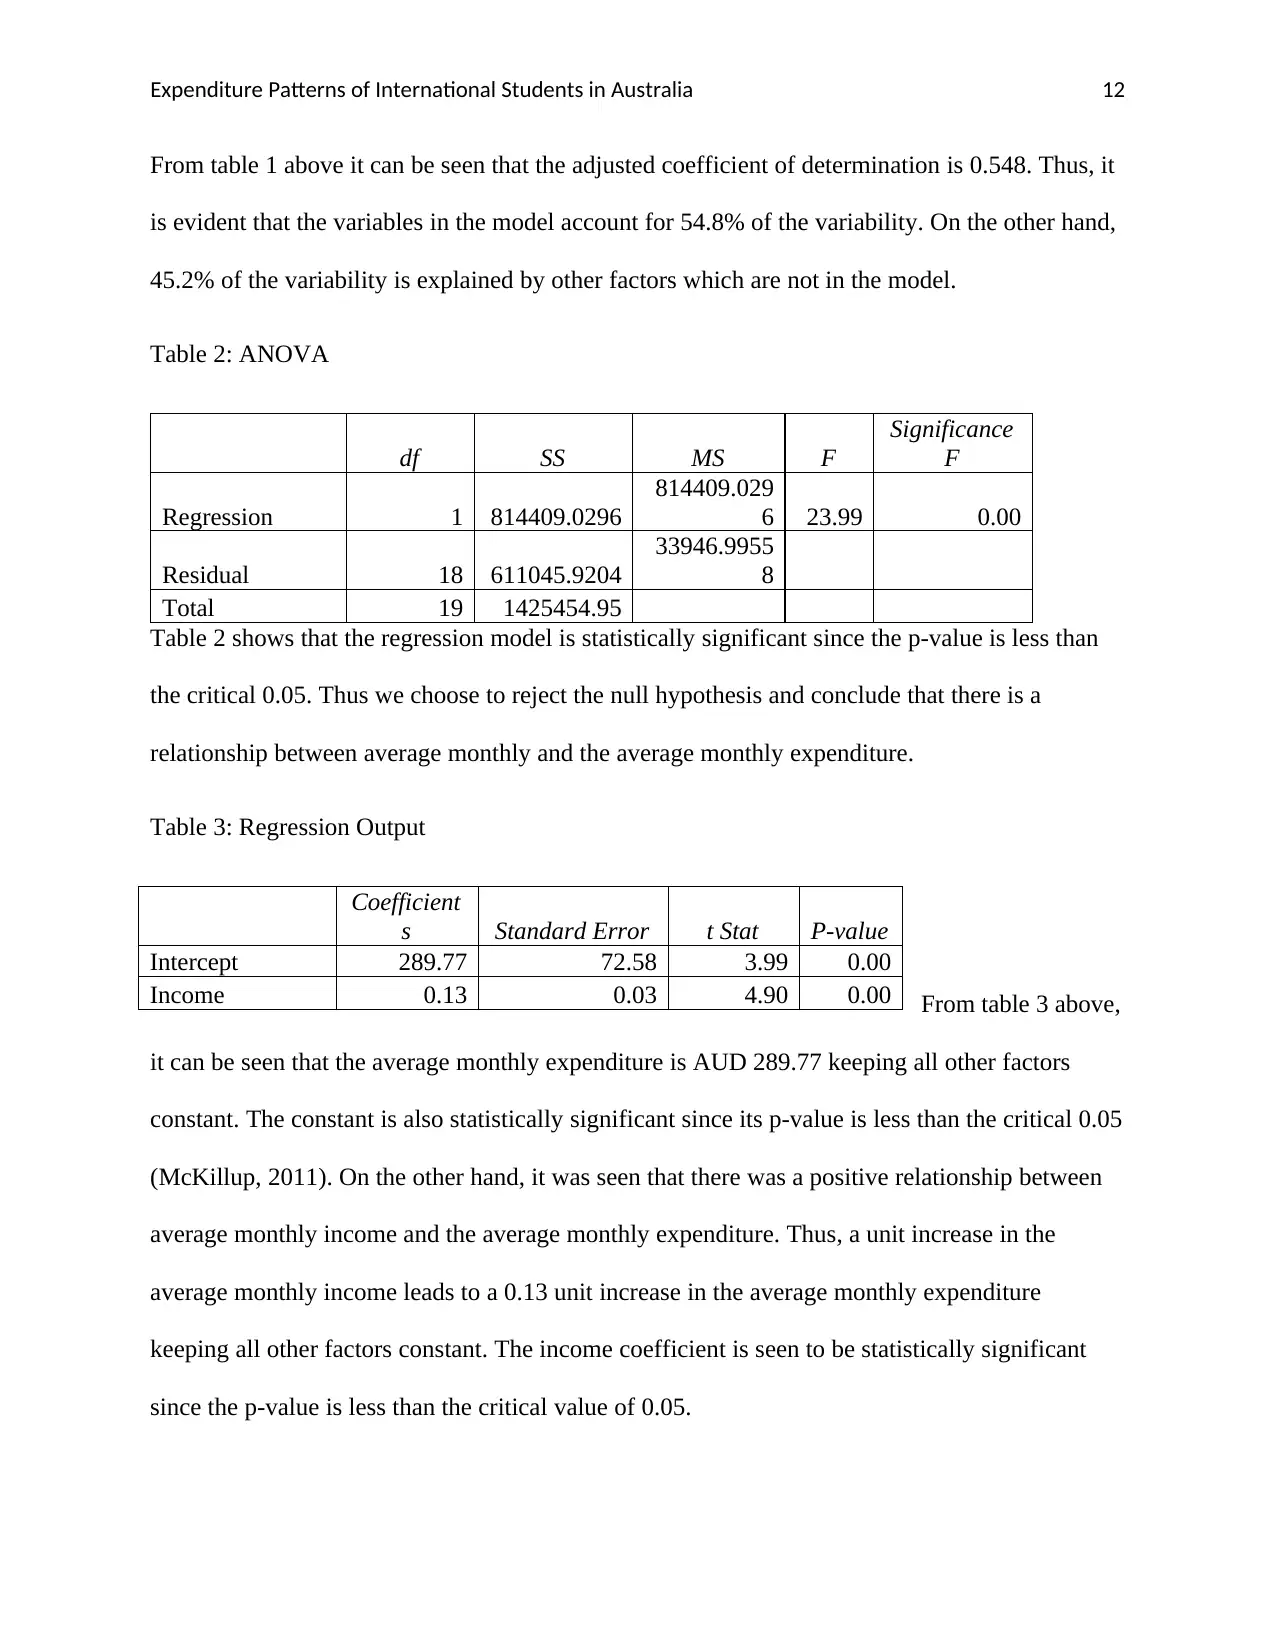
Table 2: ANOVA
df SS MS F
Significance
F
Regression 1 814409.0296
814409.029
6 23.99 0.00
Residual 18 611045.9204
33946.9955
8
Total 19 1425454.95
Table 2 shows that the regression model is statistically significant since the p-value is less than
the critical 0.05. Thus we choose to reject the null hypothesis and conclude that there is a
relationship between average monthly and the average monthly expenditure.
Table 3: Regression Output
From table 3 above,
it can be seen that the average monthly expenditure is AUD 289.77 keeping all other factors
constant. The constant is also statistically significant since its p-value is less than the critical 0.05
(McKillup, 2011). On the other hand, it was seen that there was a positive relationship between
average monthly income and the average monthly expenditure. Thus, a unit increase in the
average monthly income leads to a 0.13 unit increase in the average monthly expenditure
keeping all other factors constant. The income coefficient is seen to be statistically significant
since the p-value is less than the critical value of 0.05.
Coefficient
s Standard Error t Stat P-value
Intercept 289.77 72.58 3.99 0.00
Income 0.13 0.03 4.90 0.00
From table 1 above it can be seen that the adjusted coefficient of determination is 0.548. Thus, it
is evident that the variables in the model account for 54.8% of the variability. On the other hand,
45.2% of the variability is explained by other factors which are not in the model.
Table 2: ANOVA
df SS MS F
Significance
F
Regression 1 814409.0296
814409.029
6 23.99 0.00
Residual 18 611045.9204
33946.9955
8
Total 19 1425454.95
Table 2 shows that the regression model is statistically significant since the p-value is less than
the critical 0.05. Thus we choose to reject the null hypothesis and conclude that there is a
relationship between average monthly and the average monthly expenditure.
Table 3: Regression Output
From table 3 above,
it can be seen that the average monthly expenditure is AUD 289.77 keeping all other factors
constant. The constant is also statistically significant since its p-value is less than the critical 0.05
(McKillup, 2011). On the other hand, it was seen that there was a positive relationship between
average monthly income and the average monthly expenditure. Thus, a unit increase in the
average monthly income leads to a 0.13 unit increase in the average monthly expenditure
keeping all other factors constant. The income coefficient is seen to be statistically significant
since the p-value is less than the critical value of 0.05.
Coefficient
s Standard Error t Stat P-value
Intercept 289.77 72.58 3.99 0.00
Income 0.13 0.03 4.90 0.00
⊘ This is a preview!⊘
Do you want full access?
Subscribe today to unlock all pages.
Trusted by 1+ million students worldwide
1 out of 17
Related Documents


Your All-in-One AI-Powered Toolkit for Academic Success.
+13062052269
info@desklib.com
Available 24*7 on WhatsApp / Email
![[object Object]](/_next/static/media/star-bottom.7253800d.svg)
Unlock your academic potential
Copyright © 2020–2026 A2Z Services. All Rights Reserved. Developed and managed by ZUCOL.