Report on Student Satisfaction and Experience at UKCBC College
VerifiedAdded on 2020/06/03
|28
|4882
|131
Report
AI Summary
This report analyzes student satisfaction and experience at UKCBC College, a UK-based educational institution. The research aims to assess student feedback on the quality of education provided. The study uses both primary and secondary data collection methods, including questionnaires distributed across multiple campuses and reviews of existing literature. Statistical tools like mean, median, mode, range, and standard deviation are employed to analyze the collected data from a sample of 20 students. The report includes a detailed survey methodology, a questionnaire design, and the results of the statistical analysis. Findings indicate a generally positive perception of teaching quality and facilities, with specific rankings and interpretations provided. The report concludes with recommendations for UKCBC to further enhance the student experience. Investment appraisal techniques are also discussed, and a budget for the research project is presented. Desklib provides this and other academic resources to aid students.

BUSINESS DECISION
MAKING
MAKING
Paraphrase This Document
Need a fresh take? Get an instant paraphrase of this document with our AI Paraphraser
⊘ This is a preview!⊘
Do you want full access?
Subscribe today to unlock all pages.
Trusted by 1+ million students worldwide
INTRODUCTION
Each and every business entity concerns towards making effective as well as fruitful
decision within working environment. The reason is that, effective business decisions supports it
in becoming more beneficial in terms of financial and others. Present study is based on UKCBC
college which is operating in UK and provide educational facility to the students. Aim of the
current research is to analyse level of satisfaction as well as experience of the students from the
education provided by the college. In this study, information are gathered with the help of
questionnaire and statistical tools are applied on the data set. Apart from this, with the help of
thematic analysis data are represented and conclusion is derived that up to what extent students
of UKCBC college are satisfied with the education system of it. At the end of project, network
diagram, information processing tools and methods as well as calculation of investment appraisal
techniques are explained properly. Further, recommendations to the respective college is given
for undertaking project within workplace.
TASK 1
1.1 Create a plan in order to collect information from students of UKCB college
As per the given scenario of experience and satisfaction of UKCBC students, So that they
need the primary and secondary data for effective decision.
Primary Data- In which data are collected in first time in the research. Primary data are
collected by making effective survey mean that a questionnaire, calls etc. This methods is very
useful to UKCB, so that by using such methods for collecting the primary data; it provides
enough information about there student satisfaction (Suttorp and et.al., 2015). Data is collected
by filling the questionnaire or sending the questionnaire to the students. In these methods,
questions are prepared and send to the student in the form of email or by getting the feedback
using of social sites.
Secondary data- Secondary data are those data which are already collected but by
making some alternation collected information are used in the form of secondary data. In this all
the information and data are collected by using books, journals, internet sources etc. So that this
method is refers as cost effective method for UKCB. In another. But this method requires lots of
time to take an effective collection process (Bantug and et.al., 2016).
1
Paraphrase This Document
Need a fresh take? Get an instant paraphrase of this document with our AI Paraphraser
Duration of survey:- The survey will be completed in 17 days duration.
Location of campuses:- Wentworth House- main campus(East London), Cricklewood
campus (North West London), Lords House campus (East London), Holborn campus (Central
London). They all are campus their conduct research on students about their experience and
satisfaction.
In order to conducting the overall research and making proper conclusion there are
several numbers of resources are highly required by the manager. Very basic resources which are
needed for the proper research are like human, financial and stationary etc (Danforth and et.al.,
2016).
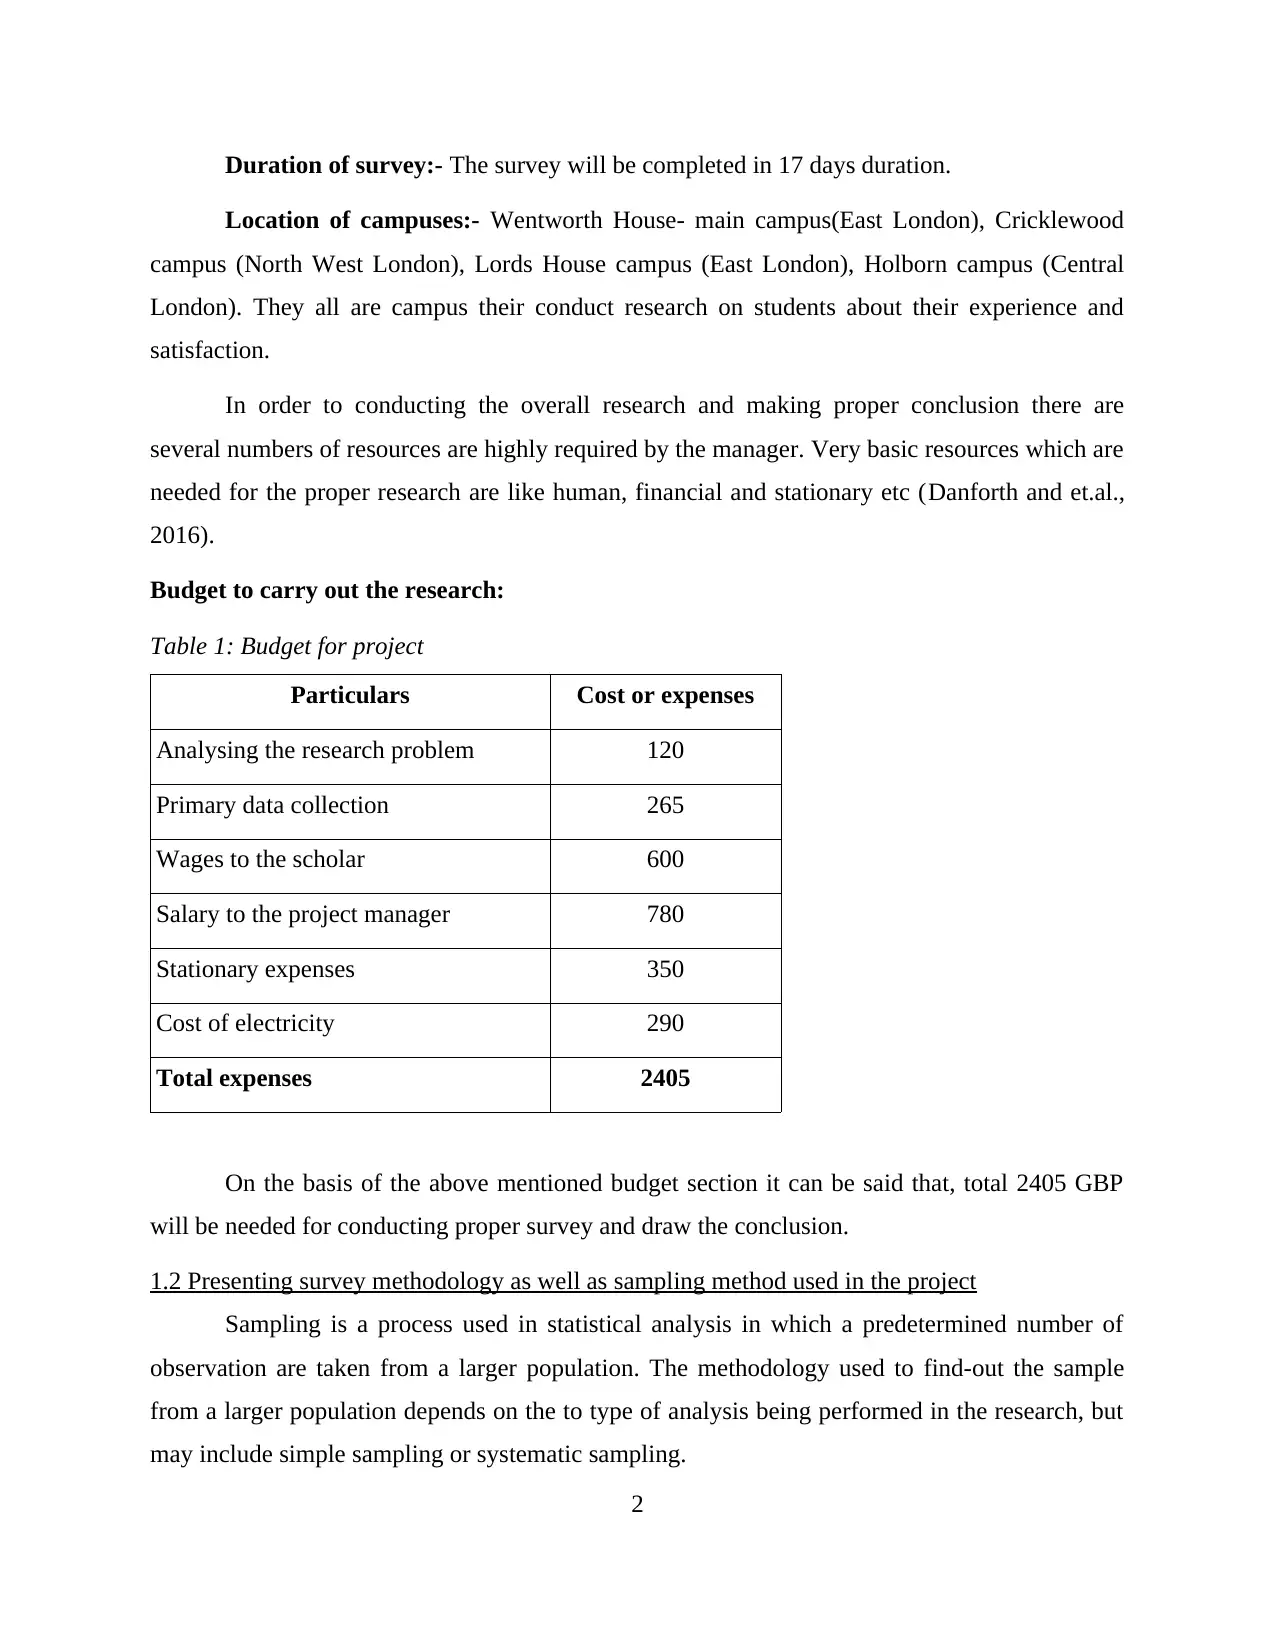
Budget to carry out the research:
Table 1: Budget for project
Particulars Cost or expenses
Analysing the research problem 120
Primary data collection 265
Wages to the scholar 600
Salary to the project manager 780
Stationary expenses 350
Cost of electricity 290
Total expenses 2405
On the basis of the above mentioned budget section it can be said that, total 2405 GBP
will be needed for conducting proper survey and draw the conclusion.
1.2 Presenting survey methodology as well as sampling method used in the project
Sampling is a process used in statistical analysis in which a predetermined number of
observation are taken from a larger population. The methodology used to find-out the sample
from a larger population depends on the to type of analysis being performed in the research, but
may include simple sampling or systematic sampling.
2
Location of campuses:- Wentworth House- main campus(East London), Cricklewood
campus (North West London), Lords House campus (East London), Holborn campus (Central
London). They all are campus their conduct research on students about their experience and
satisfaction.
In order to conducting the overall research and making proper conclusion there are
several numbers of resources are highly required by the manager. Very basic resources which are
needed for the proper research are like human, financial and stationary etc (Danforth and et.al.,
2016).
Budget to carry out the research:
Table 1: Budget for project
Particulars Cost or expenses
Analysing the research problem 120
Primary data collection 265
Wages to the scholar 600
Salary to the project manager 780
Stationary expenses 350
Cost of electricity 290
Total expenses 2405
On the basis of the above mentioned budget section it can be said that, total 2405 GBP
will be needed for conducting proper survey and draw the conclusion.
1.2 Presenting survey methodology as well as sampling method used in the project
Sampling is a process used in statistical analysis in which a predetermined number of
observation are taken from a larger population. The methodology used to find-out the sample
from a larger population depends on the to type of analysis being performed in the research, but
may include simple sampling or systematic sampling.
2
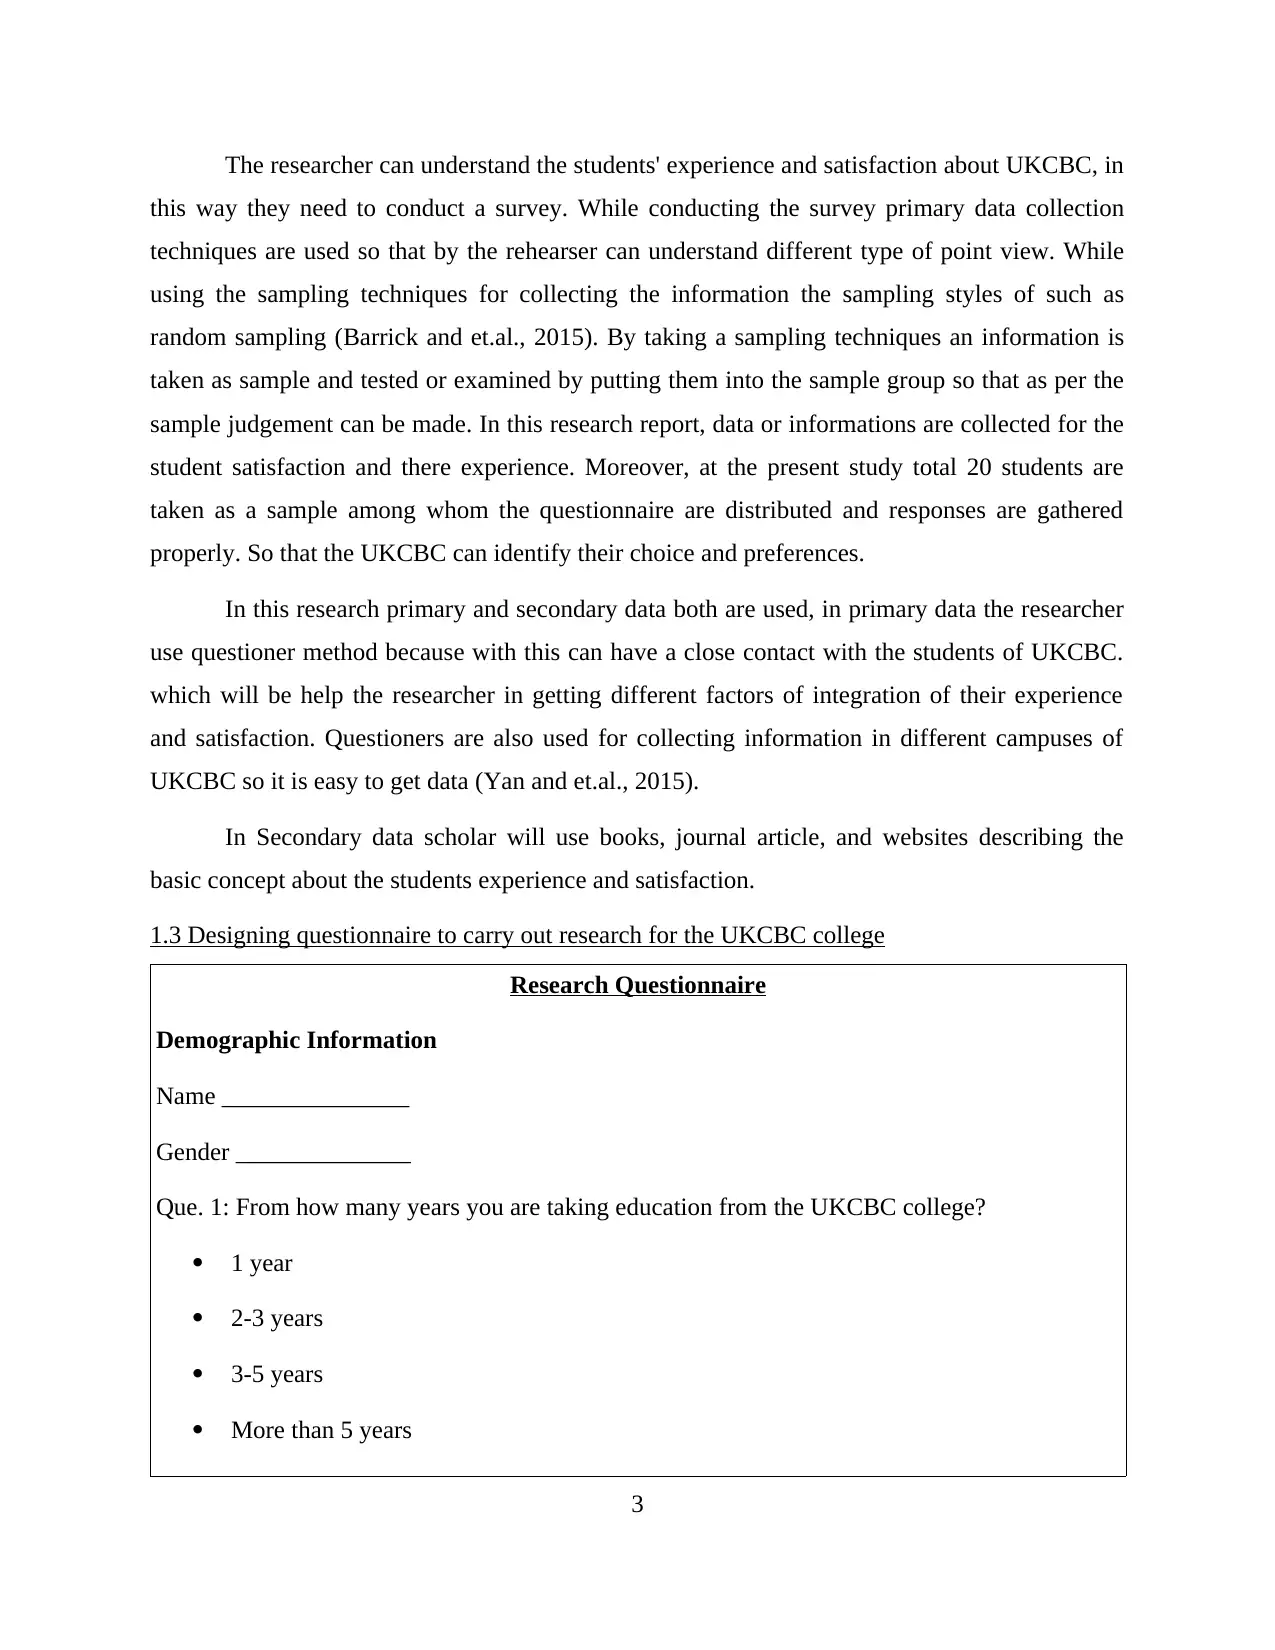
The researcher can understand the students' experience and satisfaction about UKCBC, in
this way they need to conduct a survey. While conducting the survey primary data collection
techniques are used so that by the rehearser can understand different type of point view. While
using the sampling techniques for collecting the information the sampling styles of such as
random sampling (Barrick and et.al., 2015). By taking a sampling techniques an information is
taken as sample and tested or examined by putting them into the sample group so that as per the
sample judgement can be made. In this research report, data or informations are collected for the
student satisfaction and there experience. Moreover, at the present study total 20 students are
taken as a sample among whom the questionnaire are distributed and responses are gathered
properly. So that the UKCBC can identify their choice and preferences.
In this research primary and secondary data both are used, in primary data the researcher
use questioner method because with this can have a close contact with the students of UKCBC.
which will be help the researcher in getting different factors of integration of their experience
and satisfaction. Questioners are also used for collecting information in different campuses of
UKCBC so it is easy to get data (Yan and et.al., 2015).
In Secondary data scholar will use books, journal article, and websites describing the
basic concept about the students experience and satisfaction.
1.3 Designing questionnaire to carry out research for the UKCBC college
Research Questionnaire
Demographic Information
Name _______________
Gender ______________
Que. 1: From how many years you are taking education from the UKCBC college?
1 year
2-3 years
3-5 years
More than 5 years
3
⊘ This is a preview!⊘
Do you want full access?
Subscribe today to unlock all pages.
Trusted by 1+ million students worldwide
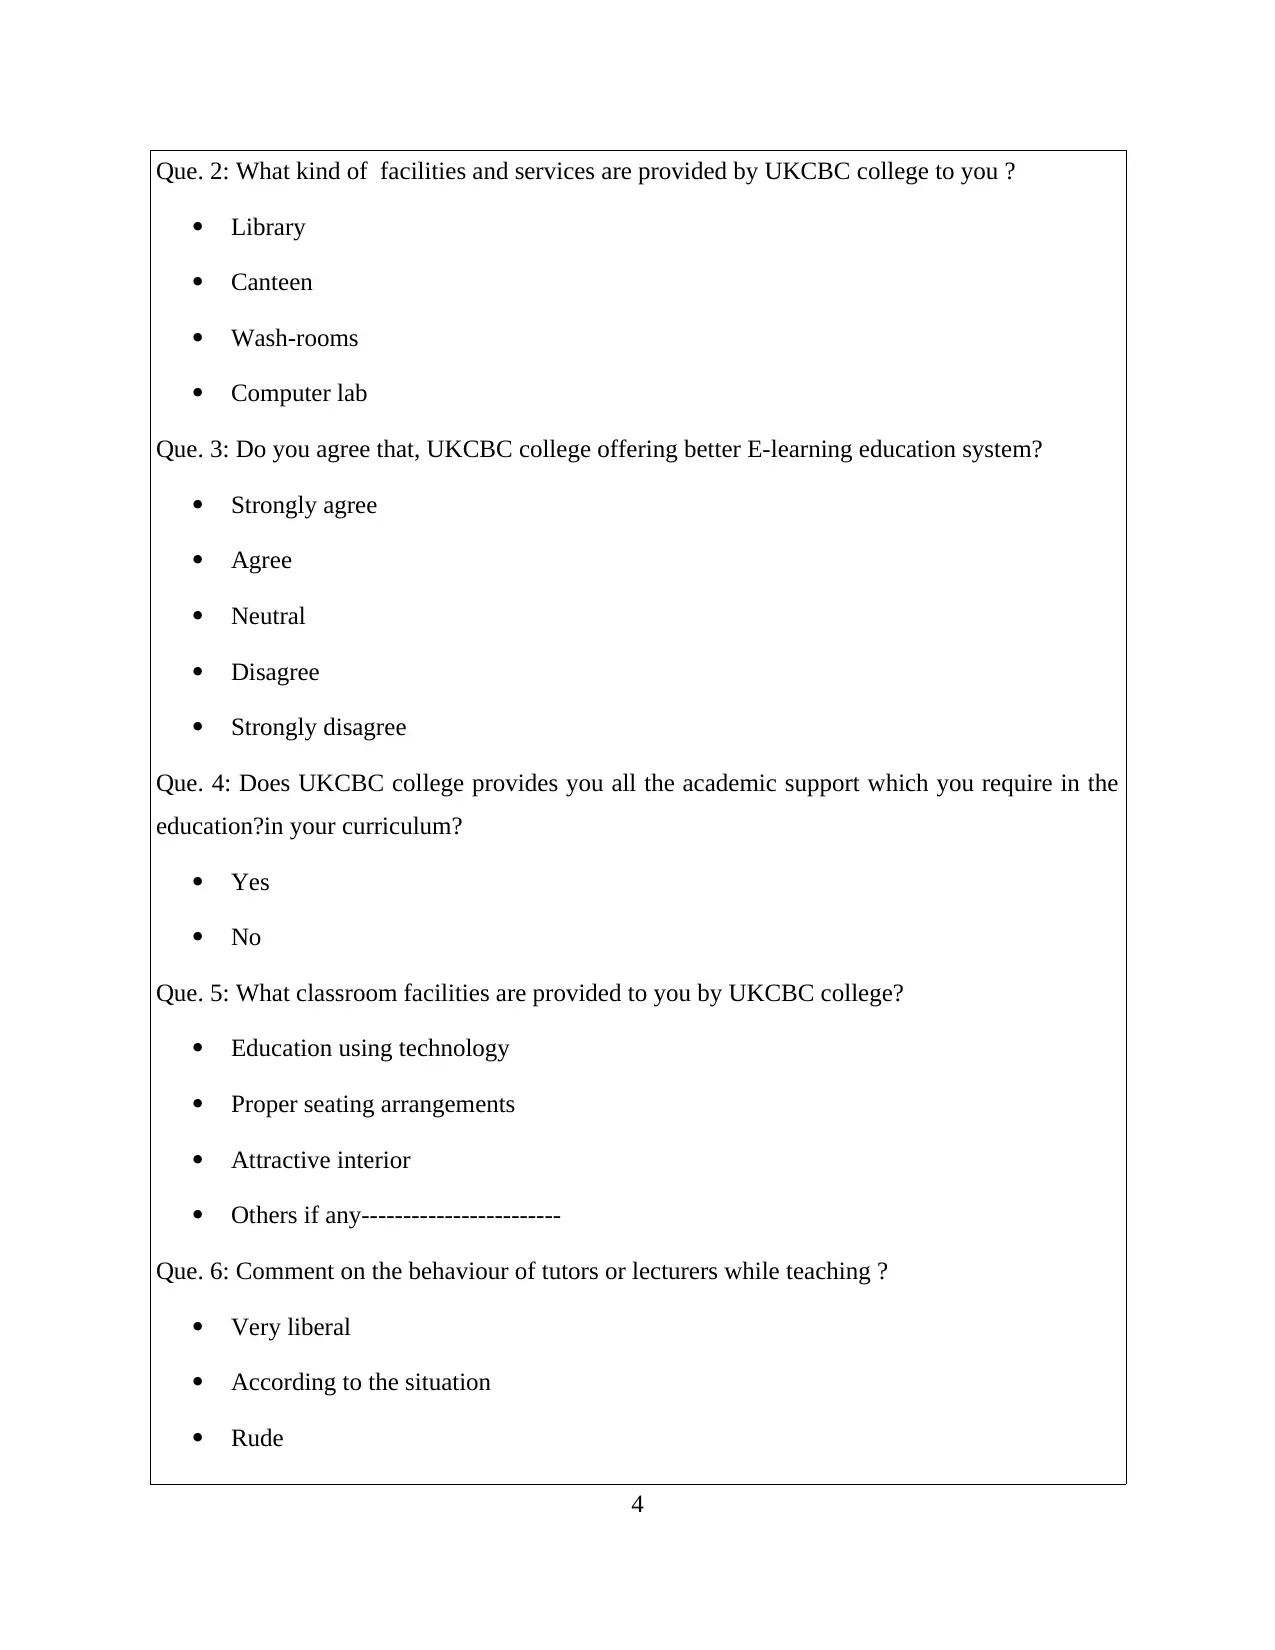
Que. 2: What kind of facilities and services are provided by UKCBC college to you ?
Library
Canteen
Wash-rooms
Computer lab
Que. 3: Do you agree that, UKCBC college offering better E-learning education system?
Strongly agree
Agree
Neutral
Disagree
Strongly disagree
Que. 4: Does UKCBC college provides you all the academic support which you require in the
education?in your curriculum?
Yes
No
Que. 5: What classroom facilities are provided to you by UKCBC college?
Education using technology
Proper seating arrangements
Attractive interior
Others if any------------------------
Que. 6: Comment on the behaviour of tutors or lecturers while teaching ?
Very liberal
According to the situation
Rude
4
Paraphrase This Document
Need a fresh take? Get an instant paraphrase of this document with our AI Paraphraser
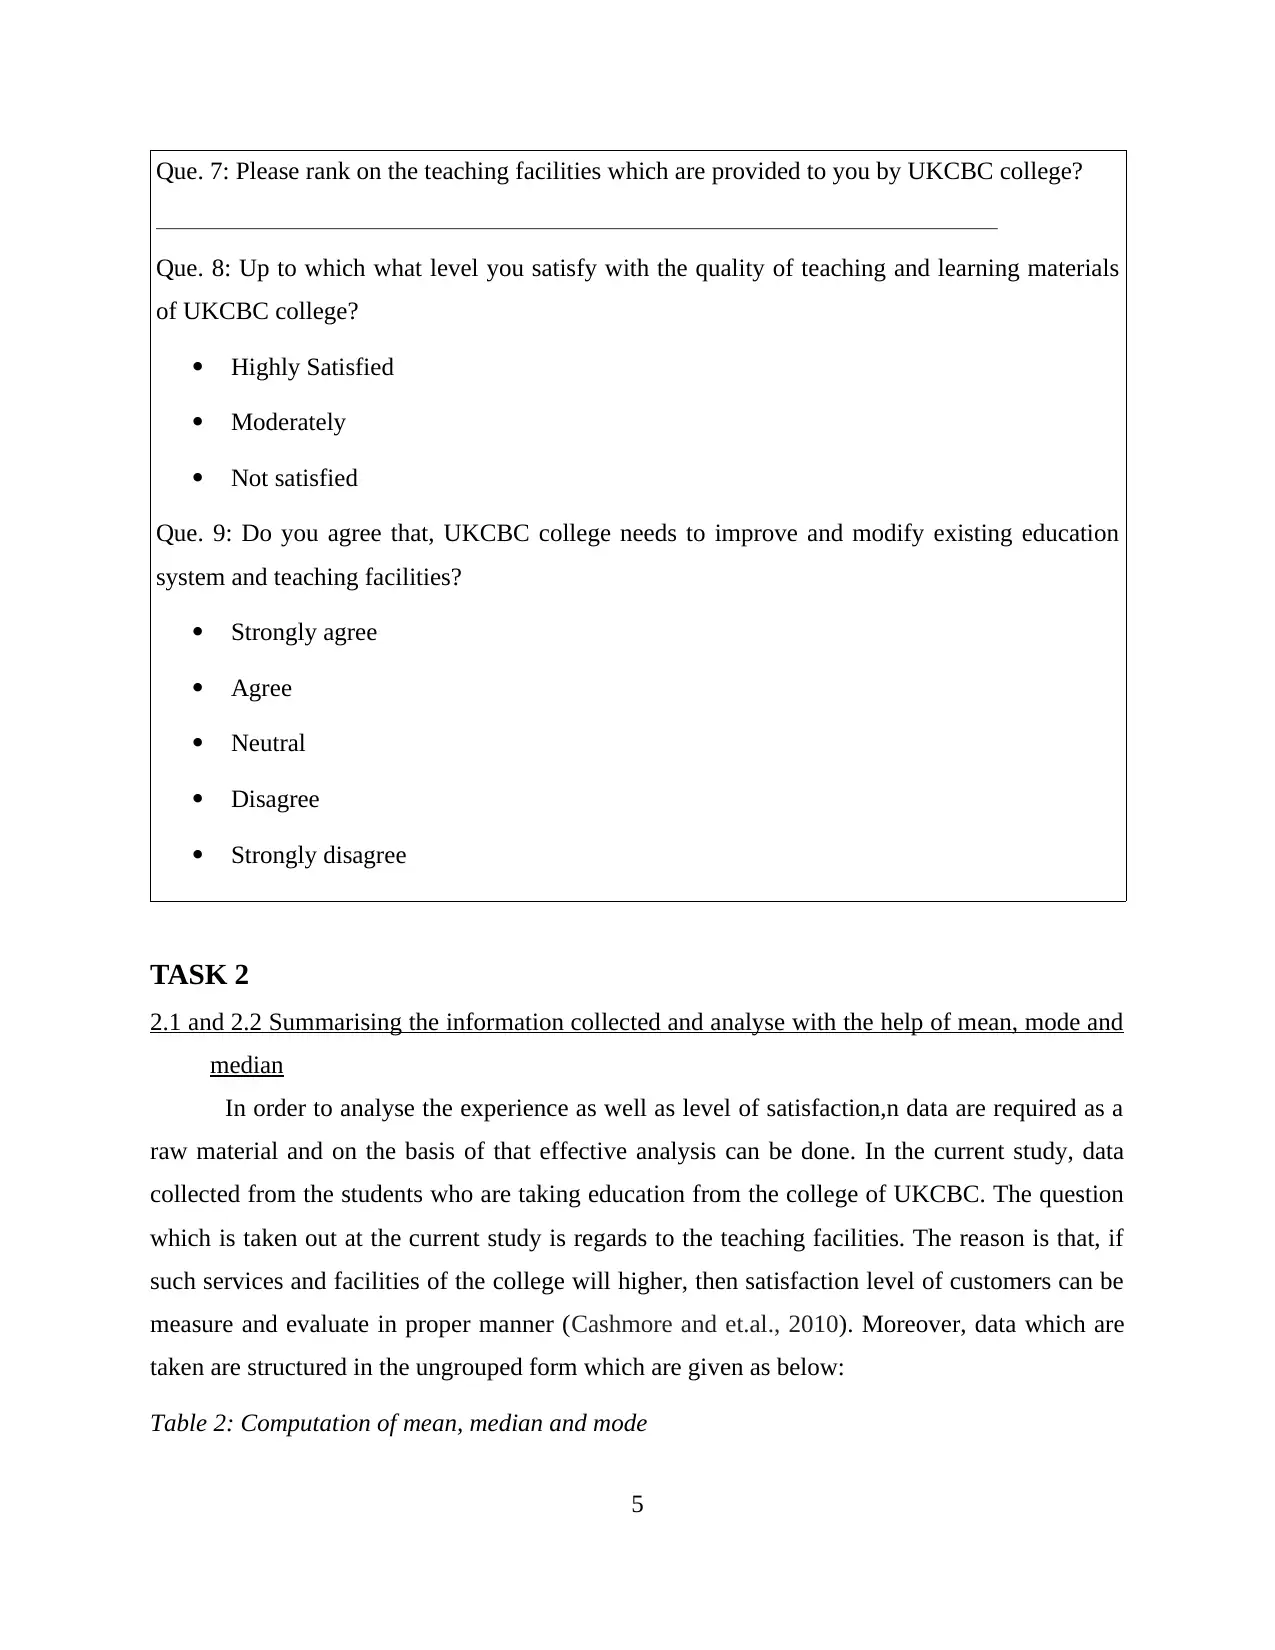
Que. 7: Please rank on the teaching facilities which are provided to you by UKCBC college?
_____________________________________________________________________________________________________
Que. 8: Up to which what level you satisfy with the quality of teaching and learning materials
of UKCBC college?
Highly Satisfied
Moderately
Not satisfied
Que. 9: Do you agree that, UKCBC college needs to improve and modify existing education
system and teaching facilities?
Strongly agree
Agree
Neutral
Disagree
Strongly disagree
TASK 2
2.1 and 2.2 Summarising the information collected and analyse with the help of mean, mode and
median
In order to analyse the experience as well as level of satisfaction,n data are required as a
raw material and on the basis of that effective analysis can be done. In the current study, data
collected from the students who are taking education from the college of UKCBC. The question
which is taken out at the current study is regards to the teaching facilities. The reason is that, if
such services and facilities of the college will higher, then satisfaction level of customers can be
measure and evaluate in proper manner (Cashmore and et.al., 2010). Moreover, data which are
taken are structured in the ungrouped form which are given as below:
Table 2: Computation of mean, median and mode
5
No. of students Rank (out of 100)
1 60
2 74
3 40
4 81
5 69
6 78
7 90
8 87
9 68
10 73
11 58
12 63
13 92
14 83
15 25
16 81
17 75
18 72
19 93
20 43
Mean 70.25
Median 73.5
Mode 81
6
1 60
2 74
3 40
4 81
5 69
6 78
7 90
8 87
9 68
10 73
11 58
12 63
13 92
14 83
15 25
16 81
17 75
18 72
19 93
20 43
Mean 70.25
Median 73.5
Mode 81
6
⊘ This is a preview!⊘
Do you want full access?
Subscribe today to unlock all pages.
Trusted by 1+ million students worldwide
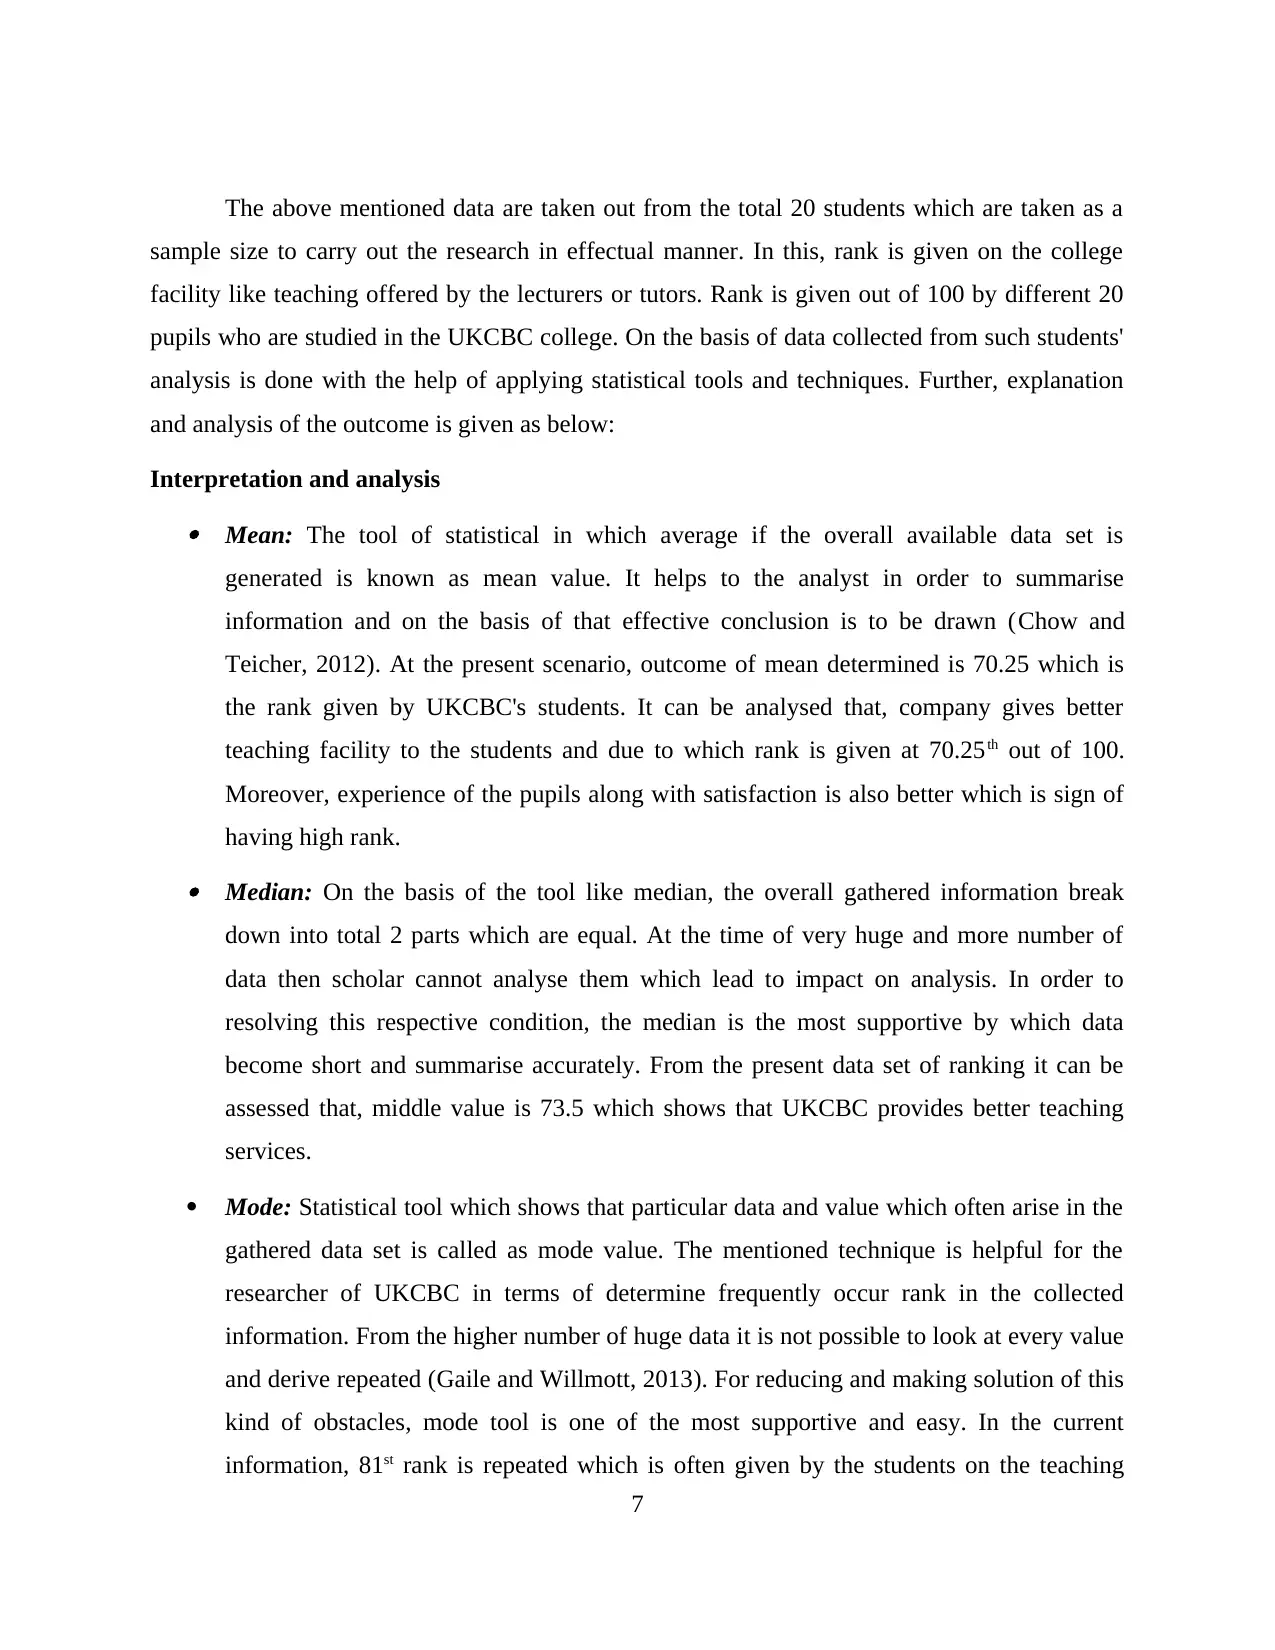
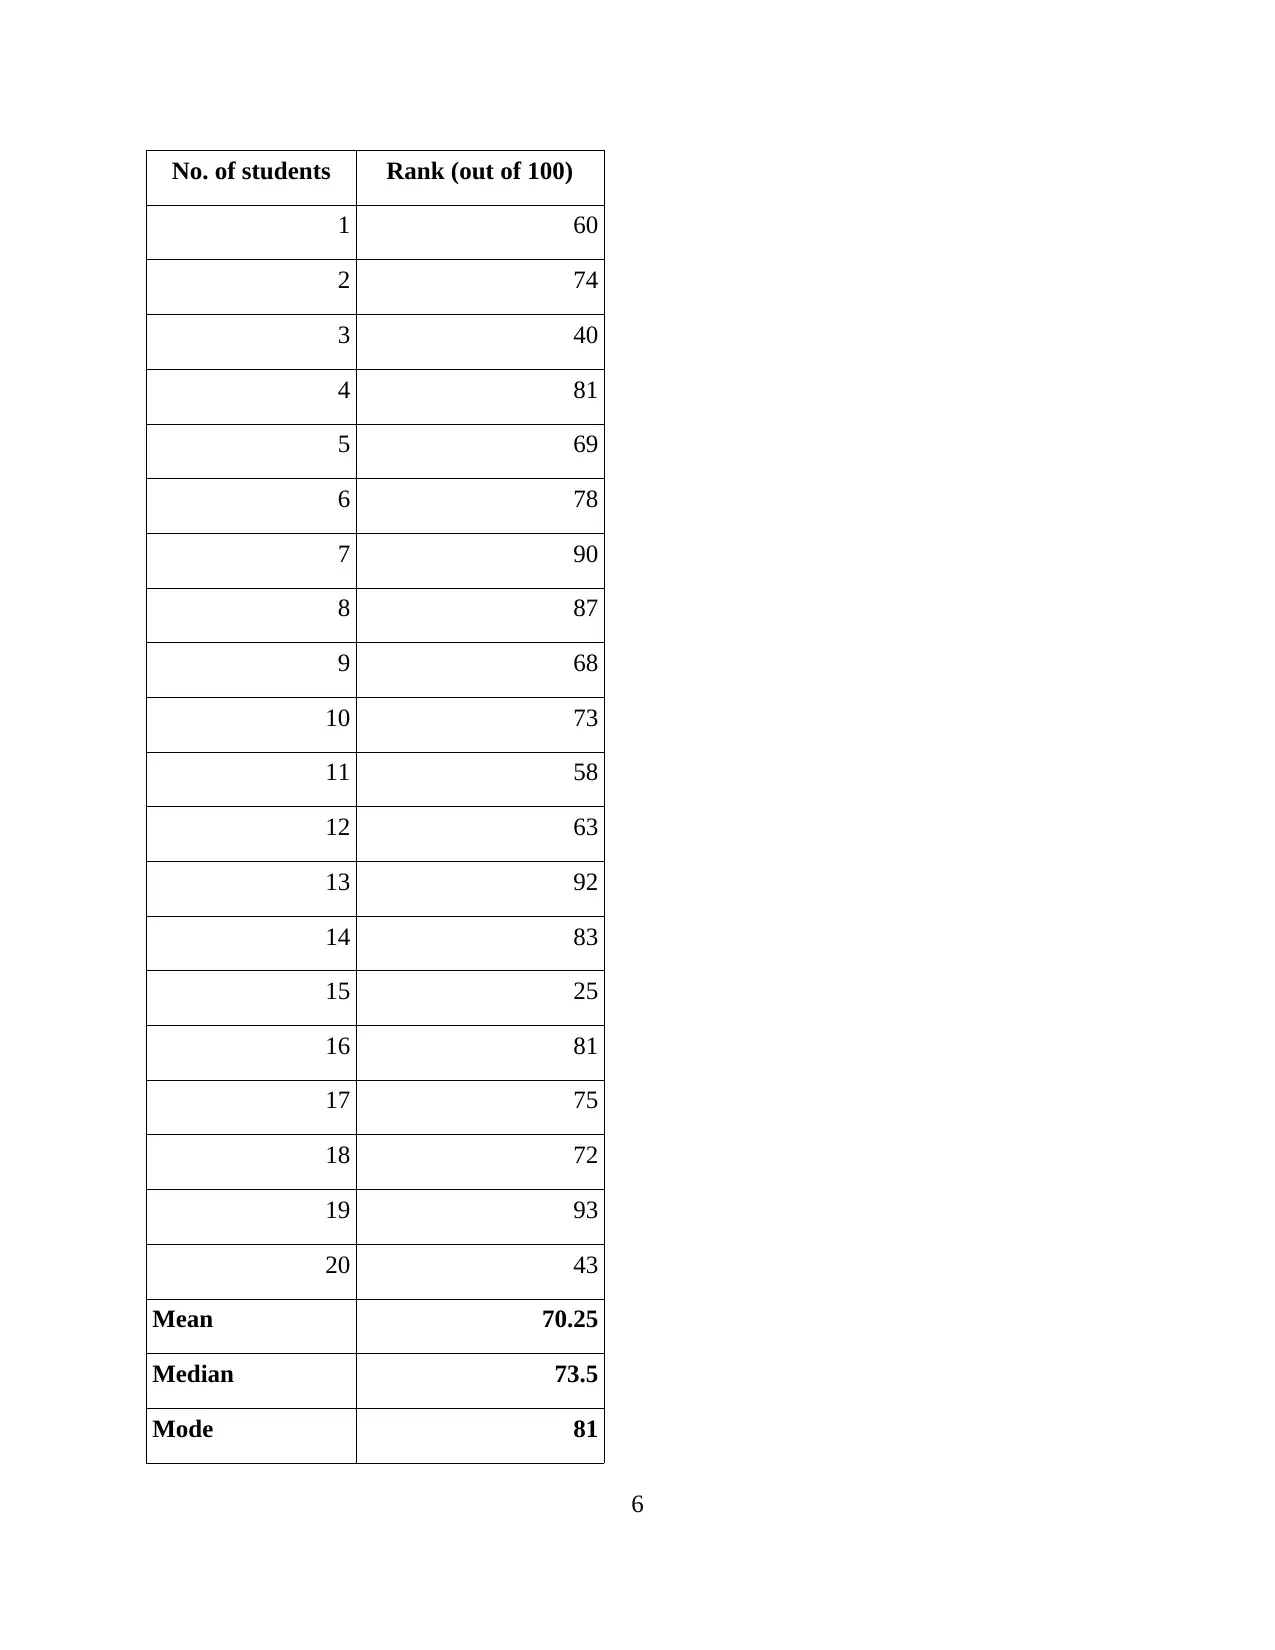
The above mentioned data are taken out from the total 20 students which are taken as a
sample size to carry out the research in effectual manner. In this, rank is given on the college
facility like teaching offered by the lecturers or tutors. Rank is given out of 100 by different 20
pupils who are studied in the UKCBC college. On the basis of data collected from such students'
analysis is done with the help of applying statistical tools and techniques. Further, explanation
and analysis of the outcome is given as below:
Interpretation and analysis Mean: The tool of statistical in which average if the overall available data set is
generated is known as mean value. It helps to the analyst in order to summarise
information and on the basis of that effective conclusion is to be drawn (Chow and
Teicher, 2012). At the present scenario, outcome of mean determined is 70.25 which is
the rank given by UKCBC's students. It can be analysed that, company gives better
teaching facility to the students and due to which rank is given at 70.25th out of 100.
Moreover, experience of the pupils along with satisfaction is also better which is sign of
having high rank. Median: On the basis of the tool like median, the overall gathered information break
down into total 2 parts which are equal. At the time of very huge and more number of
data then scholar cannot analyse them which lead to impact on analysis. In order to
resolving this respective condition, the median is the most supportive by which data
become short and summarise accurately. From the present data set of ranking it can be
assessed that, middle value is 73.5 which shows that UKCBC provides better teaching
services.
Mode: Statistical tool which shows that particular data and value which often arise in the
gathered data set is called as mode value. The mentioned technique is helpful for the
researcher of UKCBC in terms of determine frequently occur rank in the collected
information. From the higher number of huge data it is not possible to look at every value
and derive repeated (Gaile and Willmott, 2013). For reducing and making solution of this
kind of obstacles, mode tool is one of the most supportive and easy. In the current
information, 81st rank is repeated which is often given by the students on the teaching
7
Paraphrase This Document
Need a fresh take? Get an instant paraphrase of this document with our AI Paraphraser
facilities. By assessing this particular rank, it can be said that, UKCBC college provides
attractive services to its pupils in terms of teaching.
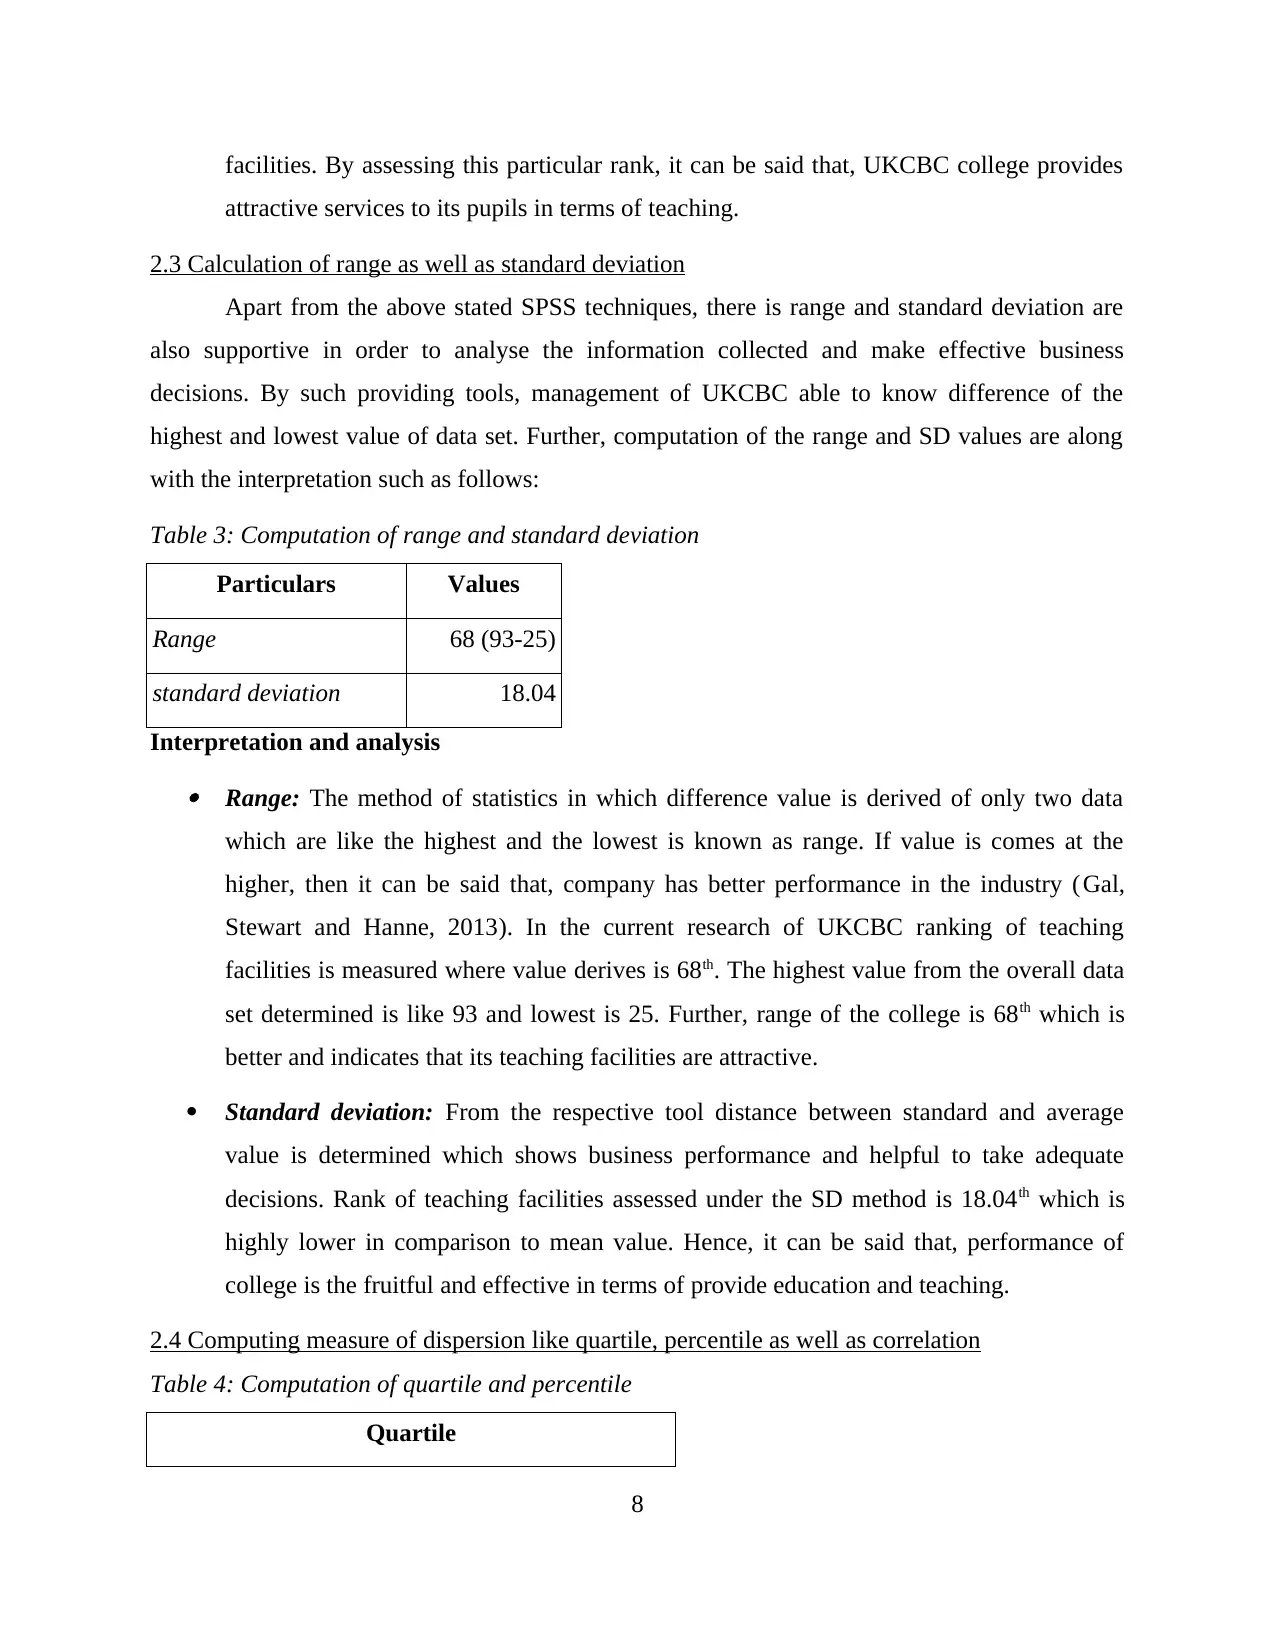
2.3 Calculation of range as well as standard deviation
Apart from the above stated SPSS techniques, there is range and standard deviation are
also supportive in order to analyse the information collected and make effective business
decisions. By such providing tools, management of UKCBC able to know difference of the
highest and lowest value of data set. Further, computation of the range and SD values are along
with the interpretation such as follows:
Table 3: Computation of range and standard deviation
Particulars Values
Range 68 (93-25)
standard deviation 18.04
Interpretation and analysis Range: The method of statistics in which difference value is derived of only two data
which are like the highest and the lowest is known as range. If value is comes at the
higher, then it can be said that, company has better performance in the industry (Gal,
Stewart and Hanne, 2013). In the current research of UKCBC ranking of teaching
facilities is measured where value derives is 68th. The highest value from the overall data
set determined is like 93 and lowest is 25. Further, range of the college is 68th which is
better and indicates that its teaching facilities are attractive.
Standard deviation: From the respective tool distance between standard and average
value is determined which shows business performance and helpful to take adequate
decisions. Rank of teaching facilities assessed under the SD method is 18.04th which is
highly lower in comparison to mean value. Hence, it can be said that, performance of
college is the fruitful and effective in terms of provide education and teaching.
2.4 Computing measure of dispersion like quartile, percentile as well as correlation
Table 4: Computation of quartile and percentile
Quartile
8
attractive services to its pupils in terms of teaching.
2.3 Calculation of range as well as standard deviation
Apart from the above stated SPSS techniques, there is range and standard deviation are
also supportive in order to analyse the information collected and make effective business
decisions. By such providing tools, management of UKCBC able to know difference of the
highest and lowest value of data set. Further, computation of the range and SD values are along
with the interpretation such as follows:
Table 3: Computation of range and standard deviation
Particulars Values
Range 68 (93-25)
standard deviation 18.04
Interpretation and analysis Range: The method of statistics in which difference value is derived of only two data
which are like the highest and the lowest is known as range. If value is comes at the
higher, then it can be said that, company has better performance in the industry (Gal,
Stewart and Hanne, 2013). In the current research of UKCBC ranking of teaching
facilities is measured where value derives is 68th. The highest value from the overall data
set determined is like 93 and lowest is 25. Further, range of the college is 68th which is
better and indicates that its teaching facilities are attractive.
Standard deviation: From the respective tool distance between standard and average
value is determined which shows business performance and helpful to take adequate
decisions. Rank of teaching facilities assessed under the SD method is 18.04th which is
highly lower in comparison to mean value. Hence, it can be said that, performance of
college is the fruitful and effective in terms of provide education and teaching.
2.4 Computing measure of dispersion like quartile, percentile as well as correlation
Table 4: Computation of quartile and percentile
Quartile
8
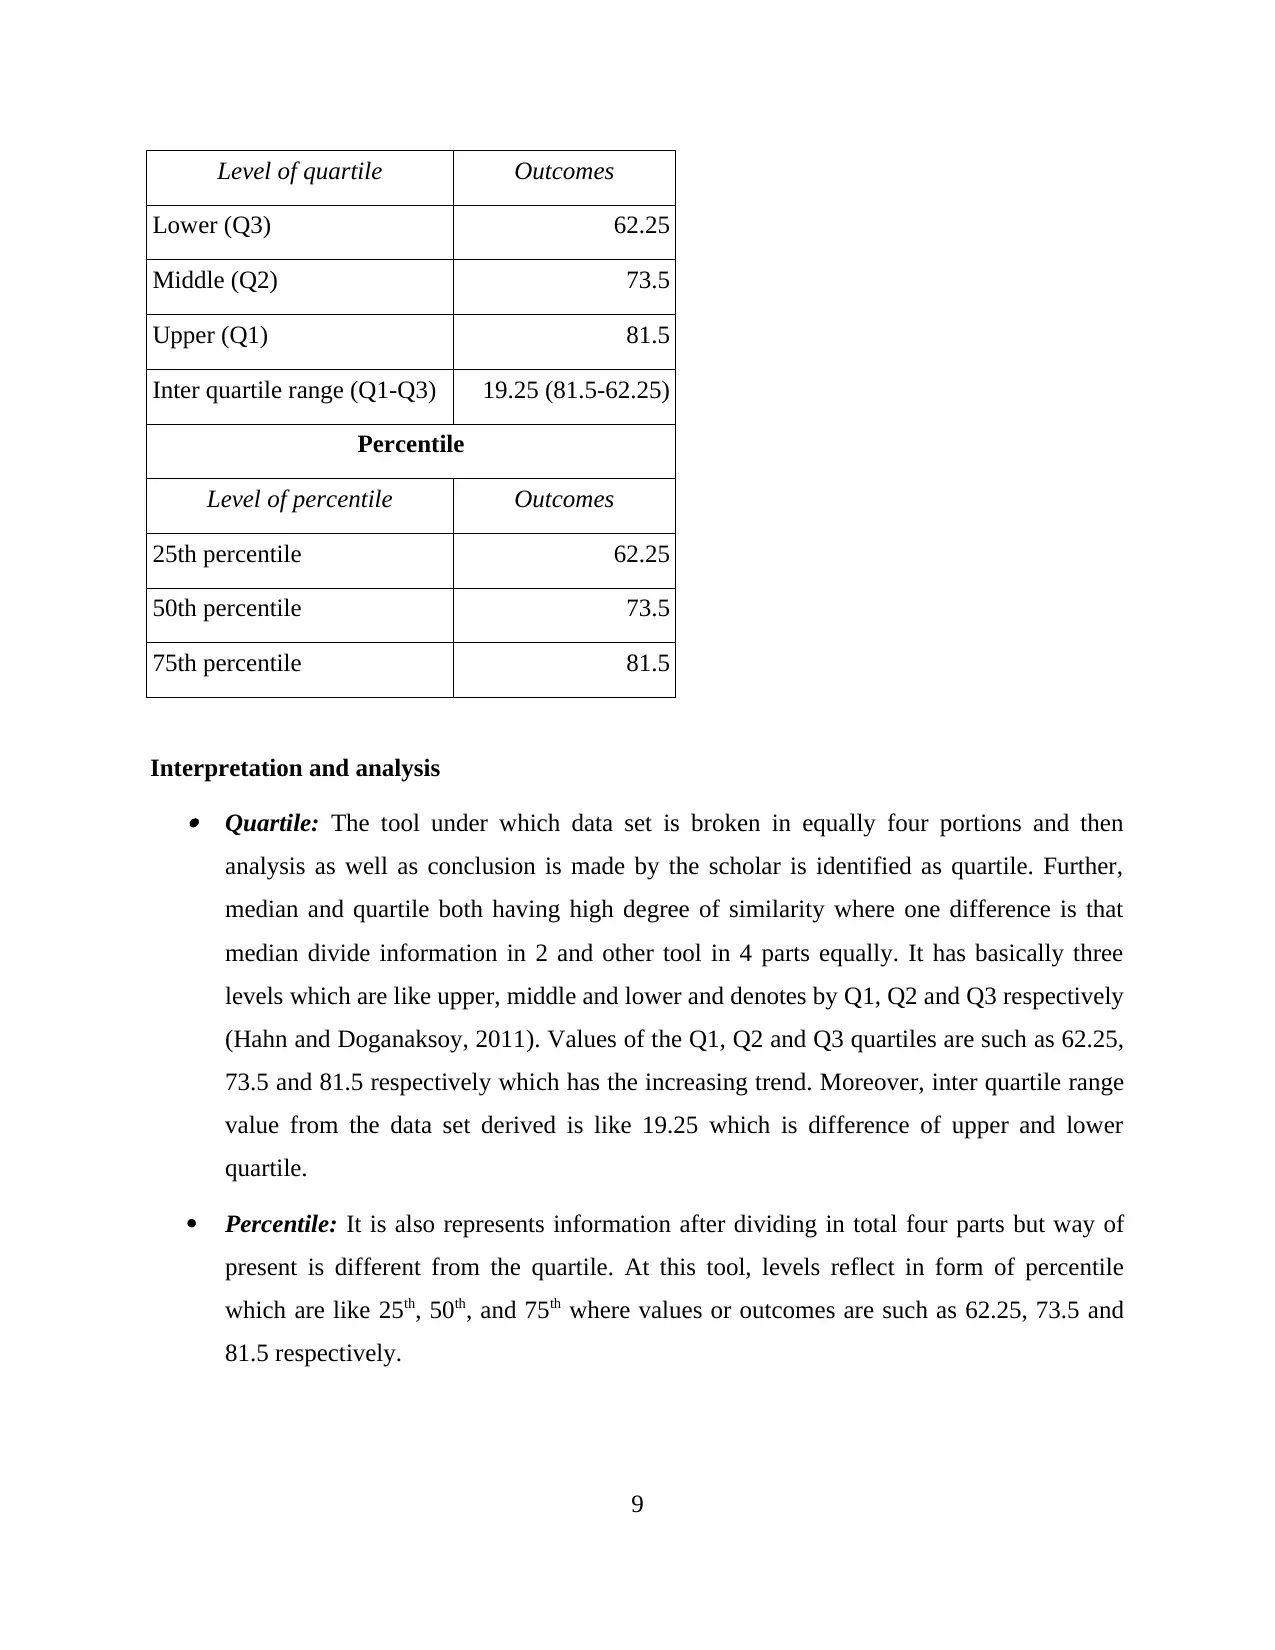
Level of quartile Outcomes
Lower (Q3) 62.25
Middle (Q2) 73.5
Upper (Q1) 81.5
Inter quartile range (Q1-Q3) 19.25 (81.5-62.25)
Percentile
Level of percentile Outcomes
25th percentile 62.25
50th percentile 73.5
75th percentile 81.5
Interpretation and analysis Quartile: The tool under which data set is broken in equally four portions and then
analysis as well as conclusion is made by the scholar is identified as quartile. Further,
median and quartile both having high degree of similarity where one difference is that
median divide information in 2 and other tool in 4 parts equally. It has basically three
levels which are like upper, middle and lower and denotes by Q1, Q2 and Q3 respectively
(Hahn and Doganaksoy, 2011). Values of the Q1, Q2 and Q3 quartiles are such as 62.25,
73.5 and 81.5 respectively which has the increasing trend. Moreover, inter quartile range
value from the data set derived is like 19.25 which is difference of upper and lower
quartile.
Percentile: It is also represents information after dividing in total four parts but way of
present is different from the quartile. At this tool, levels reflect in form of percentile
which are like 25th, 50th, and 75th where values or outcomes are such as 62.25, 73.5 and
81.5 respectively.
9
⊘ This is a preview!⊘
Do you want full access?
Subscribe today to unlock all pages.
Trusted by 1+ million students worldwide
1 out of 28
Related Documents


Your All-in-One AI-Powered Toolkit for Academic Success.
+13062052269
info@desklib.com
Available 24*7 on WhatsApp / Email
![[object Object]](/_next/static/media/star-bottom.7253800d.svg)
Unlock your academic potential
Copyright © 2020–2026 A2Z Services. All Rights Reserved. Developed and managed by ZUCOL.