Analytical Report: Student Performance Data Analysis (ICT616)

Verified

Added on  2023/06/07

|18
|2427
|390
Report
AI Summary
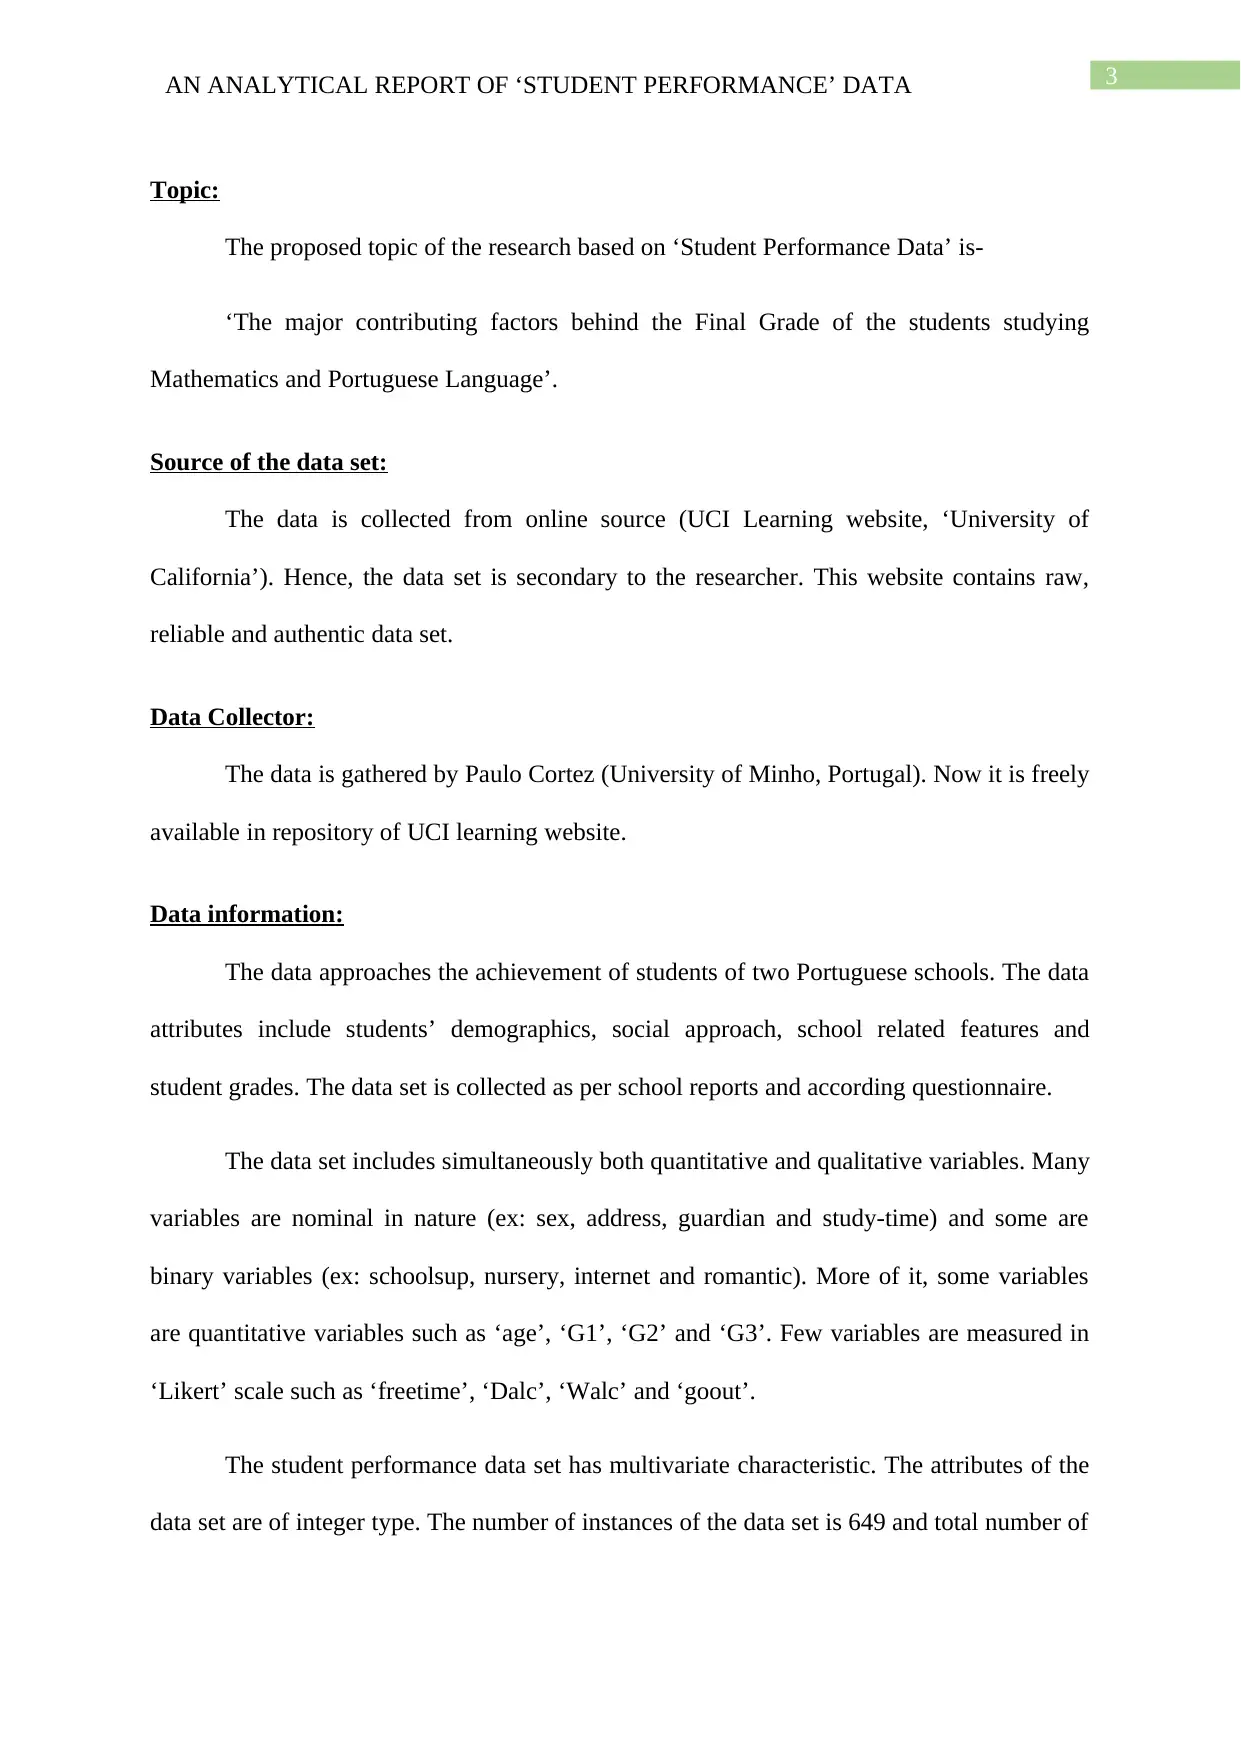
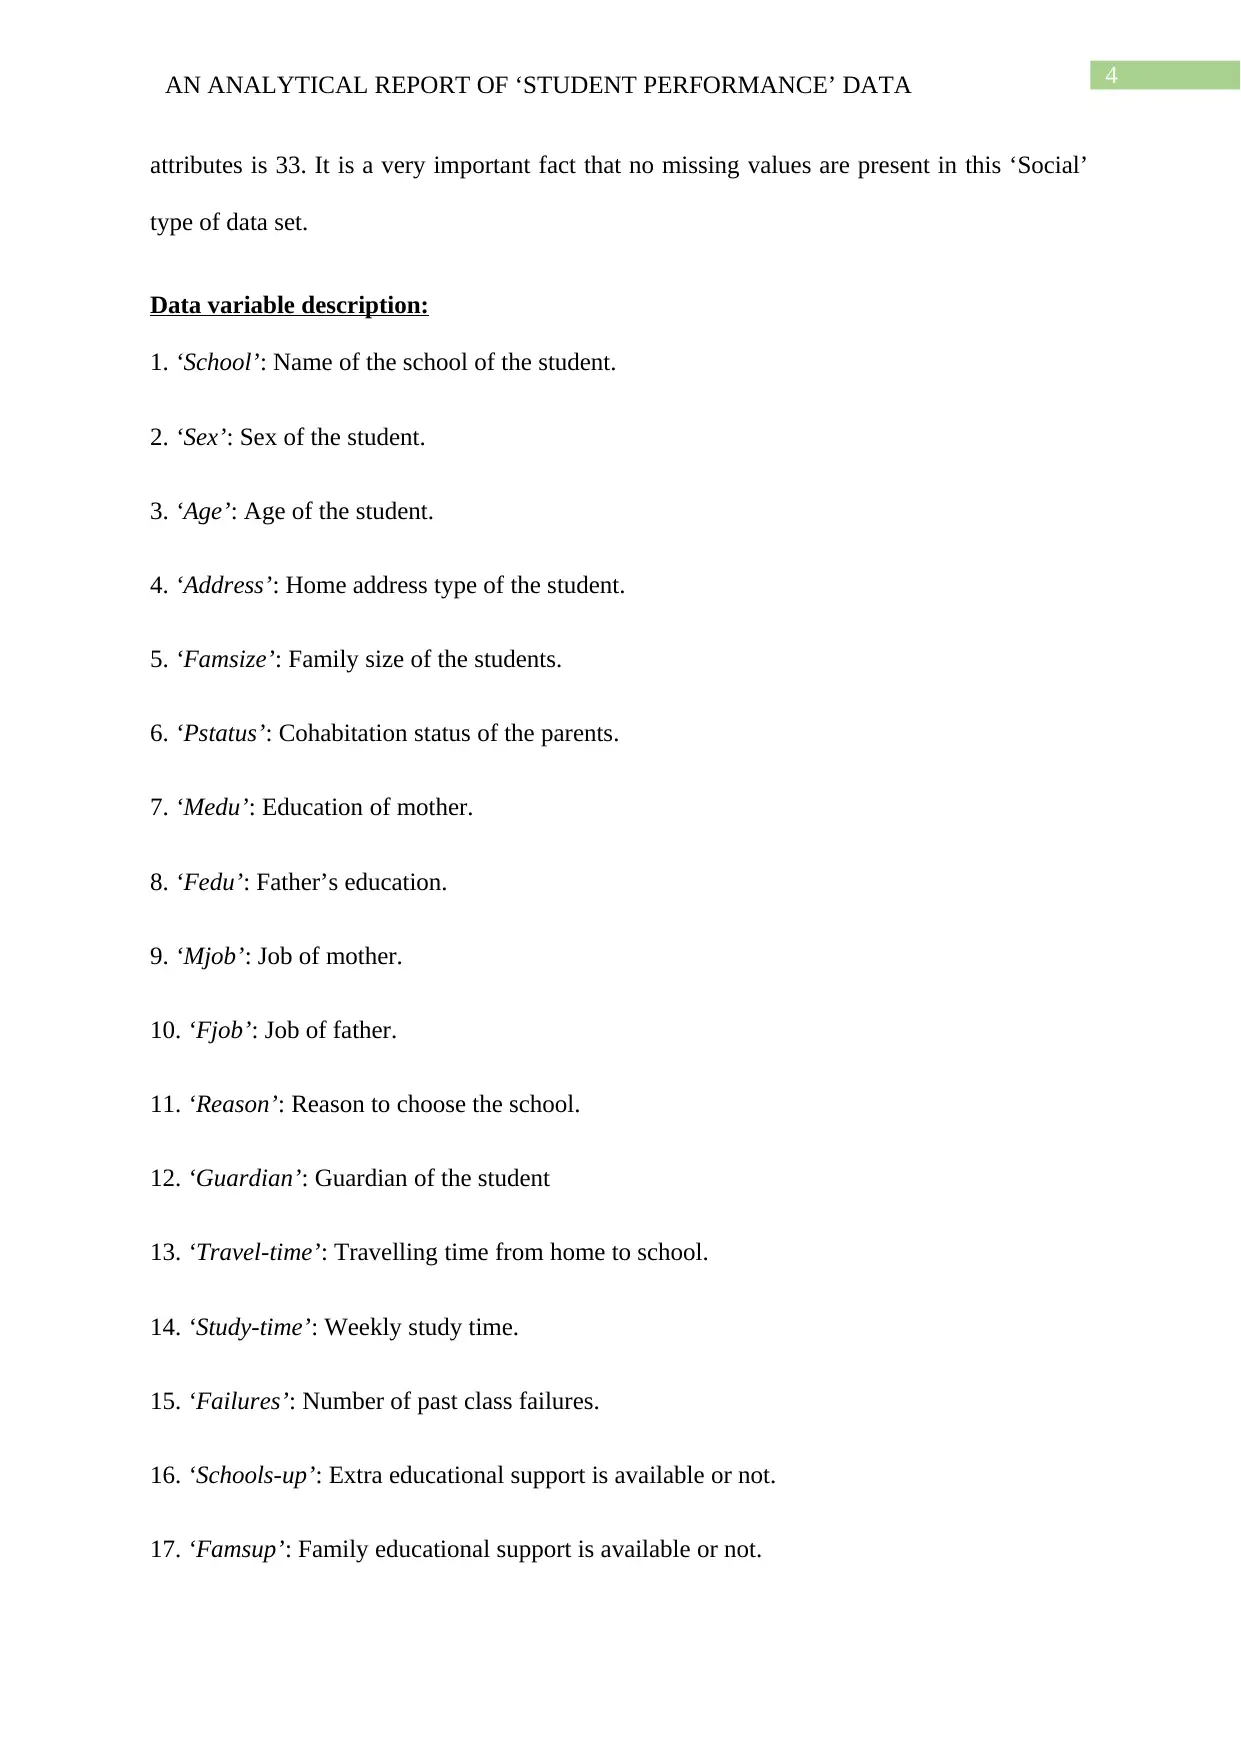
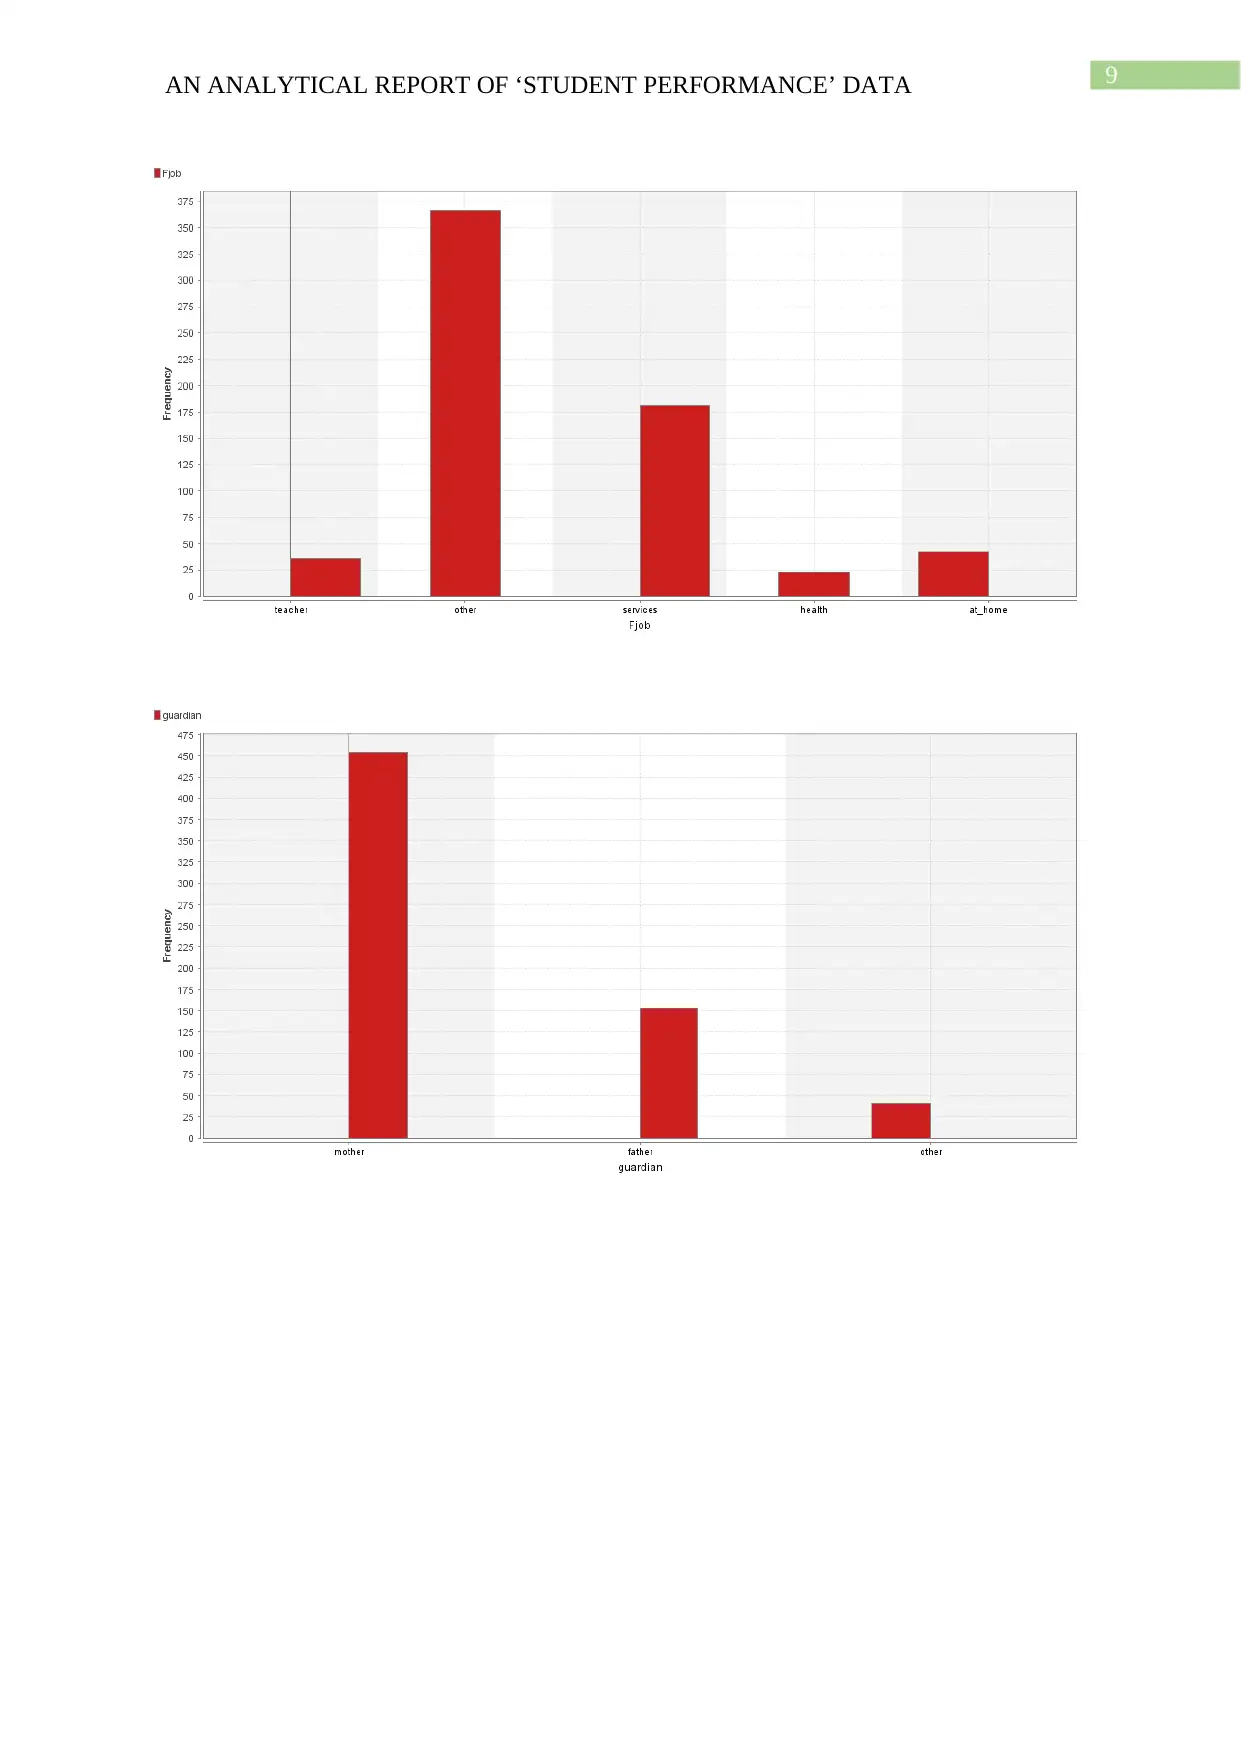
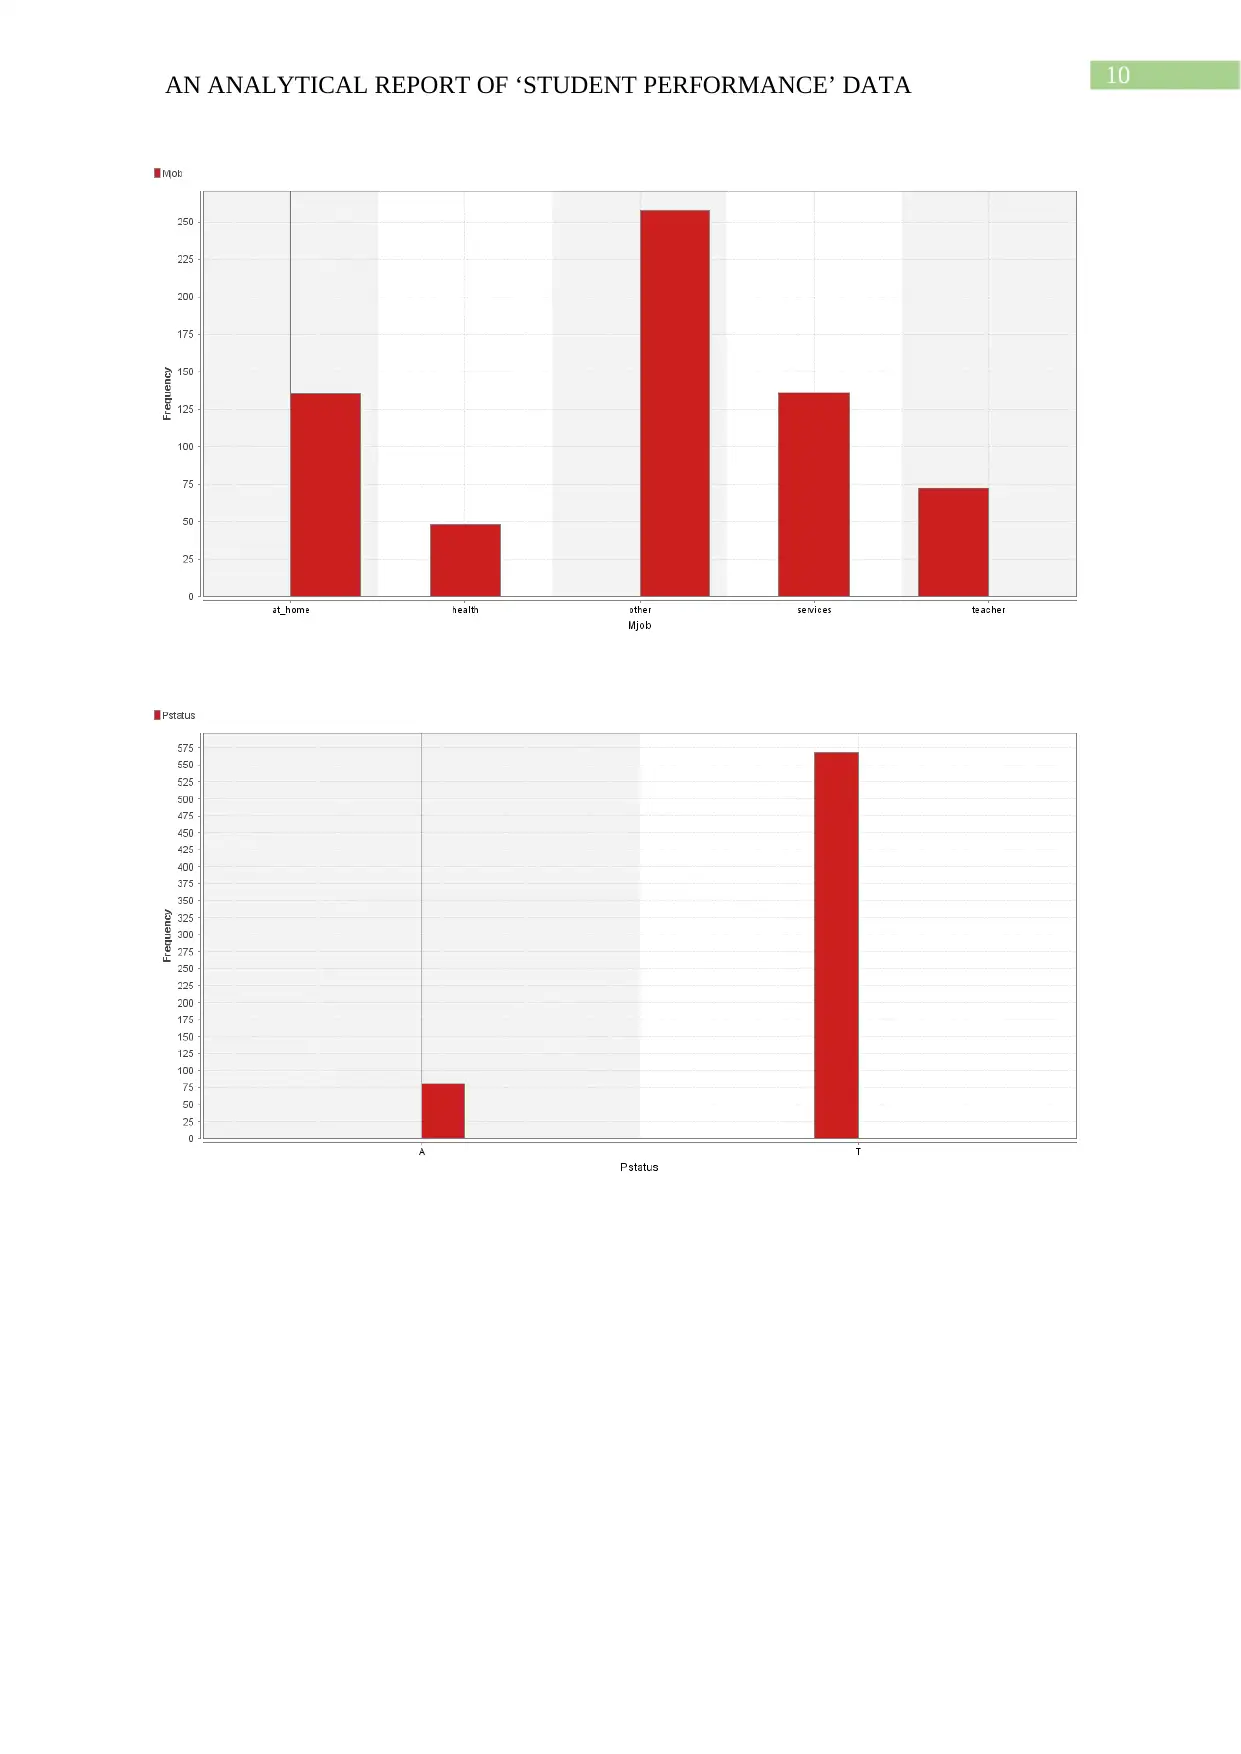
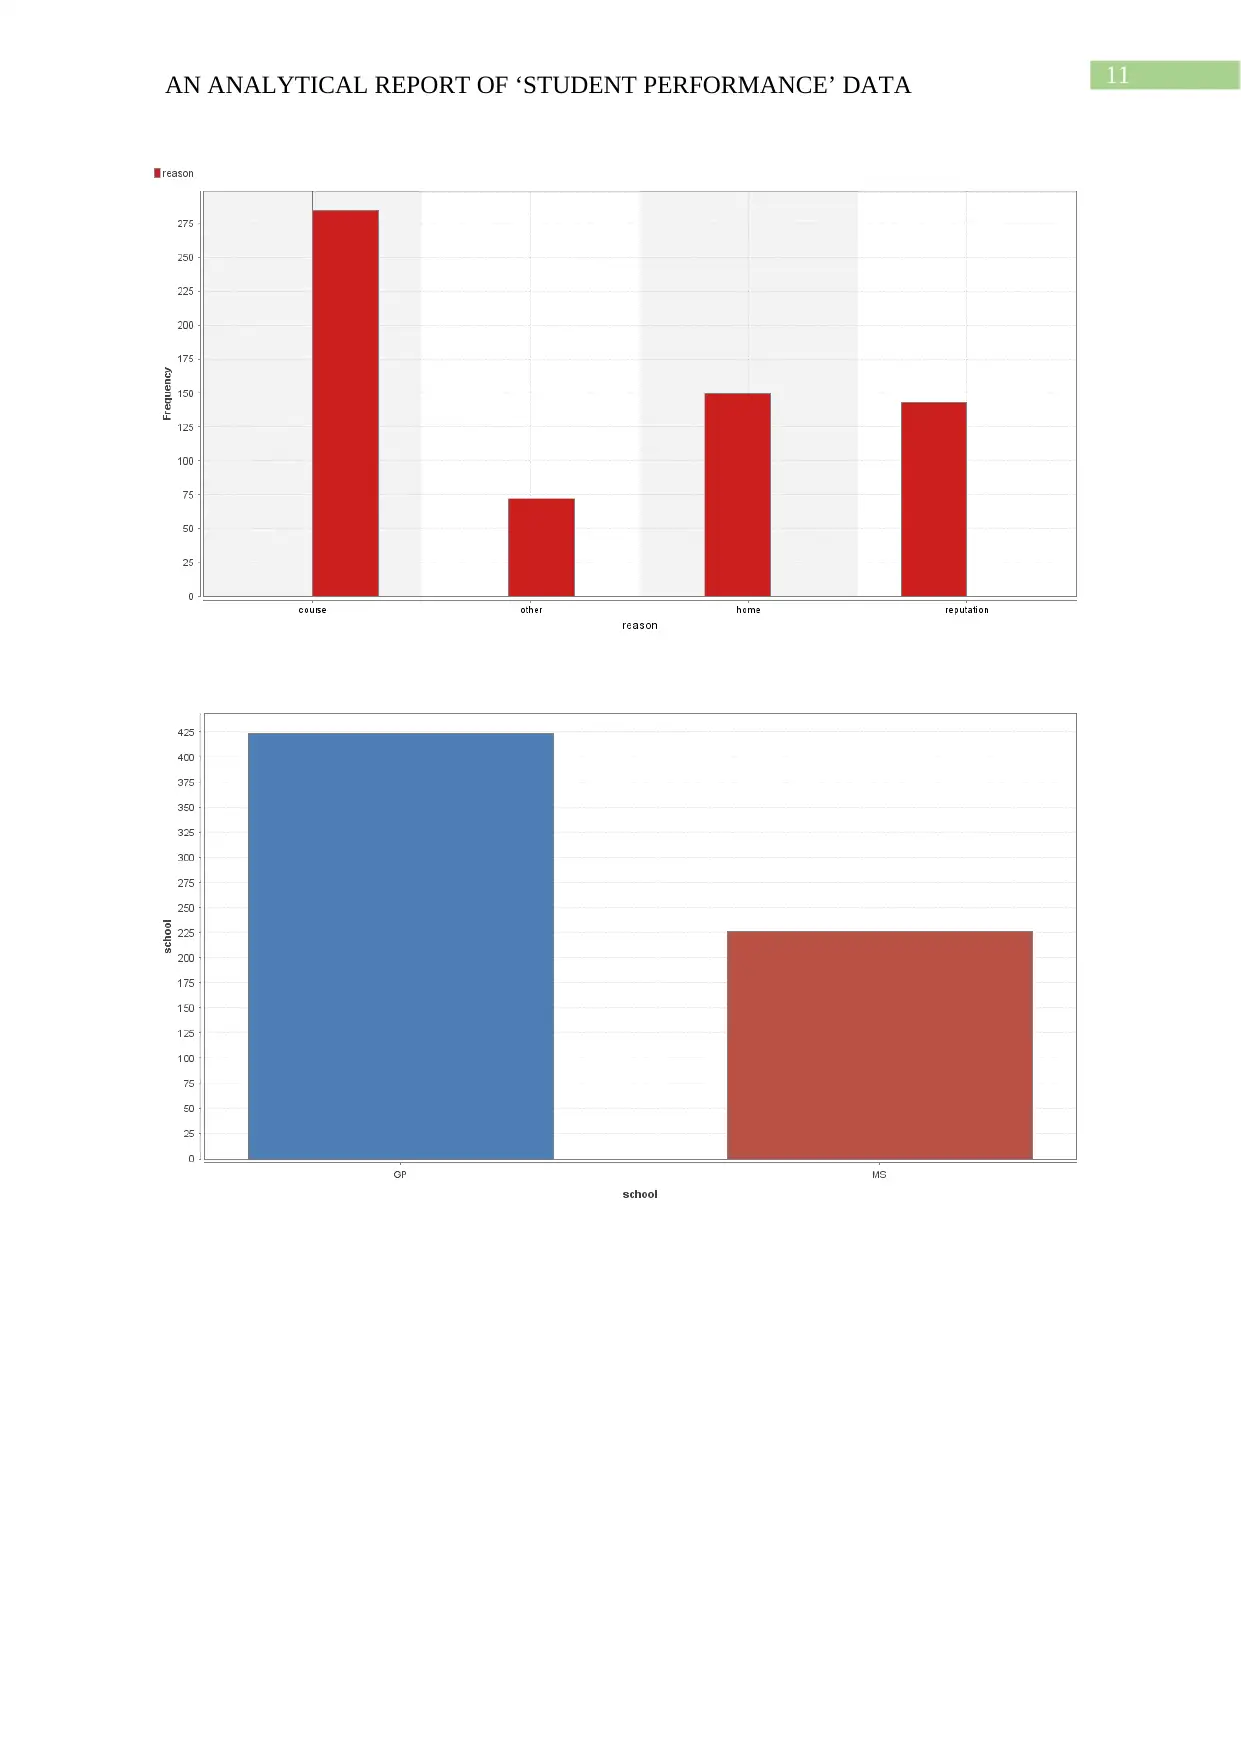
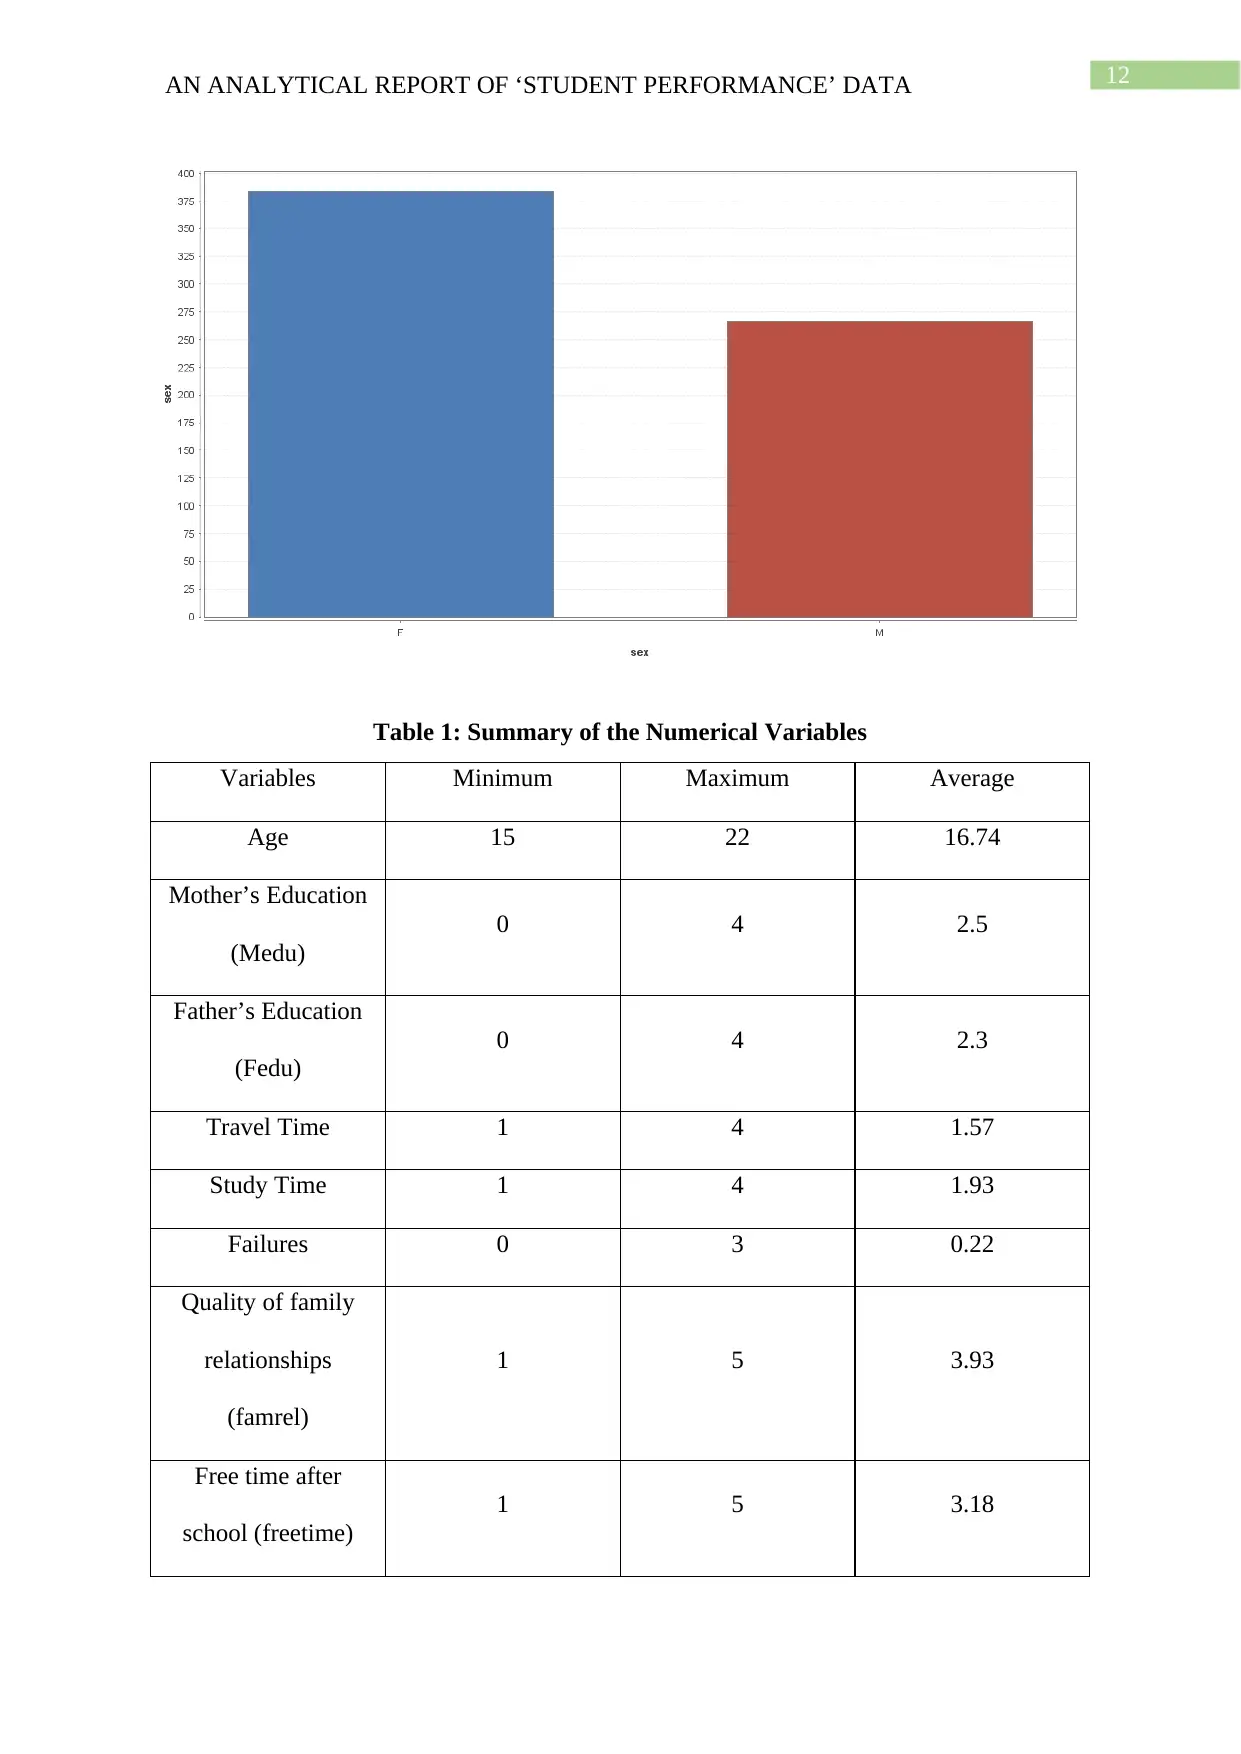
This analytical report delves into the factors influencing student performance in Mathematics and Portuguese, utilizing a dataset from the UCI Learning website. The study, conducted using RapidMiner, employs both regression and classification techniques to predict student grades (G3) based on various attributes, including demographics, social factors, and school-related features. The report examines the impact of variables like study time, failures, and parental education on first and second-period grades, subsequently assessing their influence on final grades. Separate regression models are developed for Mathematics and Portuguese, revealing key predictors for each subject. The report provides detailed descriptive analysis of the variables, including categorical summaries and numerical data tables. The findings offer valuable insights into the relationship between various factors and student academic outcomes, aiming to provide a comprehensive understanding of grade prediction and contributing factors.
tabler-icon-diamond-filled.svg

Contribute Materials

Your contribution can guide someone’s learning journey. Share your documents today.
Document Page
Running head: AN ANALYTICAL REPORT OF ‘STUDENT PERFORMANCE’ DATA
An analytical report of ‘Student Performance’ Data
Name of the University:
Name of the Student:
Course ID:
tabler-icon-diamond-filled.svg

Secure Best Marks with AI Grader

Need help grading? Try our AI Grader for instant feedback on your assignments.
Document Page
2AN ANALYTICAL REPORT OF ‘STUDENT PERFORMANCE’ DATA
Table of Contents
Topic:.........................................................................................................................................3
Source of the data set:................................................................................................................3
Data Collector:...........................................................................................................................3
Data information:.......................................................................................................................3
Data variable description:..........................................................................................................4
Research Objective:...................................................................................................................5
Research Curriculum:.................................................................................................................6
Description of Curriculum:........................................................................................................6
Required Software:.....................................................................................................................7
Opportunity of the Analysis:......................................................................................................7
Analysis and Discussions:..........................................................................................................7
References:...............................................................................................................................19
Document Page
3AN ANALYTICAL REPORT OF ‘STUDENT PERFORMANCE’ DATA
Topic:
The proposed topic of the research based on ‘Student Performance Data’ is-
‘The major contributing factors behind the Final Grade of the students studying
Mathematics and Portuguese Language’.
Source of the data set:
The data is collected from online source (UCI Learning website, ‘University of
California’). Hence, the data set is secondary to the researcher. This website contains raw,
reliable and authentic data set.
Data Collector:
The data is gathered by Paulo Cortez (University of Minho, Portugal). Now it is freely
available in repository of UCI learning website.
Data information:
The data approaches the achievement of students of two Portuguese schools. The data
attributes include students’ demographics, social approach, school related features and
student grades. The data set is collected as per school reports and according questionnaire.
The data set includes simultaneously both quantitative and qualitative variables. Many
variables are nominal in nature (ex: sex, address, guardian and study-time) and some are
binary variables (ex: schoolsup, nursery, internet and romantic). More of it, some variables
are quantitative variables such as ‘age’, ‘G1’, ‘G2’ and ‘G3’. Few variables are measured in
‘Likert’ scale such as ‘freetime’, ‘Dalc’, ‘Walc’ and ‘goout’.
The student performance data set has multivariate characteristic. The attributes of the
data set are of integer type. The number of instances of the data set is 649 and total number of
Document Page
4AN ANALYTICAL REPORT OF ‘STUDENT PERFORMANCE’ DATA
attributes is 33. It is a very important fact that no missing values are present in this ‘Social’
type of data set.
Data variable description:
1. ‘School’: Name of the school of the student.
2. ‘Sex’: Sex of the student.
3. ‘Age’: Age of the student.
4. ‘Address’: Home address type of the student.
5. ‘Famsize’: Family size of the students.
6. ‘Pstatus’: Cohabitation status of the parents.
7. ‘Medu’: Education of mother.
8. ‘Fedu’: Father’s education.
9. ‘Mjob’: Job of mother.
10. ‘Fjob’: Job of father.
11. ‘Reason’: Reason to choose the school.
12. ‘Guardian’: Guardian of the student
13. ‘Travel-time’: Travelling time from home to school.
14. ‘Study-time’: Weekly study time.
15. ‘Failures’: Number of past class failures.
16. ‘Schools-up’: Extra educational support is available or not.
17. ‘Famsup’: Family educational support is available or not.
tabler-icon-diamond-filled.svg

Secure Best Marks with AI Grader

Need help grading? Try our AI Grader for instant feedback on your assignments.
Document Page
5AN ANALYTICAL REPORT OF ‘STUDENT PERFORMANCE’ DATA
18. ‘Paid’: Extra paid classes within the course of the subject or not.
19. ‘Activities’: Extra-curricular activities of the students is present or not.
20. ‘Nursery’: Attended or not in nursery school.
21. ‘Higher’: Whether the student wants to take or not higher education.
22. ‘Internet’: Whether internet access is available or not.
23. ‘Romantic’: Whether student is in romantic relationship or not.
24. ‘Famrel’: Quality of family relationships.
25. ‘Freetime’: Free time after school.
26. ‘Goout’: Going out with friends.
27. ‘Dalc’: Workday alcohol consumption.
28. ‘Walc’: Weekend alcohol consumption.
29. ‘Health’: Current health status.
30. ‘Absenses’: Number of school absences.
Research Objective:
First of all the comparison of variables and factors are accomplished in this analysis.
Also, some common differences regarding Mathematics and Portuguese language data set
and the differences of predictors and their predictability are investigated in this analysis.
Also, the variability of models of two different data sets are investigated in this analysis.
Finally, it is notable that the target attribute is G3. We are investigating a strong association
of G3 with G1 and G2 that correspond to the 1st and 2nd period grades of the students. The
Document Page
6AN ANALYTICAL REPORT OF ‘STUDENT PERFORMANCE’ DATA
reason is that it is more difficult to predict G3 without G1 and G2. Note that, G1, G2 and G3
defines first period grade, second period grade and final grade.
Research Curriculum:
The data set provides the information regarding performance in two distinct subjects
that are: Mathematics (MAT) and Portuguese language (Por). The data sets mainly
incorporate regression and classification analysis. The classification could be binary or five-
level classification. On the other hand, regression analysis could be multiple regression or
logistic regression. It undertakes the strength of main or interaction effects of predictor
variables. The effects could be linear or non-linear.
Description of Curriculum:
It is known to all that, ‘Classification’ is used to predict a label and ‘Regression’ is
used to predict a quantity. The predictive modelling is about mapping a function from inputs
to outputs. ‘Classification’ and ‘Regression’ simultaneously estimate the predictive
modelling. The assigned multiple cases are the causes of multi-label classification problem. A
classification could classify binary and two-class discrete and real-valued input variables. The
classification accuracy is essential for a classification predictive model (Vijiyarani & Sudha,
2013). The classification algorithm might predict a continuous value; however, the
continuous value is in the form of a probability for a class label. Both binary and multiclass
classification could be possible with the data set. A regression model can have real valued or
discrete input variables that needs the prediction of a quantity. The regression algorithm
might predict a discrete value in the form of an integer quantity.
While dealing with Machine learning problem, a classification or regression model
can analyse the target variable (Y) with respect to the input predictor variable (X). Both
operations can be further grouped into Regression and Classification problems that can
Document Page
7AN ANALYTICAL REPORT OF ‘STUDENT PERFORMANCE’ DATA
predict the value of the dependent attribute from predictive factors (Breiman, 2017). The
only difference is that these two dependent attribute is numerical for regression and
categorical for classification. The target variable determines which type of decision tree
(Regression tree or Classification tree) is needed. The nominal variables would be used for
classification model; the ordinal and numerical variables are used for regression tree (Naik &
Samant, 2016).
Required Software:
The machine learning software ‘RapidMiner’ would be utilized to analyse the data
sets and variables. The regression and classification models would be easily executed with
this software (Goyal, 2014).
Opportunity of the Analysis:
The data modelling and fitting of the analysis with the help of regression or
classification trees would make the research report fruitful. The analytical and model-based
report would be helpful for non-profit organisations and other researchers. The other concepts
and ideas about advanced model could be originated from the research report.
Analysis and Discussions:
In order to do the analysis, at first descriptive analysis of the variables involved in the
study has been conducted. Among the 33 variables that are involved in the dataset, there are
several variables that are categorical and several variables that are numerical. The task is
mostly aimed at conducting a prediction model. Thus, regression analysis has been used for
the development of the prediction model. Before that, a descriptive summary of each of the
variables has been conducted. The summary of the categorical variables has been presented
with the help of bar graphs, illustrated in the following figures. On the other hand, the
summary of the numerical variables is tabulated in table 1.
tabler-icon-diamond-filled.svg

Paraphrase This Document

Need a fresh take? Get an instant paraphrase of this document with our AI Paraphraser
Document Page
8AN ANALYTICAL REPORT OF ‘STUDENT PERFORMANCE’ DATA
Document Page
9AN ANALYTICAL REPORT OF ‘STUDENT PERFORMANCE’ DATA
Document Page
10AN ANALYTICAL REPORT OF ‘STUDENT PERFORMANCE’ DATA
tabler-icon-diamond-filled.svg

Secure Best Marks with AI Grader

Need help grading? Try our AI Grader for instant feedback on your assignments.
Document Page
11AN ANALYTICAL REPORT OF ‘STUDENT PERFORMANCE’ DATA
Document Page
12AN ANALYTICAL REPORT OF ‘STUDENT PERFORMANCE’ DATA
Table 1: Summary of the Numerical Variables
Variables Minimum Maximum Average
Age 15 22 16.74
Mother’s Education
(Medu)
0 4 2.5
Father’s Education
(Fedu)
0 4 2.3
Travel Time 1 4 1.57
Study Time 1 4 1.93
Failures 0 3 0.22
Quality of family
relationships
(famrel)
1 5 3.93
Free time after
school (freetime)
1 5 3.18
Document Page
13AN ANALYTICAL REPORT OF ‘STUDENT PERFORMANCE’ DATA
Going out with
friends (Goout)
1 5 3.19
Workday alcohol
consumption (Dalc)
1 5 1.5
Weekend alcohol
consumption (Walc)
1 5 2.28
Health 1 5 3.56
absences 0 32 3.66
G1 0 19 11.399
G2 0 19 11.57
G3 0 19 11.91
Now, all the numerical variables are considered to evaluate the impact of the variables
on the grades of the students. The grades of the students are obtained for two subjects, Maths
and Portuguese. The impact of all the variables on the first period and the second period
grade has been obtained at first and then the impact of the first period and the second period
grade on the final grades has been evaluated for both the subjects separately.
For the prediction of the first periods grades in mathematics, the numerical variables
that has been obtained significant in predicting the grades are Mother’s Education, Study
Time, Failures and Workday alcohol consumption. The impact of all the other numerical
variables are thus insignificant. The prediction model is given by the following regression
equation:
First Period Grade=11.97+0.32 × Medu0.08 × age+0.16 × Fedu0.212 ×traveltime+0.567 × studytime1
tabler-icon-diamond-filled.svg

Paraphrase This Document

Need a fresh take? Get an instant paraphrase of this document with our AI Paraphraser
Document Page
14AN ANALYTICAL REPORT OF ‘STUDENT PERFORMANCE’ DATA
For the prediction of the second period grades in mathematics, the numerical variables
that has been obtained significant in predicting the grades are Mother’s Education, Study
Time and Failures. Workday alcohol consumption has not been obtained as significant for
this model. The impact of all the other numerical variables are thus insignificant. The
prediction model is given by the following regression equation:
Second Period Grade=9.09+0.34 × Medu+0.103 ×age +0.21 × Fedu0.22 ×traveltime+ 0.51× studytime1
Document Page
15AN ANALYTICAL REPORT OF ‘STUDENT PERFORMANCE’ DATA
Further, both the first period and the second period grades are significant in predicting
the final grades in mathematics. The prediction equation is given as follows:
FinalGrade=0.15 × First Period Grade+0.897 × Second Period Grade
For the prediction of the first periods grades in Portuguese, the numerical variables
that has been obtained significant in predicting the grades are Study Time, Failures and goout
The impact of all the other numerical variables are thus insignificant. The prediction model is
given by the following regression equation:
First Period Grade=7.74+ 0.293× Medu+0.145 × age+0.22 × Fedu0.115× traveltime+0.398 × studytime
Document Page
16AN ANALYTICAL REPORT OF ‘STUDENT PERFORMANCE’ DATA
For the prediction of the second period grades in Portuguese, the numerical variables
that has been obtained significant in predicting the grades are Mother’s Education, Travel
Time, goout and Failures. The impact of all the other numerical variables are thus
insignificant. The prediction model is given by the following regression equation:
Second Period Grade=13.32+ 0.44 × Medu0.1 ×age +0.02× Fedu0.52 ×traveltime+ 0.35× studytime1.4
tabler-icon-diamond-filled.svg

Secure Best Marks with AI Grader

Need help grading? Try our AI Grader for instant feedback on your assignments.
Document Page
17AN ANALYTICAL REPORT OF ‘STUDENT PERFORMANCE’ DATA
Further, both the first period and the second period grades are significant in predicting
the final grades in Portuguese. The prediction equation is given as follows:
FinalGrade=0.15 × First Period Grade+0.987 × Second Period Gr ade
Document Page
18AN ANALYTICAL REPORT OF ‘STUDENT PERFORMANCE’ DATA
References:
Breiman, L., 2017. Classification and regression trees. Routledge.
Goyal, V. K. (2014). A Comparative Study of Classification Methods in Data Mining using
RapidMiner Studio. IJIRSE) International Journal of Innovative Research in Science
& Engineering.
Naik, A., & Samant, L. (2016). Correlation review of classification algorithm using data
mining tool: WEKA, Rapidminer, Tanagra, Orange and Knime. Procedia Computer
Science, 85, 662-668.
Vijiyarani, S., & Sudha, S. (2013). An efficient classification tree technique for heart disease
prediction. In International Conference on Research Trends in Computer
Technologies (ICRTCT-2013) Proceedings published in International Journal of
Computer Applications (IJCA)(0975–8887) (Vol. 201).
chevron_up_icon
1 out of 18
circle_padding
hide_on_mobile
zoom_out_icon
logo.png

Your All-in-One AI-Powered Toolkit for Academic Success.

Available 24*7 on WhatsApp / Email

[object Object]