MGT602: Business Decision Analytics Report on Student Outcomes
VerifiedAdded on 2022/09/26
|22
|2971
|19
Report
AI Summary
This report analyzes the factors influencing the placement and job satisfaction of business students at Torrens University. The study employs statistical tools like MS Excel, IBM SPSS, and Minitab to analyze primary data collected from 119 students. The research addresses questions regarding significant factors for placement, job satisfaction levels, and differences in satisfaction based on marital status. Backward elimination regression is used to determine key placement and job satisfaction factors, revealing that job satisfaction significantly impacts placement status. ANOVA is performed to compare job satisfaction across different marital statuses. The findings highlight the importance of job satisfaction and provide a detailed analysis of factors affecting student outcomes in the business domain. The report includes regression outputs, model summaries, and coefficient tables, offering a comprehensive understanding of the influential factors.
Running head: Business Decision Analytics
BUSINESS DECISION ANALYTICS
Name of the Student
Name of the University
Author Note
BUSINESS DECISION ANALYTICS
Name of the Student
Name of the University
Author Note
Paraphrase This Document
Need a fresh take? Get an instant paraphrase of this document with our AI Paraphraser
1Business Decision Analytics
Executive summary:
Torrens University is one of many private university in Australia. The university is
under the network of Laureate International Universities which have campuses across
Brisbane, Melbourne and Adelaide. This university is the 40th university in Australia
established after commissioning and this is known as the first new university in 20 recent
years. The university offers diversified courses in different subjects like English, Business,
Design, Hospitality, Sports management, nursing, technology and many post graduate
courses in the same domain. In this research the different views of the university student
going through business related courses are collected to find the influential factors about the
placement of the students and their job satisfaction levels.
2Business Decision Analytics
Table of Contents
Introduction:...............................................................................................................................3
Problem:.....................................................................................................................................3
Research question:.....................................................................................................................3
Data management framework:...................................................................................................4
Methods:.....................................................................................................................................5
Results and discussion:..............................................................................................................6
Recommendation:....................................................................................................................15
Conclusion:..............................................................................................................................16
Reference list:...........................................................................................................................17
Appendix:.................................................................................................................................18
⊘ This is a preview!⊘
Do you want full access?
Subscribe today to unlock all pages.
Trusted by 1+ million students worldwide
3Business Decision Analytics
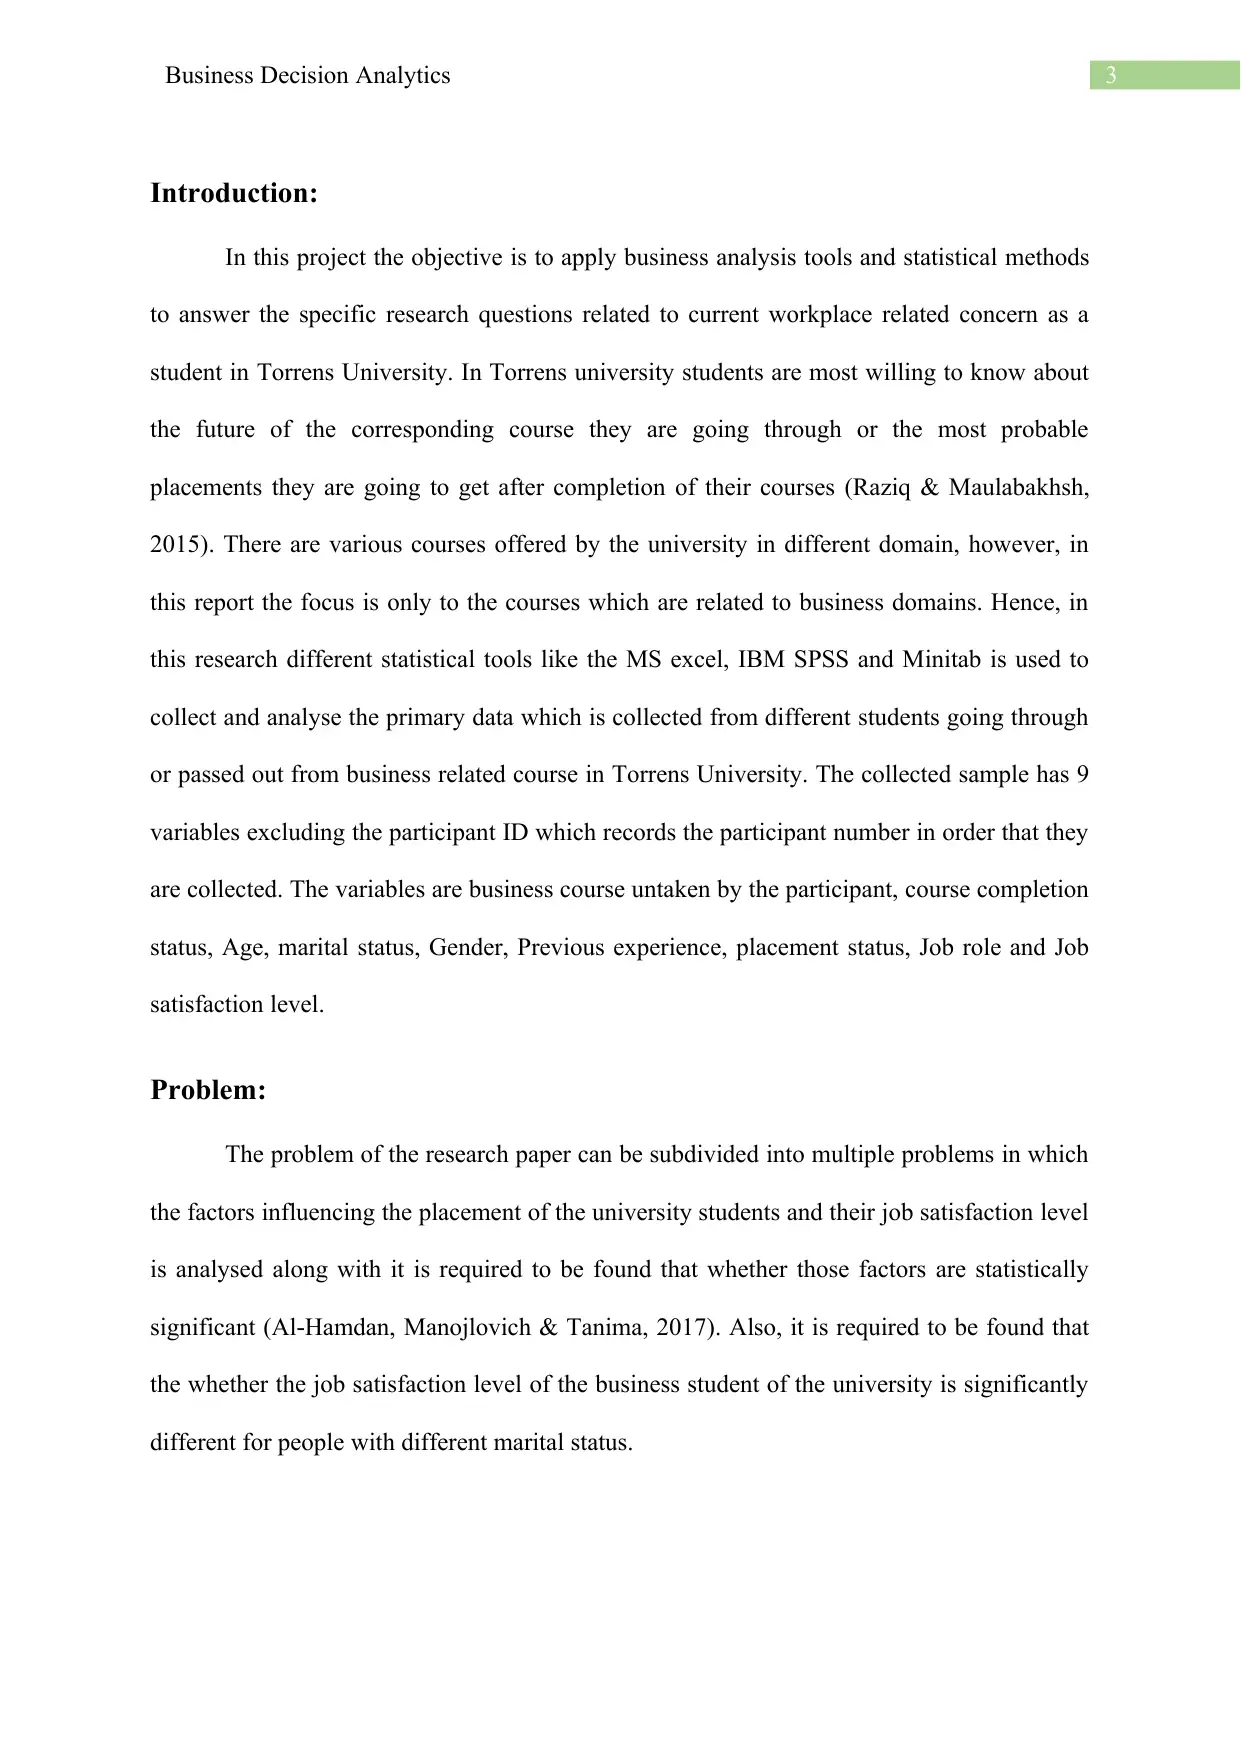
Introduction:
In this project the objective is to apply business analysis tools and statistical methods
to answer the specific research questions related to current workplace related concern as a
student in Torrens University. In Torrens university students are most willing to know about
the future of the corresponding course they are going through or the most probable
placements they are going to get after completion of their courses (Raziq & Maulabakhsh,
2015). There are various courses offered by the university in different domain, however, in
this report the focus is only to the courses which are related to business domains. Hence, in
this research different statistical tools like the MS excel, IBM SPSS and Minitab is used to
collect and analyse the primary data which is collected from different students going through
or passed out from business related course in Torrens University. The collected sample has 9
variables excluding the participant ID which records the participant number in order that they
are collected. The variables are business course untaken by the participant, course completion
status, Age, marital status, Gender, Previous experience, placement status, Job role and Job
satisfaction level.
Problem:
The problem of the research paper can be subdivided into multiple problems in which
the factors influencing the placement of the university students and their job satisfaction level
is analysed along with it is required to be found that whether those factors are statistically
significant (Al Hamdan, Manojlovich & Tanima, 2017). Also, it is required to be found that‐
the whether the job satisfaction level of the business student of the university is significantly
different for people with different marital status.
Paraphrase This Document
Need a fresh take? Get an instant paraphrase of this document with our AI Paraphraser

4Business Decision Analytics
Research question:
The research questions in this research are the following.
R1: What are the significant factors influencing the placement status of the business students
in Torrens University?
R2: What are the significant factors influencing the job satisfaction level of the business
students in Torrens University?
R3: Whether the job satisfaction level of the business student of the university is significantly
different for people who are married, unmarried and divorced?
Data management framework:
The primary data is collected from the students of Torrens University going through
different business courses. A total of 200 business students in the Torrens University were
approached for short interview to collect information and out of 200 student 119 students
have availed the interview and thus sample size of the data is 119. The different questions
that are asked to the 119 participants are about their gender, age, experience, business course
undertaken, marital status, course completion status, placement status, job satisfaction level
and their current job role. Though many sub-courses in business are obtained from the
participant that are taught in the Torrens University, all courses have been classified in main
braches which are Bachelor of Business, Master of Business Information System, Graduate
Diploma of Business Information system, Diploma of Marketing, Master of Professional
Accounting, Diploma of Business Information System, Master of Business Administration,
Bachelor of Commerce, Doctor of Business Leadership, Diploma of Event Management
respectively. All the data is gathered in an excel sheet with participant ID in the interviewing
order and their corresponding responses under respective variable heads as mentioned before.
The course students are selected on a random basis scattered through different region in the
5Business Decision Analytics
country and hence sampling method is simple random sampling. After gathering the data the
dual responses i.e. the response with more than one options are modified using suitable excel
formulas on the basis of the overall interview of that particular participant. Also, the missing
and error responses are filled using appropriate methods in excel and then loaded into SPSS
for analysis. In SPSS before applying any statistical methods the string type responses are
recoded into numeric by lowest to highest order method. The suitable techniques of
regression and ANOVA is then performed in SPSS with suitable variables as shown in the
later section. The different visualizations and descriptive statistics are obtained in Minitab
software as given below.
Methods:
Now, the first and the second research question is answered by using backward
elimination regression technique in SPSS. The placement status numeric variable is taken
dependent and all the others variables except the participant ID are taken as predictors in the
backward elimination regression where the not significant variables are removed in each step
and finally the iteration ends when the p value of all the predictors are less than 0.01 which is
considered as the significance level for the test (Vu, Muttaqi & Agalgaonkar, 2015).
Similarly, for second research question the job satisfaction level is considered as dependent
and all the other variables except participant ID are taken as predictors to dependent variable
and the same method followed. The variable present in the last iteration in both case is
considered significant factors. Now, for answering the third research question the one way
analysis of variance is performed where the job satisfaction converted to numeric scale is
taken as dependent and the marital status is taken as it factor (Mood & Morrow Jr, 2017).
Null hypothesis for R1: The numeric factor job satisfaction level is not significant for
placement status.
⊘ This is a preview!⊘
Do you want full access?
Subscribe today to unlock all pages.
Trusted by 1+ million students worldwide
6Business Decision Analytics
Alternative hypothesis for R1: The numeric factor job satisfaction level is significant for
placement status.
Null hypothesis for R2: The numeric factor placement status is not significant for job
satisfaction level.
Alternative hypothesis for R2: The numeric factor placement status is significant for job
satisfaction level.
Null hypothesis for R3: Average job satisfaction level of the business student are same for
persons with different marital status in the University.
Alternative hypothesis for R3: Average job satisfaction level of the business student are
significantly different for persons with different marital status in the University.
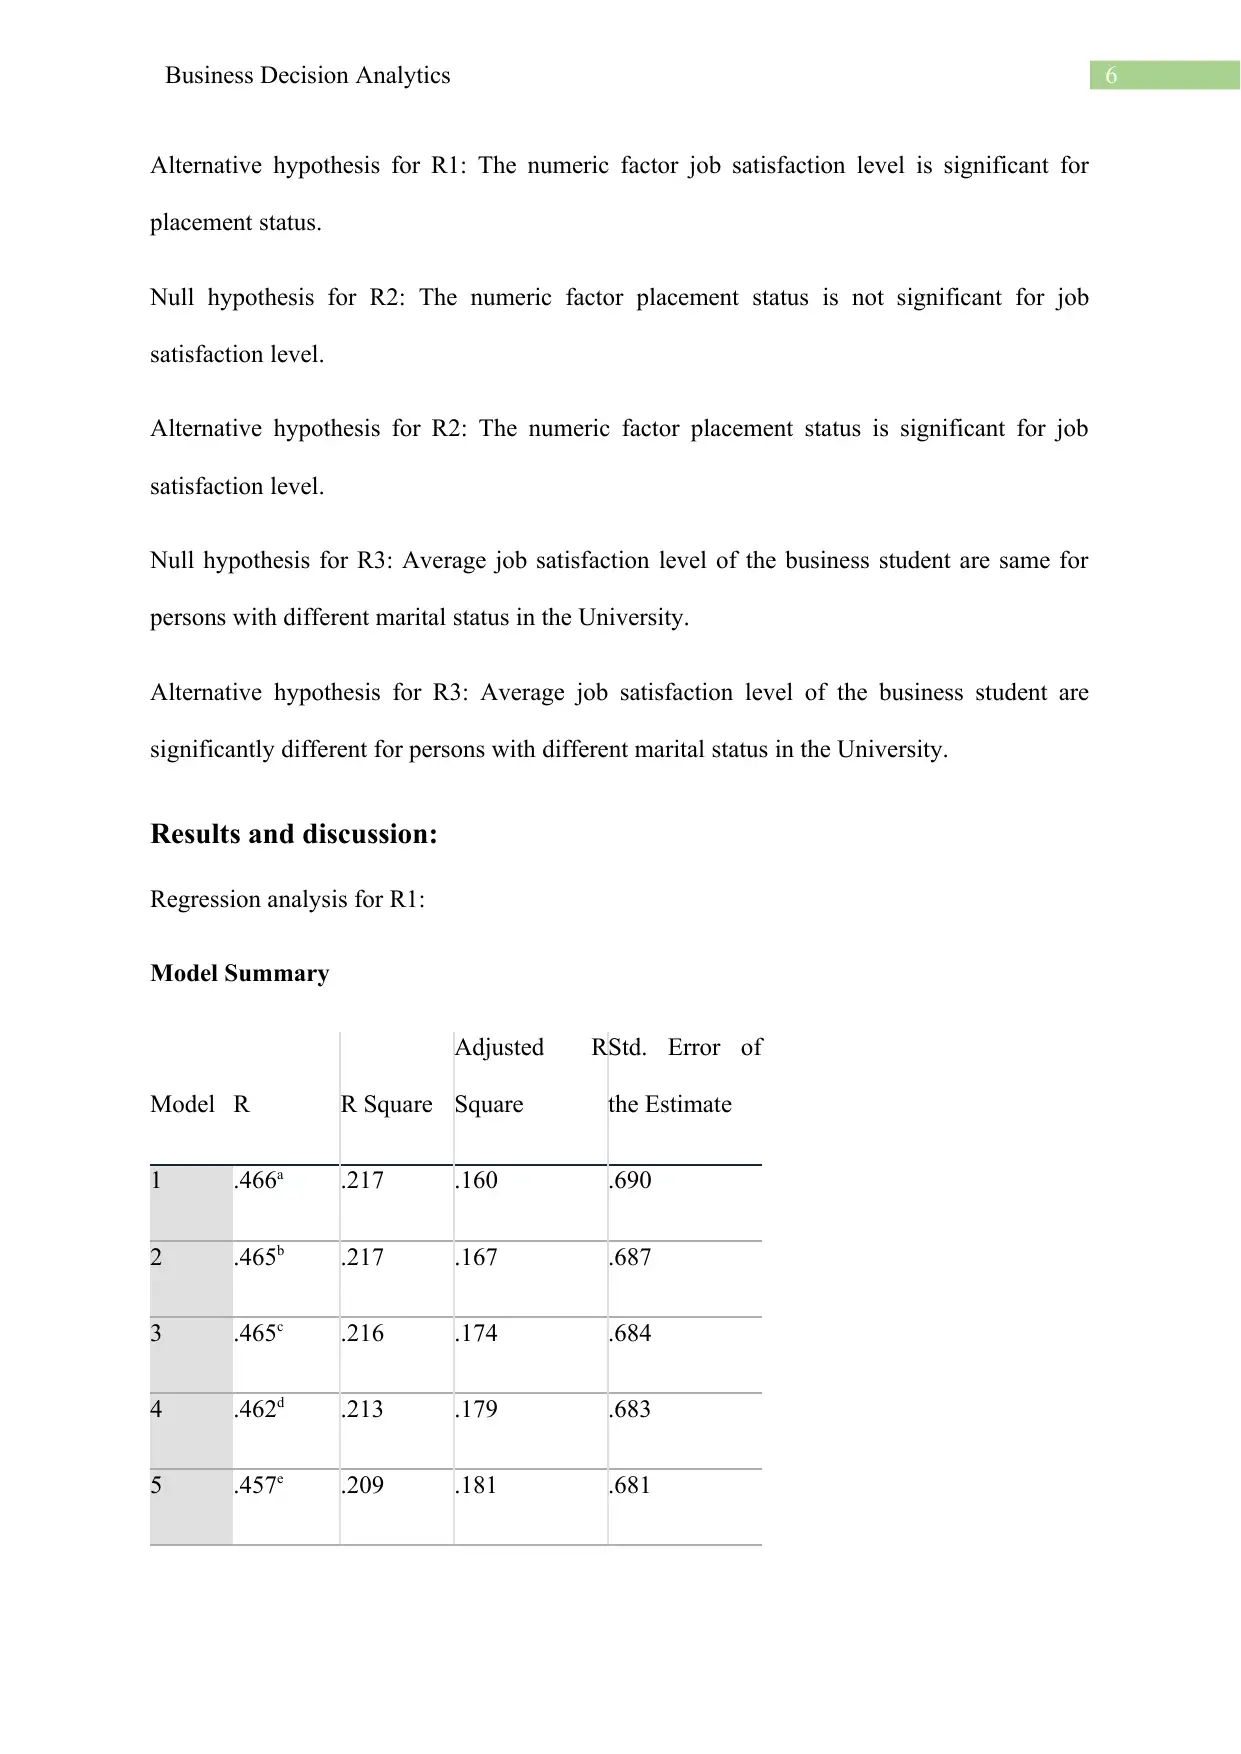
Results and discussion:
Regression analysis for R1:
Model Summary
Model R R Square
Adjusted R
Square
Std. Error of
the Estimate
1 .466a .217 .160 .690
2 .465b .217 .167 .687
3 .465c .216 .174 .684
4 .462d .213 .179 .683
5 .457e .209 .181 .681
Alternative hypothesis for R1: The numeric factor job satisfaction level is significant for
placement status.
Null hypothesis for R2: The numeric factor placement status is not significant for job
satisfaction level.
Alternative hypothesis for R2: The numeric factor placement status is significant for job
satisfaction level.
Null hypothesis for R3: Average job satisfaction level of the business student are same for
persons with different marital status in the University.
Alternative hypothesis for R3: Average job satisfaction level of the business student are
significantly different for persons with different marital status in the University.
Results and discussion:
Regression analysis for R1:
Model Summary
Model R R Square
Adjusted R
Square
Std. Error of
the Estimate
1 .466a .217 .160 .690
2 .465b .217 .167 .687
3 .465c .216 .174 .684
4 .462d .213 .179 .683
5 .457e .209 .181 .681
Paraphrase This Document
Need a fresh take? Get an instant paraphrase of this document with our AI Paraphraser
7Business Decision Analytics
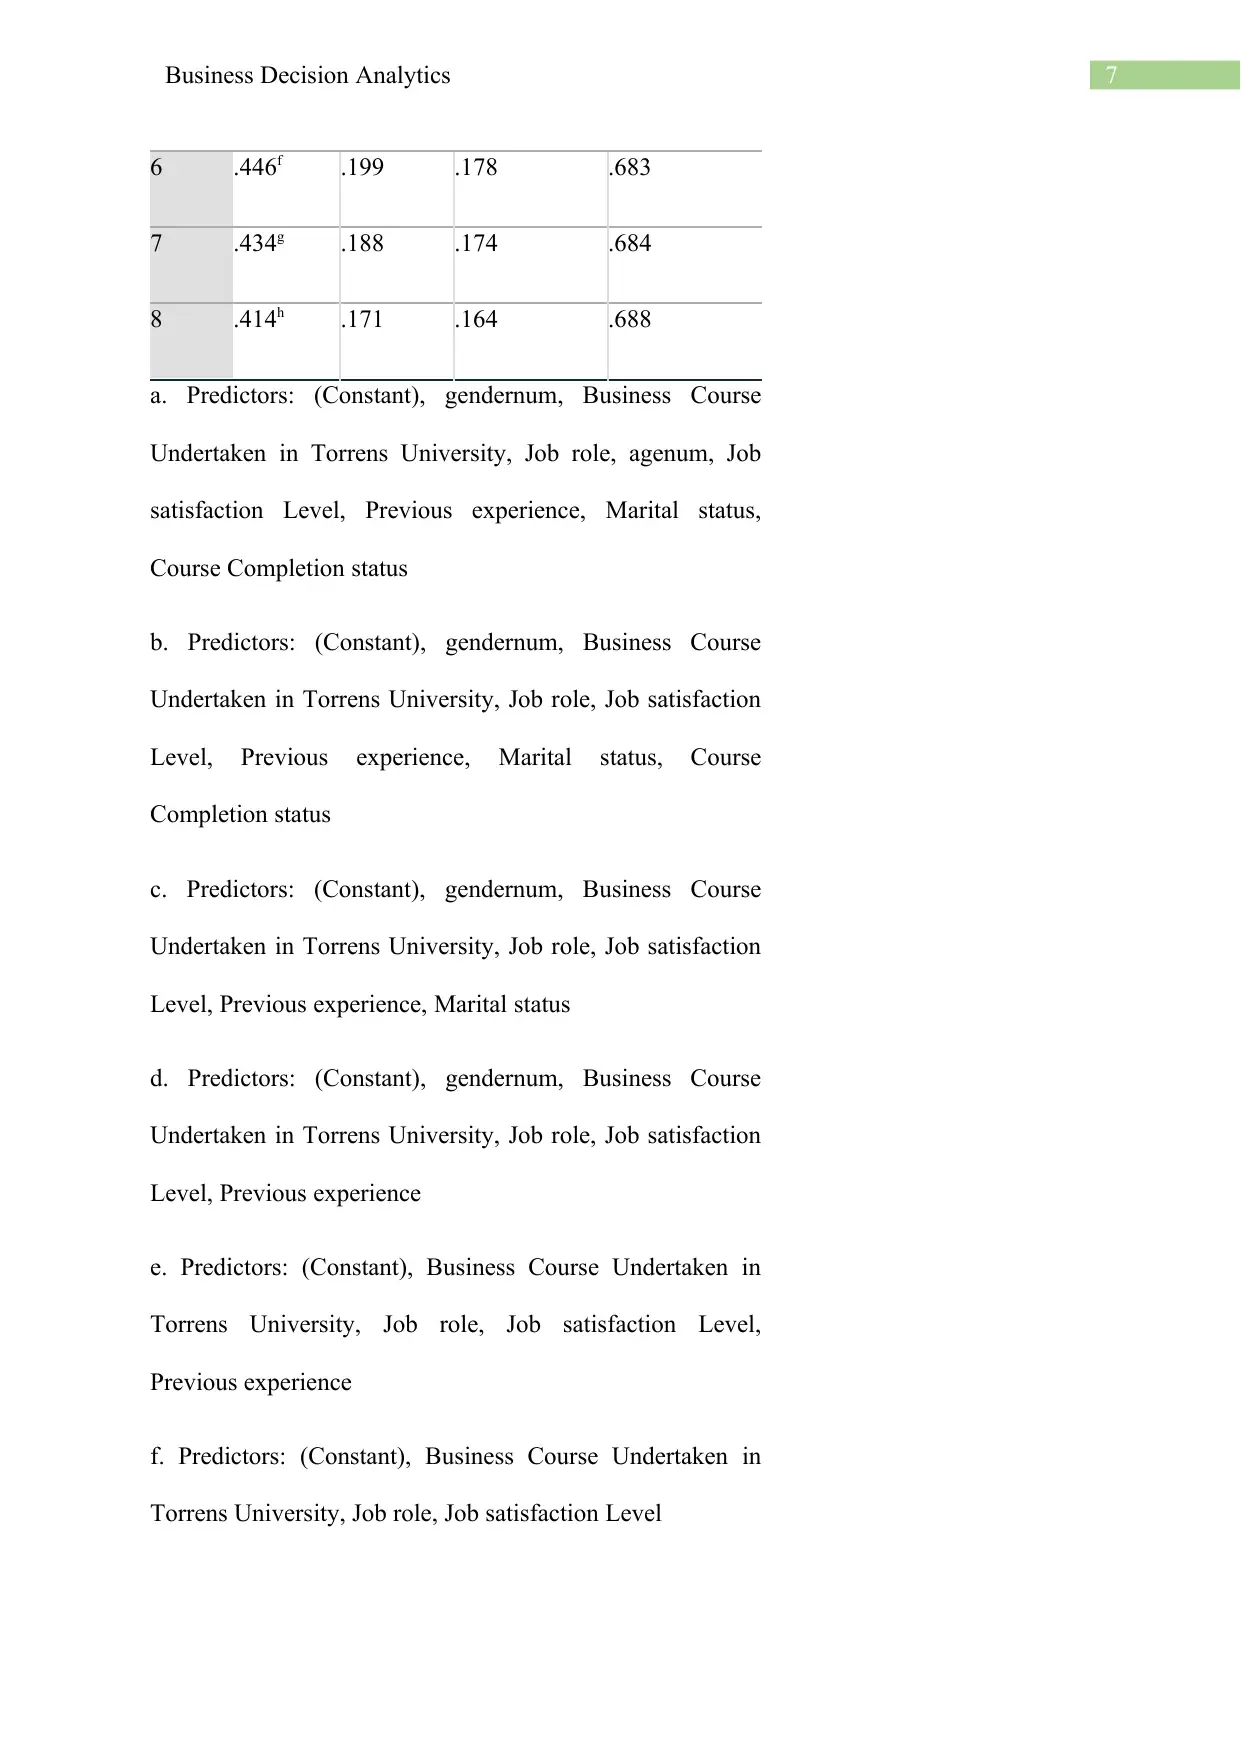
6 .446f .199 .178 .683
7 .434g .188 .174 .684
8 .414h .171 .164 .688
a. Predictors: (Constant), gendernum, Business Course
Undertaken in Torrens University, Job role, agenum, Job
satisfaction Level, Previous experience, Marital status,
Course Completion status
b. Predictors: (Constant), gendernum, Business Course
Undertaken in Torrens University, Job role, Job satisfaction
Level, Previous experience, Marital status, Course
Completion status
c. Predictors: (Constant), gendernum, Business Course
Undertaken in Torrens University, Job role, Job satisfaction
Level, Previous experience, Marital status
d. Predictors: (Constant), gendernum, Business Course
Undertaken in Torrens University, Job role, Job satisfaction
Level, Previous experience
e. Predictors: (Constant), Business Course Undertaken in
Torrens University, Job role, Job satisfaction Level,
Previous experience
f. Predictors: (Constant), Business Course Undertaken in
Torrens University, Job role, Job satisfaction Level
8Business Decision Analytics
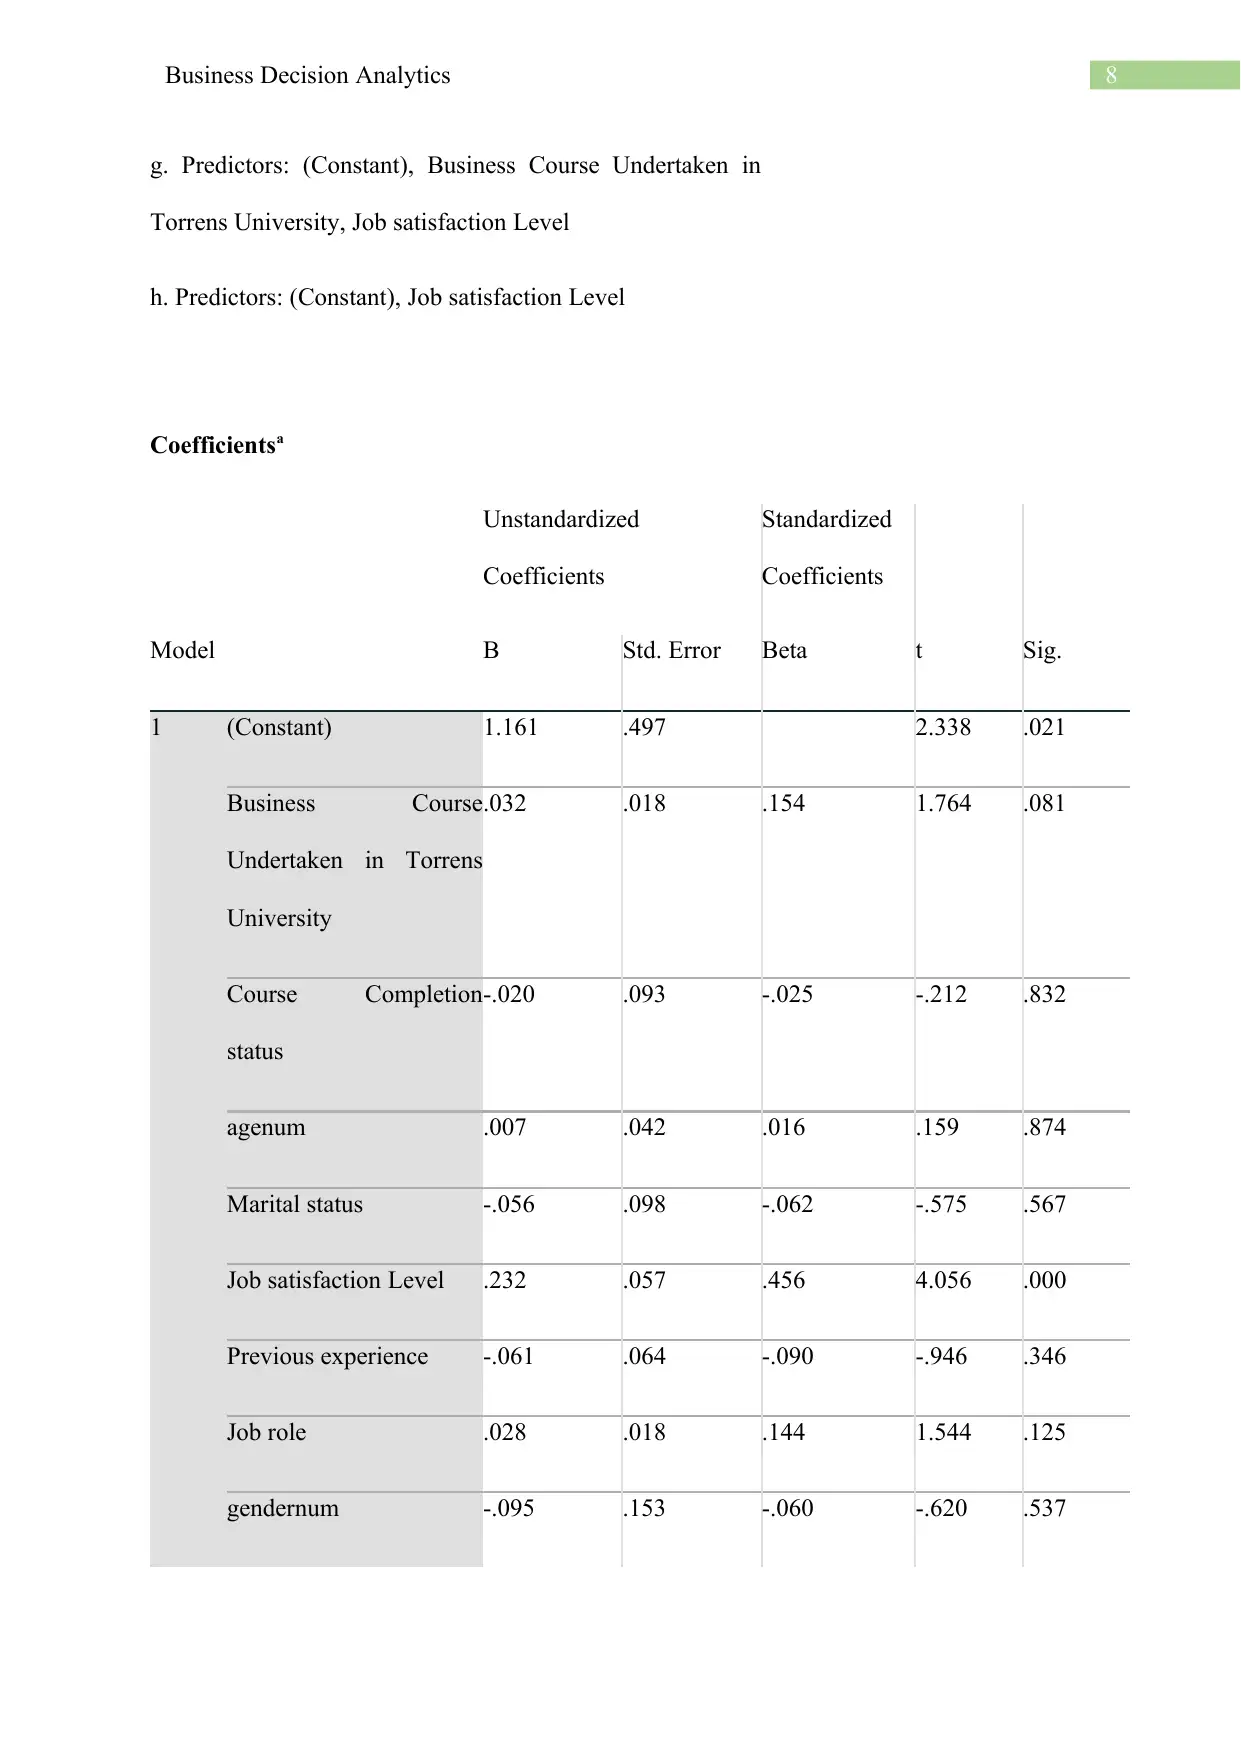
g. Predictors: (Constant), Business Course Undertaken in
Torrens University, Job satisfaction Level
h. Predictors: (Constant), Job satisfaction Level
Coefficientsa
Model
Unstandardized
Coefficients
Standardized
Coefficients
t Sig.B Std. Error Beta
1 (Constant) 1.161 .497 2.338 .021
Business Course
Undertaken in Torrens
University
.032 .018 .154 1.764 .081
Course Completion
status
-.020 .093 -.025 -.212 .832
agenum .007 .042 .016 .159 .874
Marital status -.056 .098 -.062 -.575 .567
Job satisfaction Level .232 .057 .456 4.056 .000
Previous experience -.061 .064 -.090 -.946 .346
Job role .028 .018 .144 1.544 .125
gendernum -.095 .153 -.060 -.620 .537
⊘ This is a preview!⊘
Do you want full access?
Subscribe today to unlock all pages.
Trusted by 1+ million students worldwide
9Business Decision Analytics
2 (Constant) 1.206 .406 2.974 .004
Business Course
Undertaken in Torrens
University
.032 .018 .156 1.797 .075
Course Completion
status
-.026 .083 -.033 -.317 .752
Marital status -.061 .092 -.068 -.664 .508
Job satisfaction Level .231 .057 .454 4.085 .000
Previous experience -.061 .064 -.090 -.952 .343
Job role .028 .018 .146 1.608 .111
gendernum -.101 .147 -.064 -.690 .492
3 (Constant) 1.123 .307 3.656 .000
Business Course
Undertaken in Torrens
University
.032 .018 .154 1.787 .077
Marital status -.055 .090 -.061 -.613 .541
Job satisfaction Level .238 .052 .467 4.563 .000
Previous experience -.059 .063 -.087 -.931 .354
Job role .027 .017 .140 1.583 .116
gendernum -.096 .145 -.061 -.663 .509
Paraphrase This Document
Need a fresh take? Get an instant paraphrase of this document with our AI Paraphraser
10Business Decision Analytics
4 (Constant) 1.089 .301 3.615 .000
Business Course
Undertaken in Torrens
University
.030 .017 .144 1.709 .090
Job satisfaction Level .223 .046 .438 4.838 .000
Previous experience -.060 .063 -.088 -.943 .348
Job role .026 .017 .135 1.539 .127
gendernum -.112 .143 -.071 -.788 .433
5 (Constant) 1.016 .286 3.550 .001
Business Course
Undertaken in Torrens
University
.030 .017 .144 1.711 .090
Job satisfaction Level .212 .044 .417 4.831 .000
Previous experience -.074 .060 -.110 -1.231 .221
Job role .026 .017 .132 1.507 .135
6 (Constant) .805 .230 3.506 .001
Business Course
Undertaken in Torrens
University
.029 .017 .141 1.673 .097
Job satisfaction Level .224 .043 .439 5.201 .000
11Business Decision Analytics
Job role .020 .016 .101 1.202 .232
7 (Constant) .971 .183 5.295 .000
Business Course
Undertaken in Torrens
University
.027 .017 .131 1.557 .122
Job satisfaction Level .219 .043 .430 5.104 .000
8 (Constant) 1.172 .131 8.911 .000
Job satisfaction Level .211 .043 .414 4.921 .000
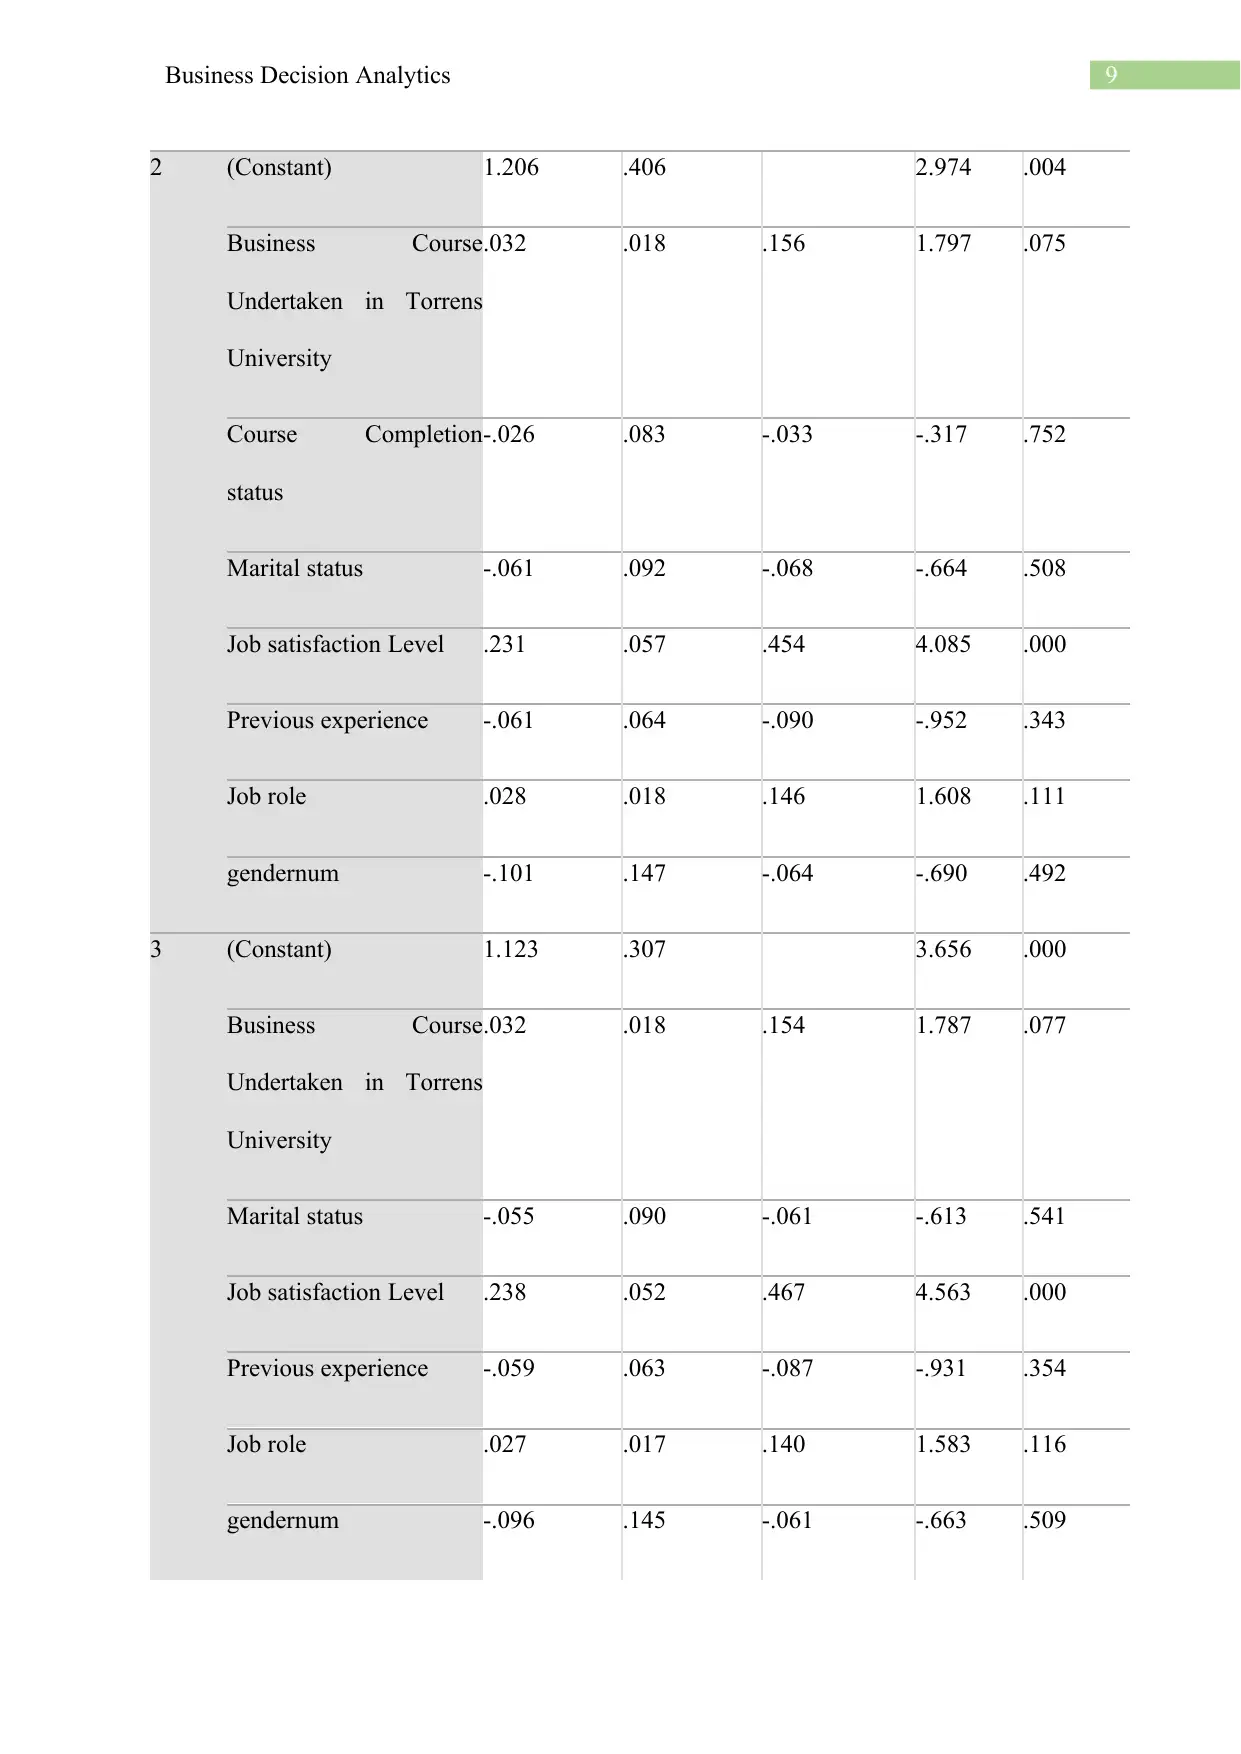
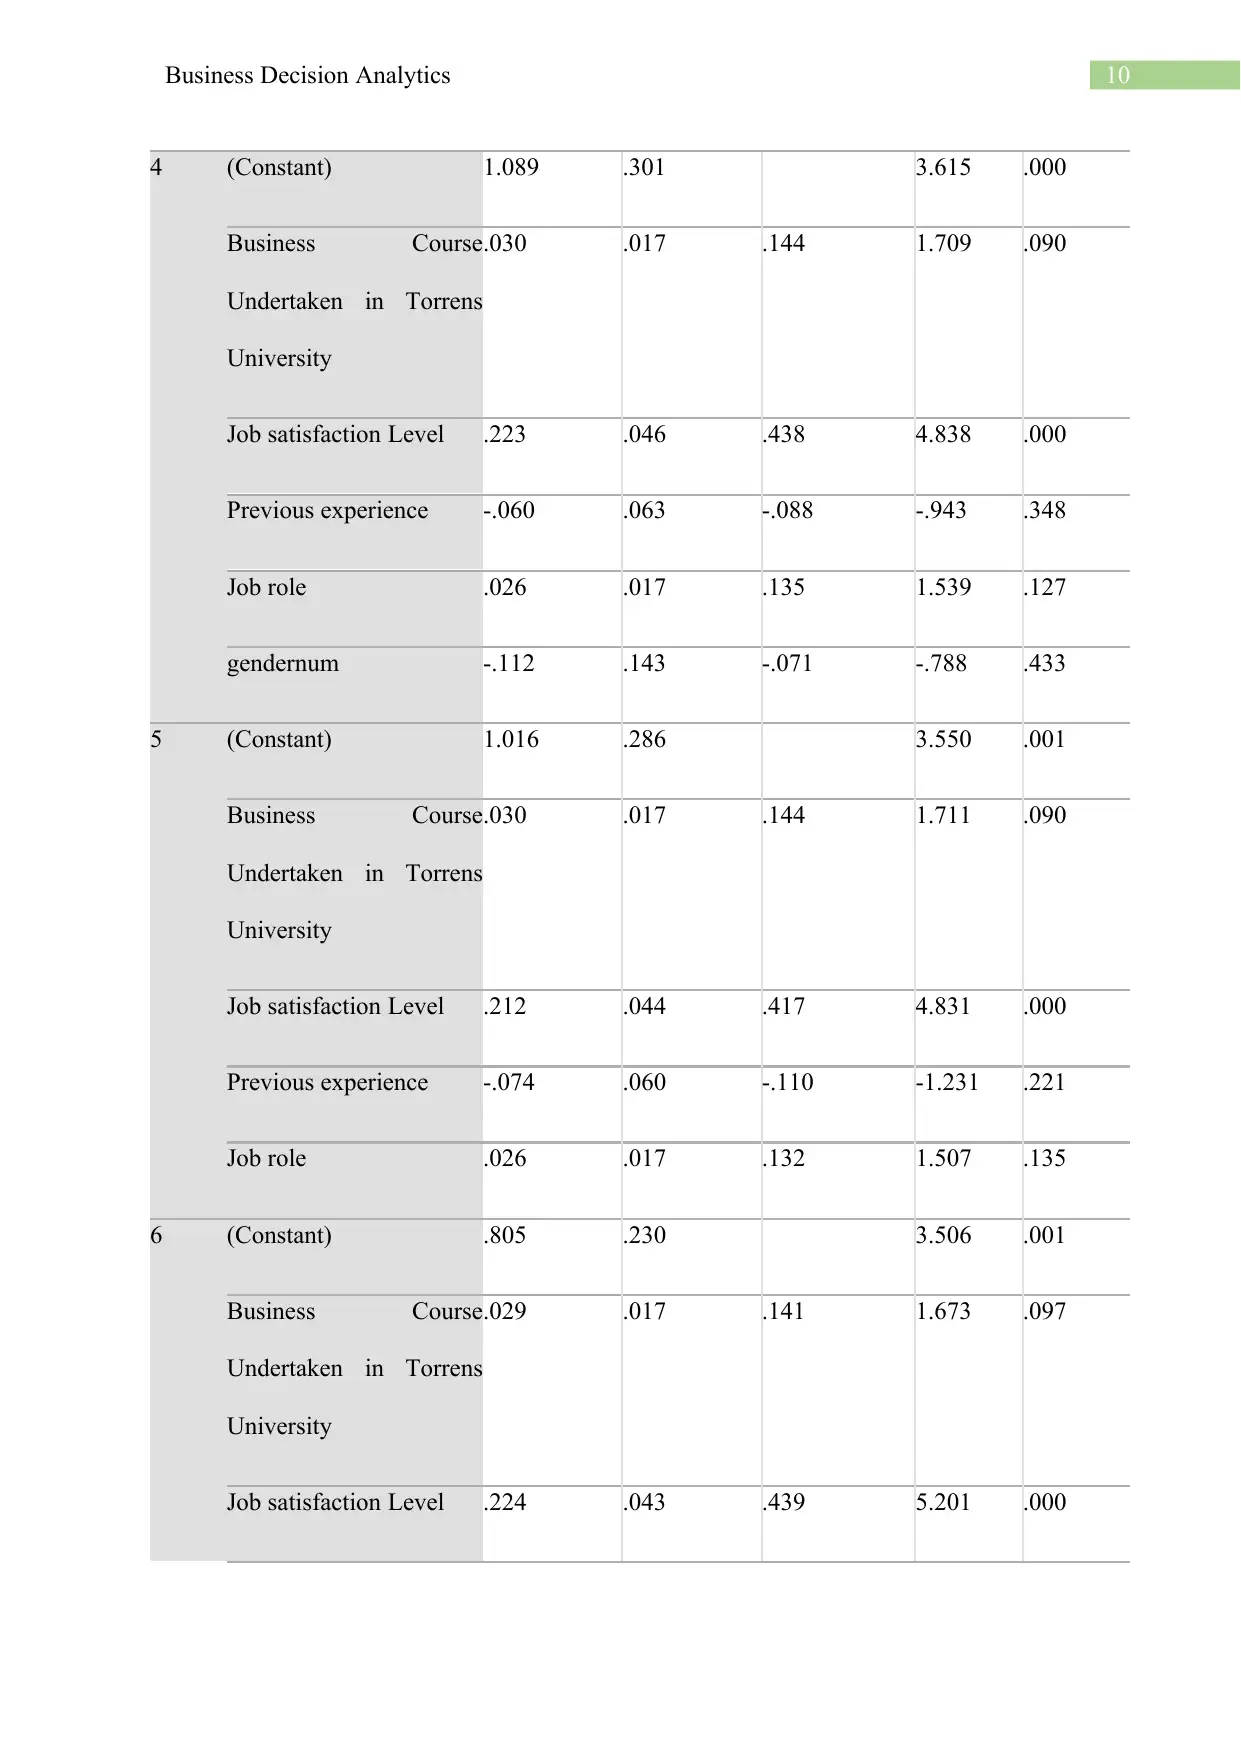
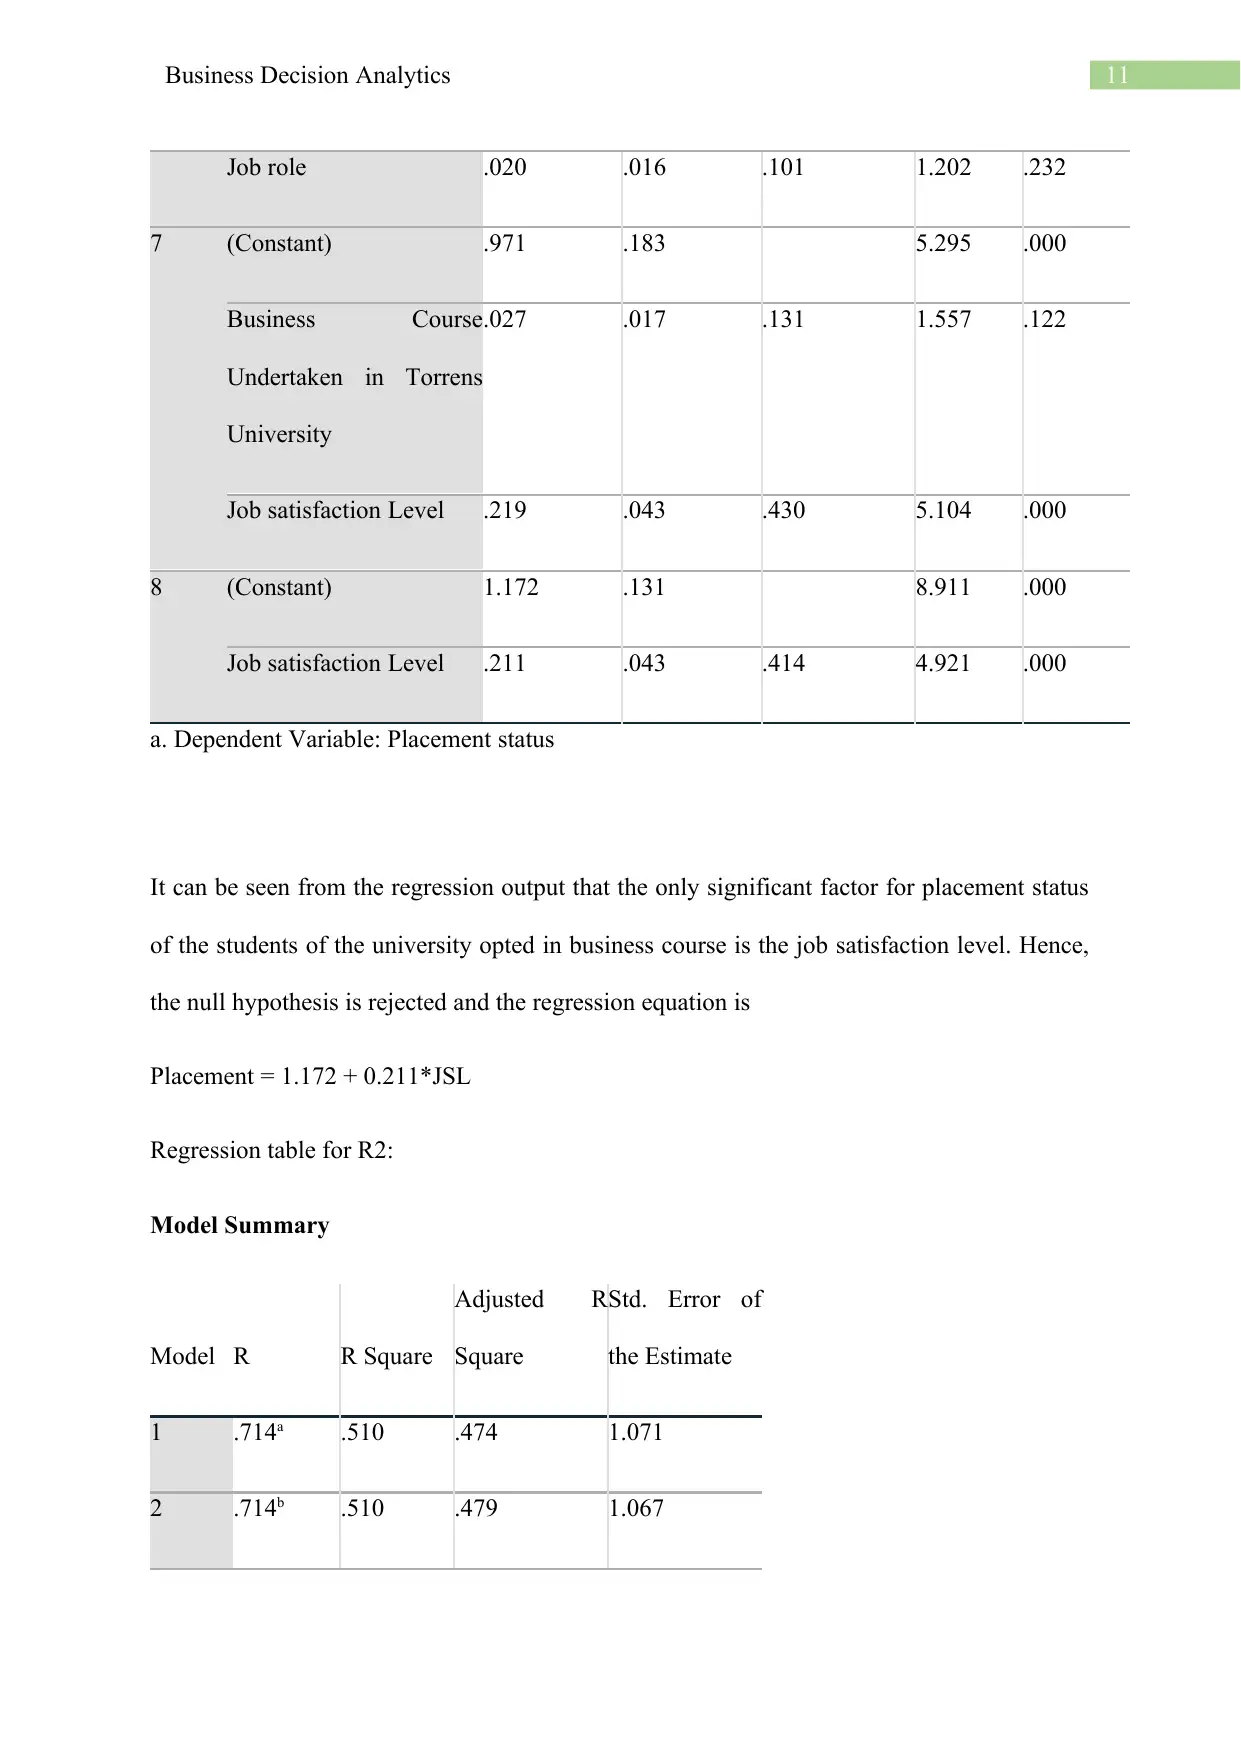
a. Dependent Variable: Placement status
It can be seen from the regression output that the only significant factor for placement status
of the students of the university opted in business course is the job satisfaction level. Hence,
the null hypothesis is rejected and the regression equation is
Placement = 1.172 + 0.211*JSL
Regression table for R2:
Model Summary
Model R R Square
Adjusted R
Square
Std. Error of
the Estimate
1 .714a .510 .474 1.071
2 .714b .510 .479 1.067
Job role .020 .016 .101 1.202 .232
7 (Constant) .971 .183 5.295 .000
Business Course
Undertaken in Torrens
University
.027 .017 .131 1.557 .122
Job satisfaction Level .219 .043 .430 5.104 .000
8 (Constant) 1.172 .131 8.911 .000
Job satisfaction Level .211 .043 .414 4.921 .000
a. Dependent Variable: Placement status
It can be seen from the regression output that the only significant factor for placement status
of the students of the university opted in business course is the job satisfaction level. Hence,
the null hypothesis is rejected and the regression equation is
Placement = 1.172 + 0.211*JSL
Regression table for R2:
Model Summary
Model R R Square
Adjusted R
Square
Std. Error of
the Estimate
1 .714a .510 .474 1.071
2 .714b .510 .479 1.067
⊘ This is a preview!⊘
Do you want full access?
Subscribe today to unlock all pages.
Trusted by 1+ million students worldwide
1 out of 22
Related Documents


Your All-in-One AI-Powered Toolkit for Academic Success.
+13062052269
info@desklib.com
Available 24*7 on WhatsApp / Email
![[object Object]](/_next/static/media/star-bottom.7253800d.svg)
Unlock your academic potential
Copyright © 2020–2026 A2Z Services. All Rights Reserved. Developed and managed by ZUCOL.