University: BUS708 Statistics and Data Analysis Report on Sydney Rents

Verified

Added on  2020/03/01

|14
|2112
|65
Report
AI Summary
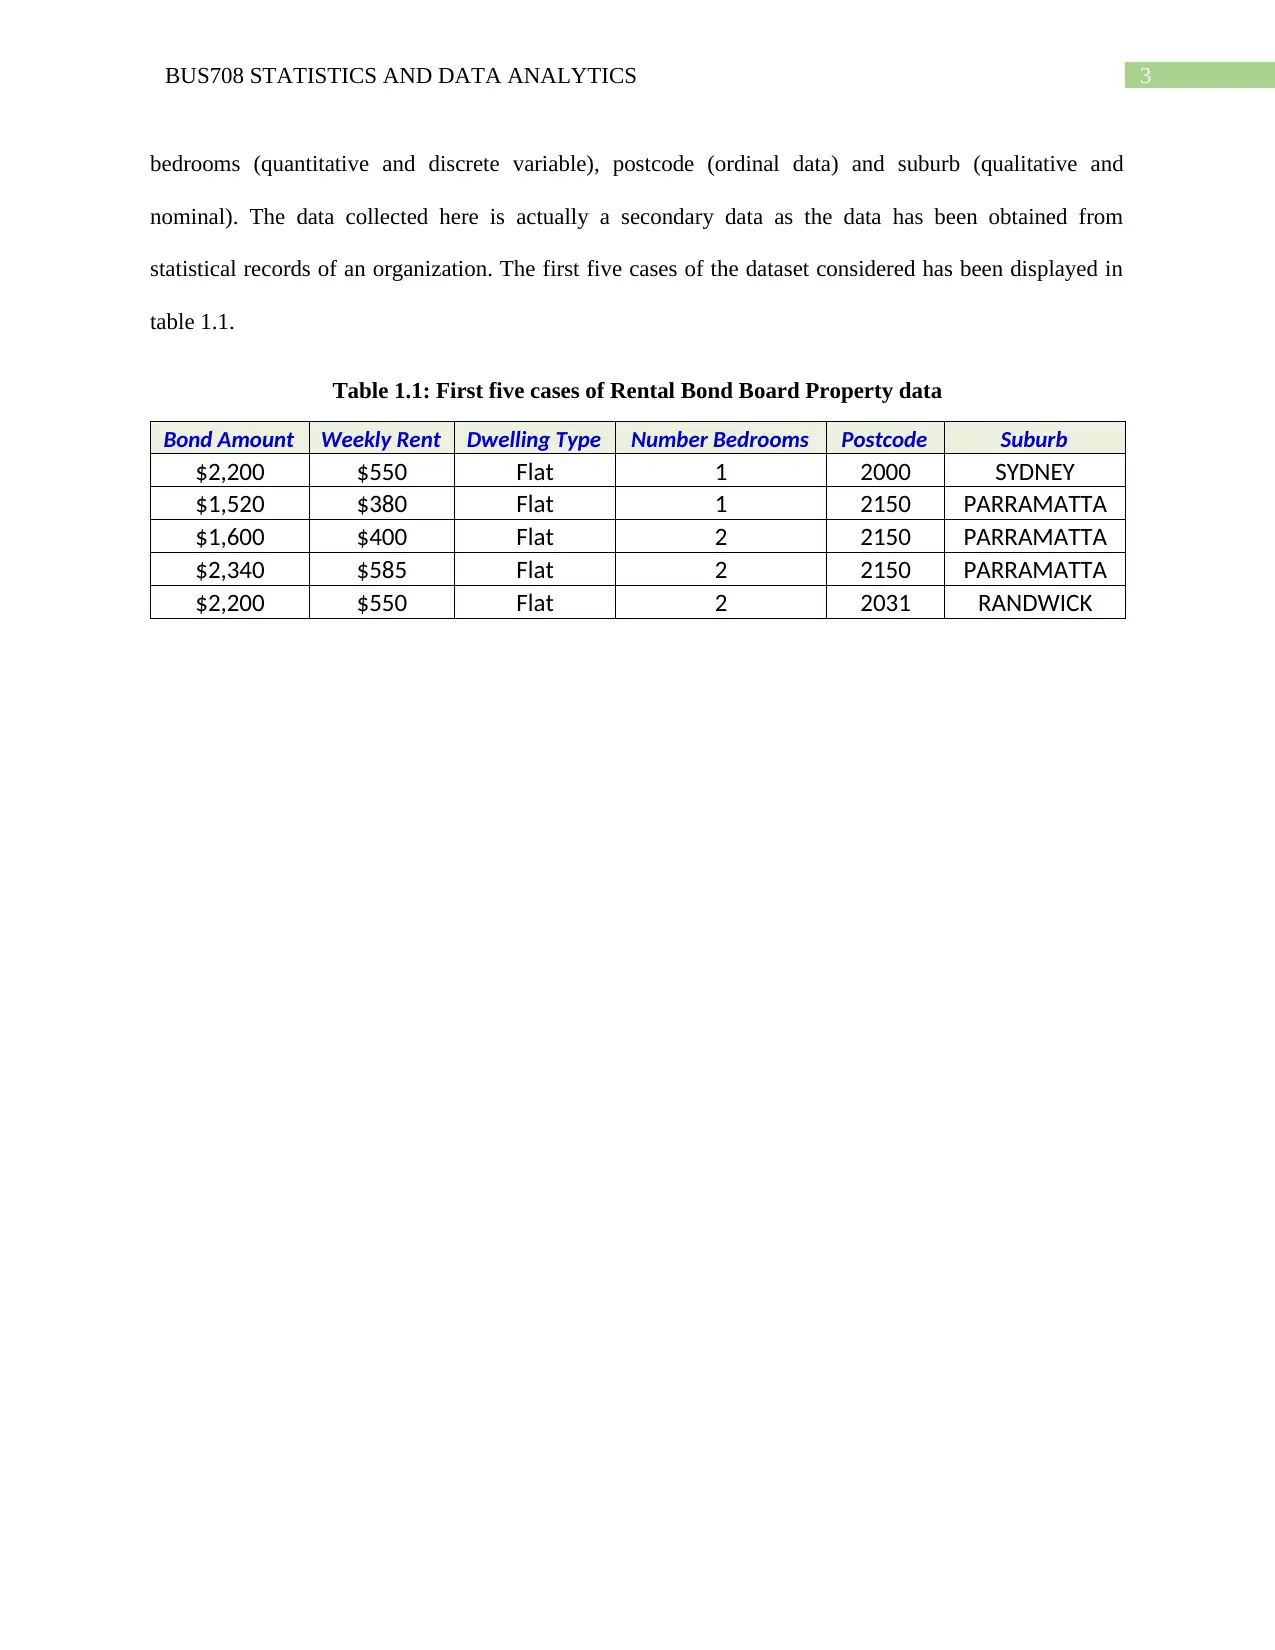
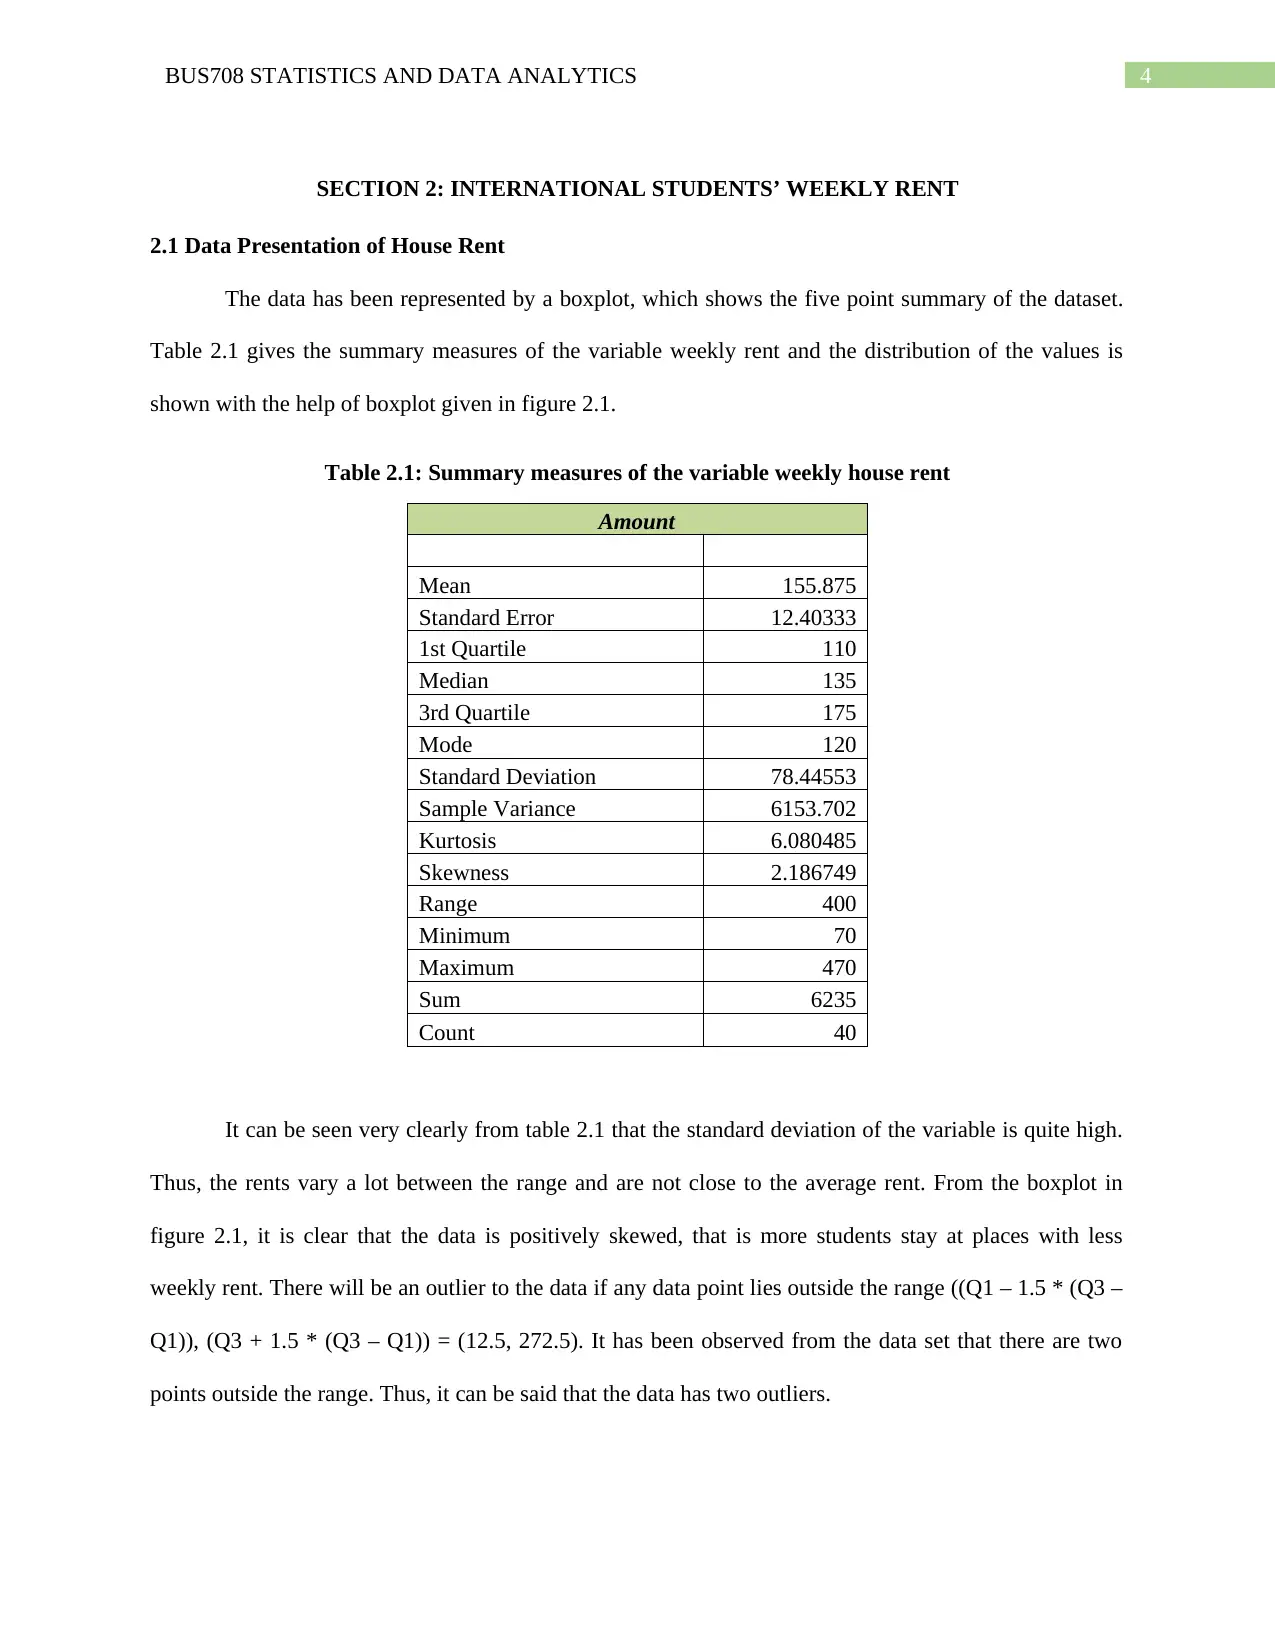
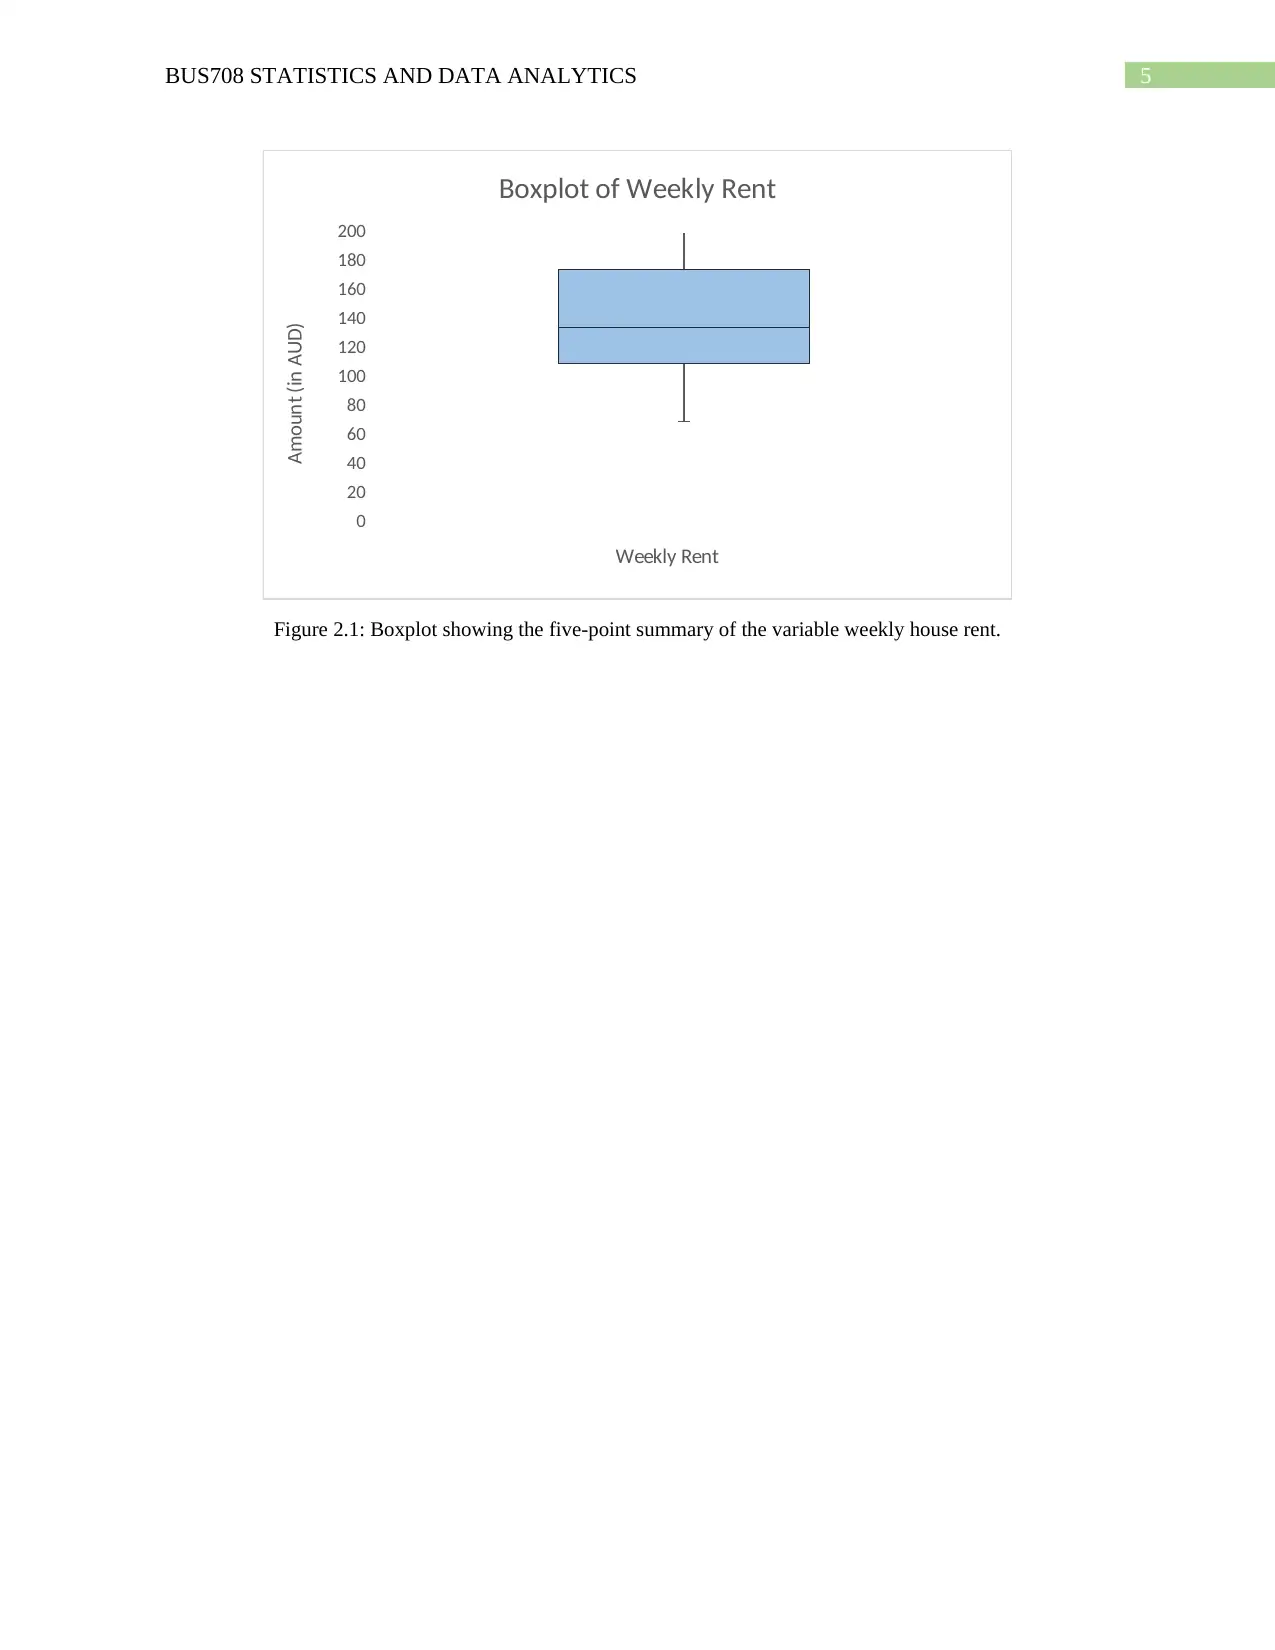
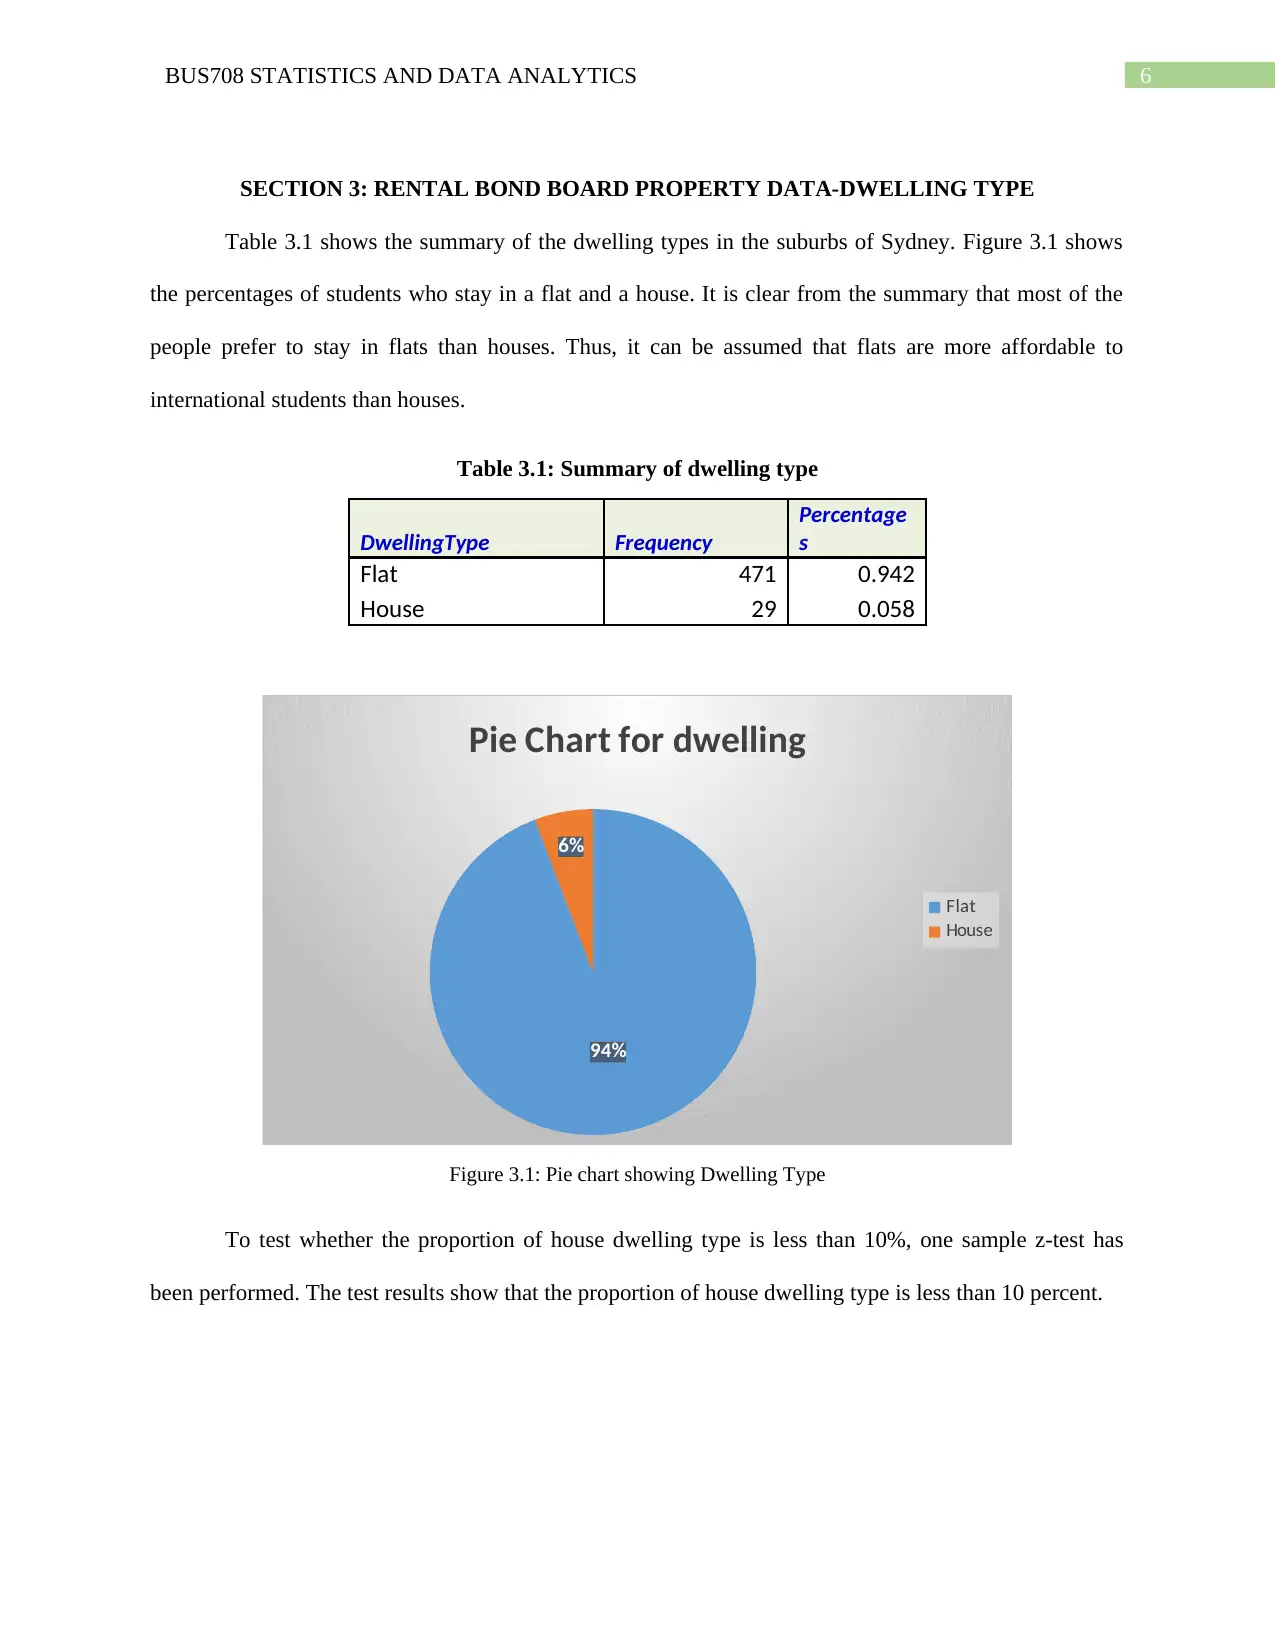
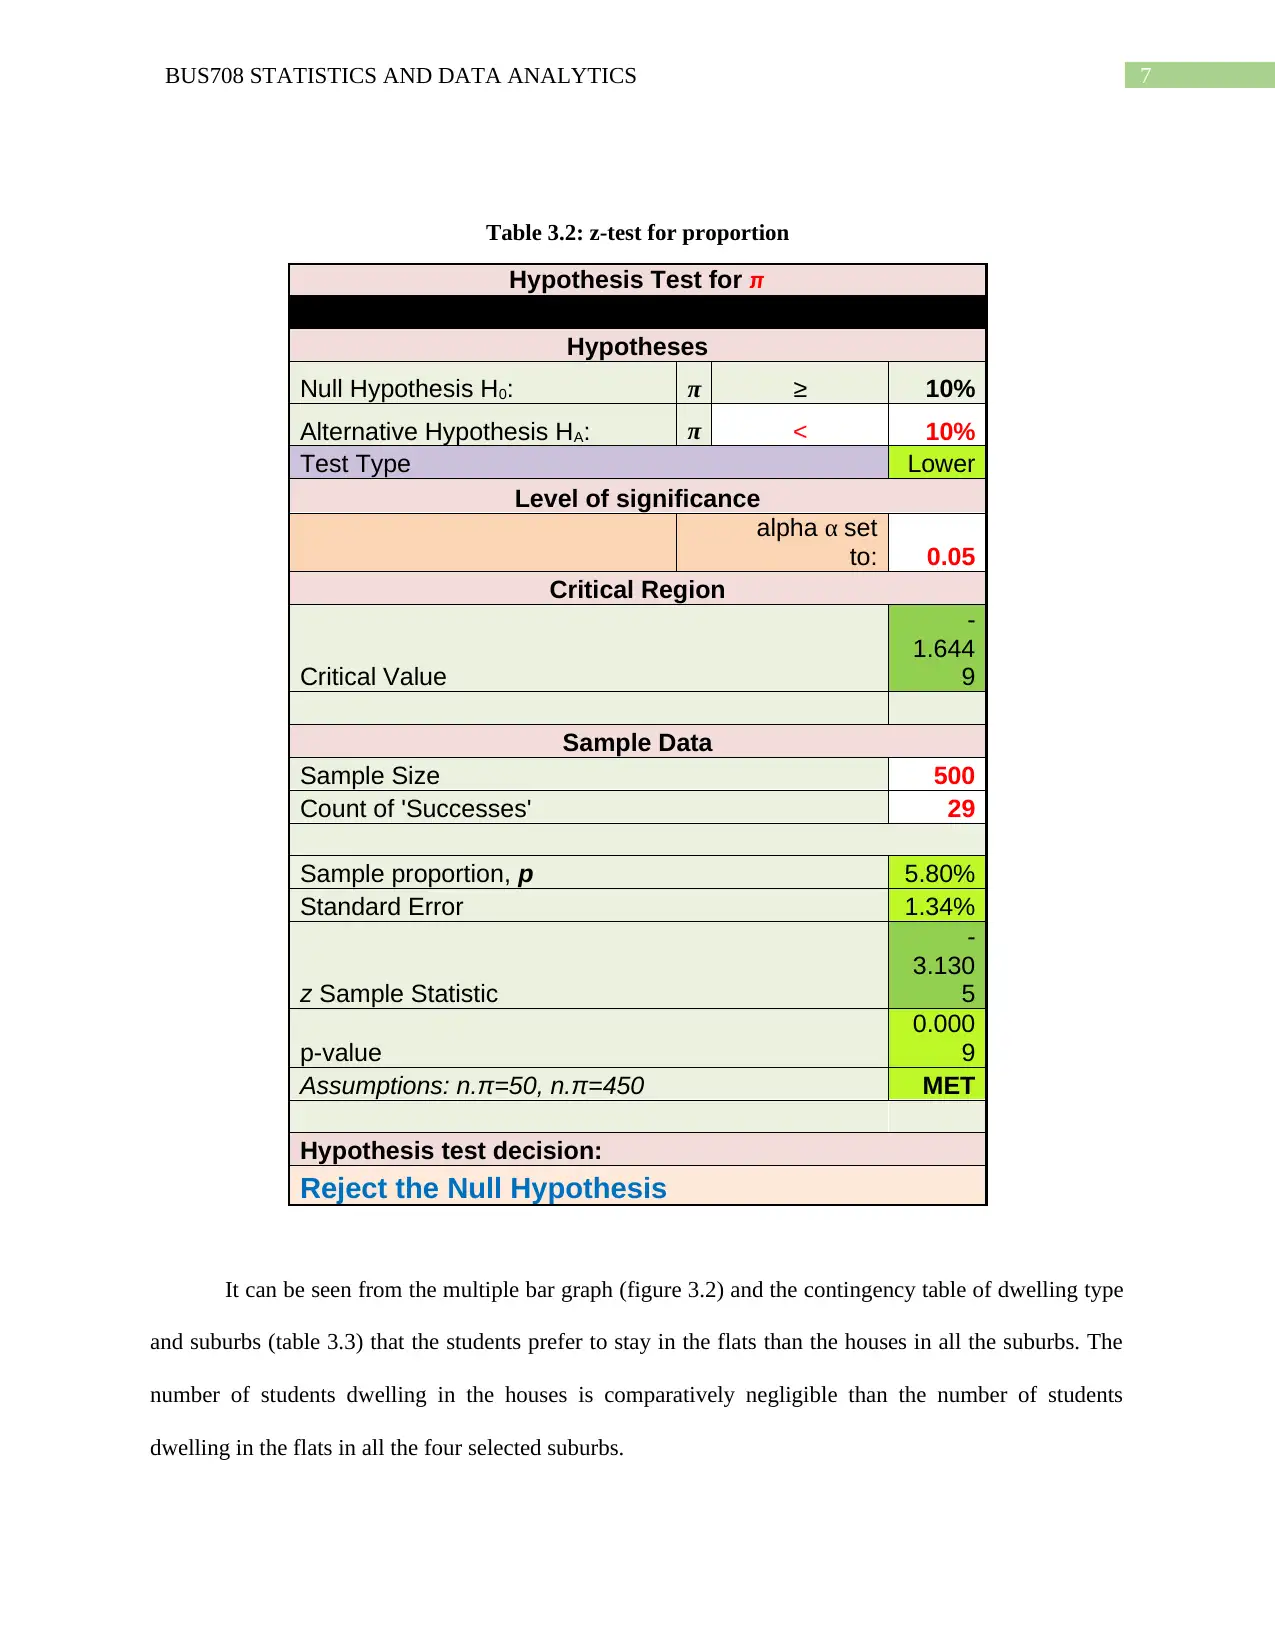
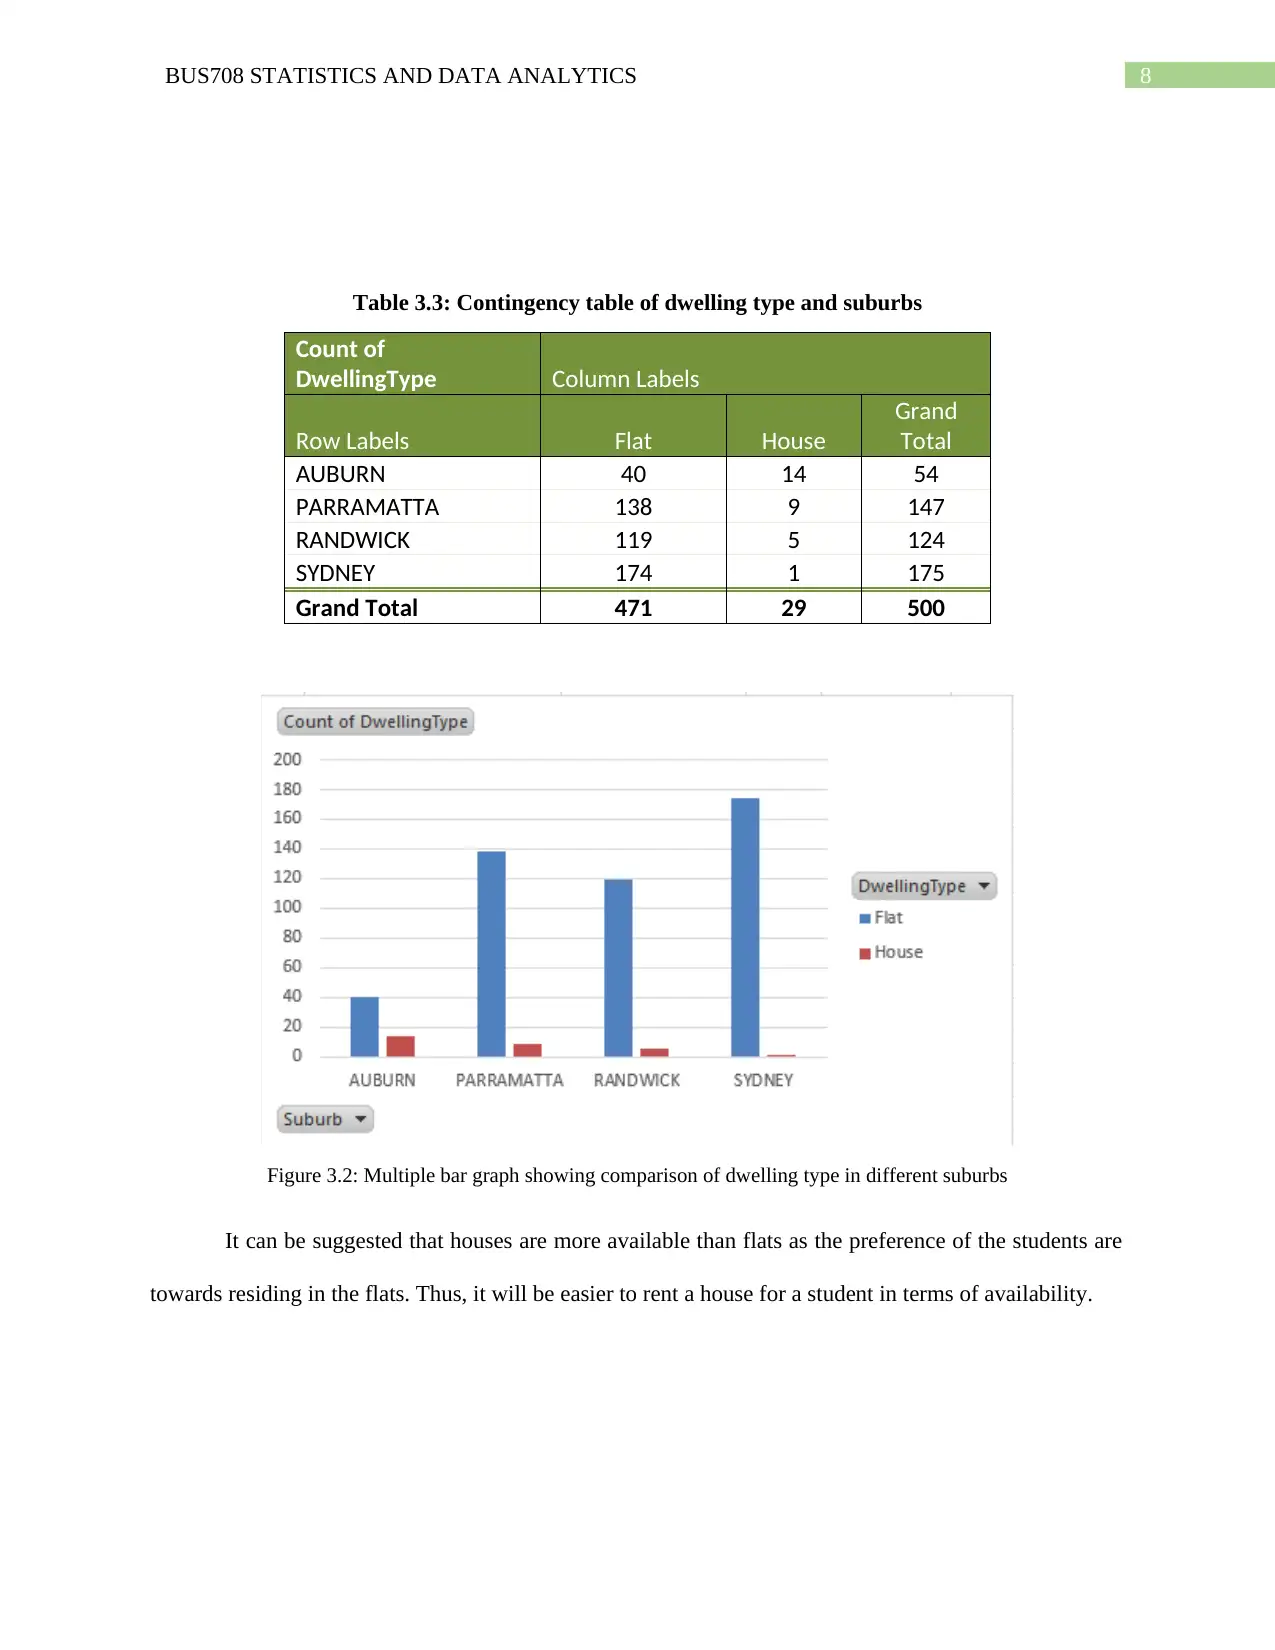
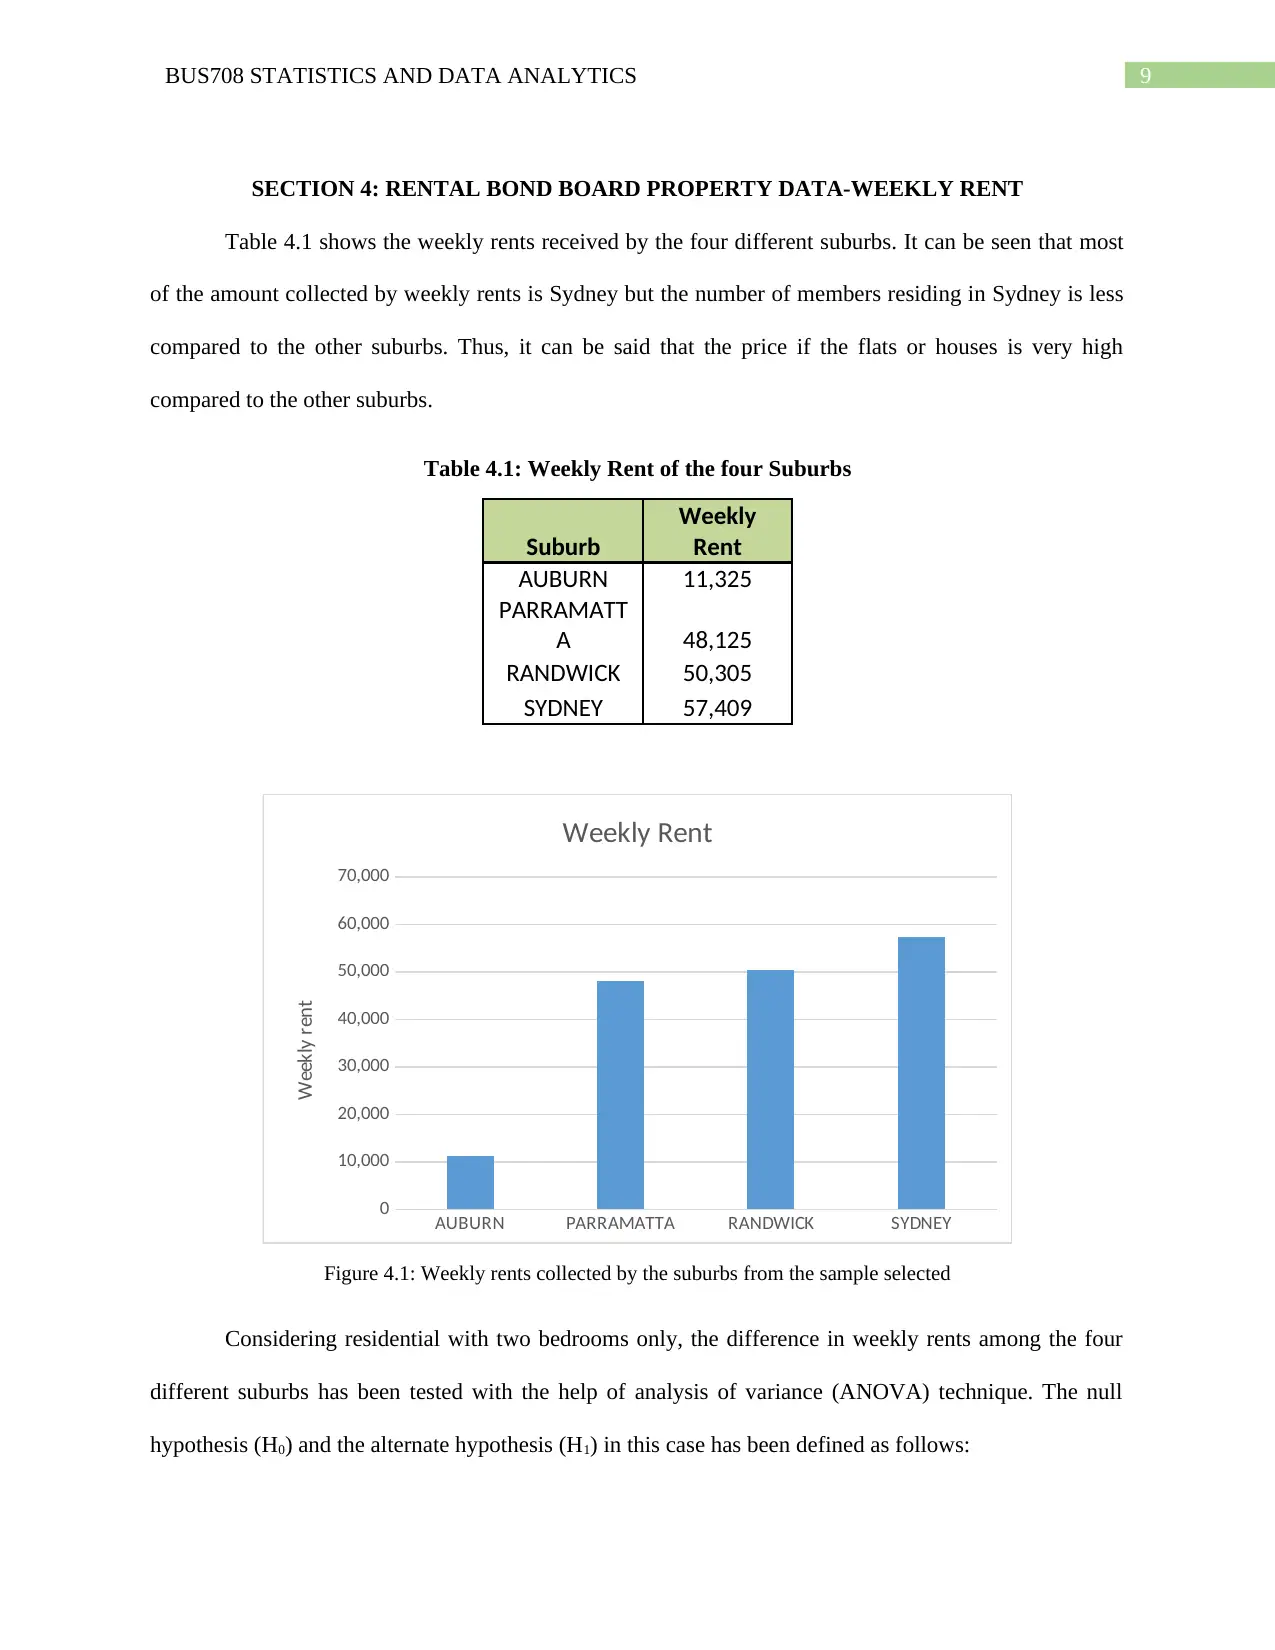
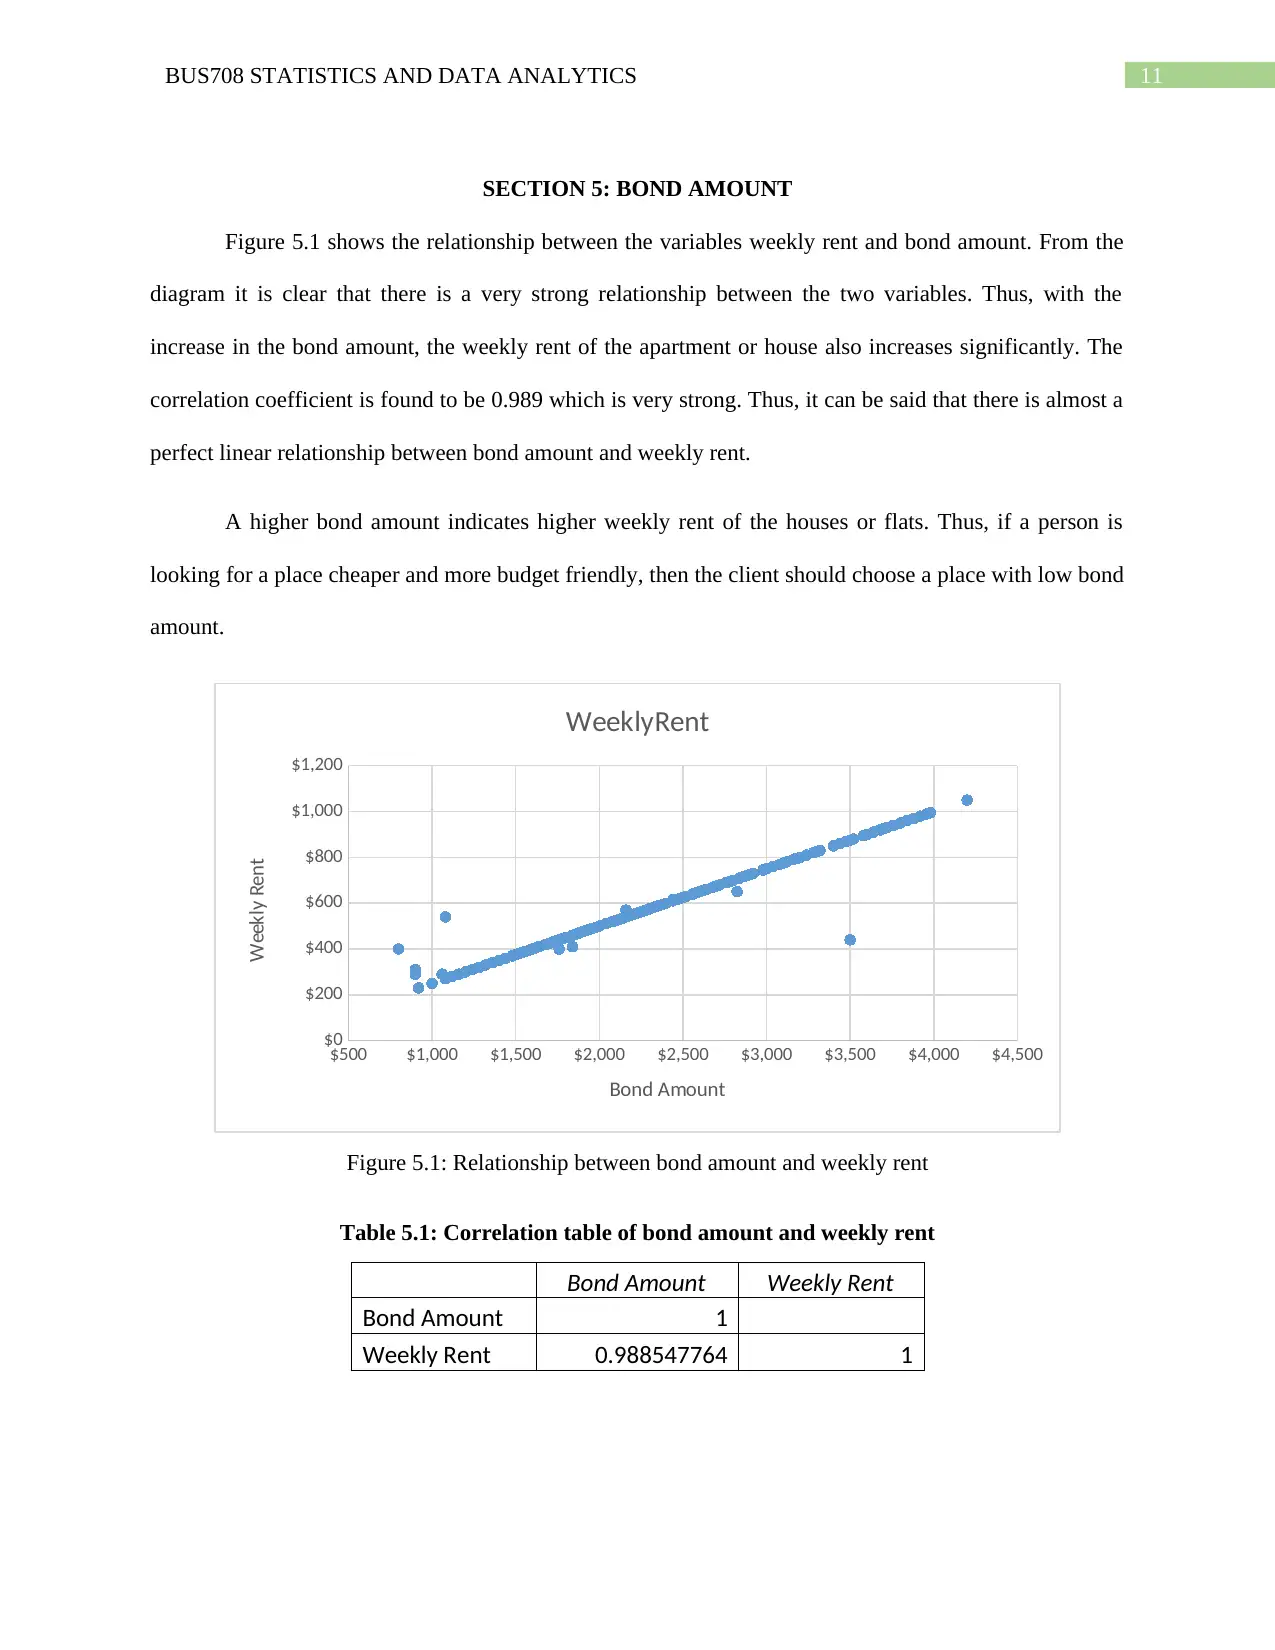
This report presents a comprehensive analysis of international student rent data in Sydney, Australia. The study examines the weekly rent paid by international students across four suburbs: Sydney, Randwick, Parramatta, and Auburn. The analysis utilizes two datasets: one focusing on student rent and the other on rental bond board property data. Key findings include the use of boxplots to visualize rent distributions, revealing positive skewness and outliers. The report also explores dwelling types, showing a preference for flats over houses, and employs a z-test to confirm this trend. Furthermore, the study investigates the relationship between weekly rent and bond amounts, finding a strong positive correlation. ANOVA is used to compare rent differences among suburbs, suggesting Parramatta as a more affordable option. The report concludes with recommendations for future research, including considering the origin and economic conditions of the students. The analysis includes tables, figures, and statistical tests such as z-tests and ANOVA to support the findings.
Document Page
Running Head: BUS708 STATISTICS AND DATA ANALYTICS
BUS708
Statistics and Data Analytics
Name of the Student
Name of the University
Author Note
tabler-icon-diamond-filled.svg

Paraphrase This Document

Need a fresh take? Get an instant paraphrase of this document with our AI Paraphraser
Document Page
1BUS708 STATISTICS AND DATA ANALYTICS
Table of Contents
SECTION 1: INTRODUCTION...................................................................................................................2
1.1 Introduction.........................................................................................................................................2
1.2 Explanation of Dataset on International Students...............................................................................2
1.3 Explanation of the Rental Bond Board Property Data........................................................................2
SECTION 2: INTERNATIONAL STUDENTS’ WEEKLY RENT.............................................................4
2.1 Data Presentation of House Rent.........................................................................................................4
SECTION 3: RENTAL BOND BOARD PROPERTY DATA-DWELLING TYPE...................................6
Document Page
2BUS708 STATISTICS AND DATA ANALYTICS
SECTION 1: INTRODUCTION
1.1 Introduction
An Australian company provides services for the people around the world who wants to relocate
to Australia temporarily or permanently. One of the prime facilities provided by this Australian Company
is to help their clients in choosing the best and most reasonable place of accommodation, which will also
be budget friendly. These clients mainly include international students. The main aim of this study is to
analyze the rents provided by the households or the apartments in the four main suburbs in Sydney metro.
These suburbs include Sydney, Randwick, Parramatta and Auburn. The rents that the international
students are paying currently are to be analyzed. This will give the clients a clear idea of the rents in the
different suburbs and thus will make it easier to offer their clients with a rate and negotiate with the
property owners.
1.2 Explanation of Dataset on International Students
A sample of 40 students have been collected and their weekly house rents have been recorded. 40
international students were selected from the four Australian suburbs namely Sydney, Randwick,
Parramatta and Auburn. These students were selected by the method of simple random sampling. Thus, it
can be said the sample selected is unbiased. The data has been collected directly from the students by a
survey. Thus the data so collected is a primary data. The variable involved in this case is the weekly rent
paid by the students. Thus, this is a continuous variable.
1.3 Explanation of the Rental Bond Board Property Data
The second dataset, that is the dataset on Rental Bond Board Property Data has been collected
from the NSW Rental Bonds data that was published by the department of Finance, Services and
Innovation. For the purpose of this study, a subset of the original dataset has been considered. The
variables involved in this dataset are Bond Amount (quantitative and continuous variable), Weekly Rent
(quantitative and continuous variable), Dwelling Type (qualitative variable, nominal), number of
Document Page
3BUS708 STATISTICS AND DATA ANALYTICS
bedrooms (quantitative and discrete variable), postcode (ordinal data) and suburb (qualitative and
nominal). The data collected here is actually a secondary data as the data has been obtained from
statistical records of an organization. The first five cases of the dataset considered has been displayed in
table 1.1.
Table 1.1: First five cases of Rental Bond Board Property data
Bond Amount Weekly Rent Dwelling Type Number Bedrooms Postcode Suburb
$2,200 $550 Flat 1 2000 SYDNEY
$1,520 $380 Flat 1 2150 PARRAMATTA
$1,600 $400 Flat 2 2150 PARRAMATTA
$2,340 $585 Flat 2 2150 PARRAMATTA
$2,200 $550 Flat 2 2031 RANDWICK
tabler-icon-diamond-filled.svg

Paraphrase This Document

Need a fresh take? Get an instant paraphrase of this document with our AI Paraphraser
Document Page
4BUS708 STATISTICS AND DATA ANALYTICS
SECTION 2: INTERNATIONAL STUDENTS’ WEEKLY RENT
2.1 Data Presentation of House Rent
The data has been represented by a boxplot, which shows the five point summary of the dataset.
Table 2.1 gives the summary measures of the variable weekly rent and the distribution of the values is
shown with the help of boxplot given in figure 2.1.
Table 2.1: Summary measures of the variable weekly house rent
Amount
Mean 155.875
Standard Error 12.40333
1st Quartile 110
Median 135
3rd Quartile 175
Mode 120
Standard Deviation 78.44553
Sample Variance 6153.702
Kurtosis 6.080485
Skewness 2.186749
Range 400
Minimum 70
Maximum 470
Sum 6235
Count 40
It can be seen very clearly from table 2.1 that the standard deviation of the variable is quite high.
Thus, the rents vary a lot between the range and are not close to the average rent. From the boxplot in
figure 2.1, it is clear that the data is positively skewed, that is more students stay at places with less
weekly rent. There will be an outlier to the data if any data point lies outside the range ((Q1 – 1.5 * (Q3 –
Q1)), (Q3 + 1.5 * (Q3 – Q1)) = (12.5, 272.5). It has been observed from the data set that there are two
points outside the range. Thus, it can be said that the data has two outliers.
Document Page
5BUS708 STATISTICS AND DATA ANALYTICS
0
20
40
60
80
100
120
140
160
180
200
Boxplot of Weekly Rent
Weekly Rent
Amount (in AUD)
Figure 2.1: Boxplot showing the five-point summary of the variable weekly house rent.
Document Page
6BUS708 STATISTICS AND DATA ANALYTICS
SECTION 3: RENTAL BOND BOARD PROPERTY DATA-DWELLING TYPE
Table 3.1 shows the summary of the dwelling types in the suburbs of Sydney. Figure 3.1 shows
the percentages of students who stay in a flat and a house. It is clear from the summary that most of the
people prefer to stay in flats than houses. Thus, it can be assumed that flats are more affordable to
international students than houses.
Table 3.1: Summary of dwelling type
DwellingType Frequency
Percentage
s
Flat 471 0.942
House 29 0.058
94%
6%
Pie Chart for dwelling
Flat
House
Figure 3.1: Pie chart showing Dwelling Type
To test whether the proportion of house dwelling type is less than 10%, one sample z-test has
been performed. The test results show that the proportion of house dwelling type is less than 10 percent.
tabler-icon-diamond-filled.svg

Paraphrase This Document

Need a fresh take? Get an instant paraphrase of this document with our AI Paraphraser
Document Page
7BUS708 STATISTICS AND DATA ANALYTICS
Table 3.2: z-test for proportion
Hypothesis Test for π
Hypotheses
Null Hypothesis H0: π 10%
Alternative Hypothesis HA: π < 10%
Test Type Lower
Level of significance
alpha α set
to: 0.05
Critical Region
Critical Value
-
1.644
9
Sample Data
Sample Size 500
Count of 'Successes' 29
Sample proportion, p 5.80%
Standard Error 1.34%
z Sample Statistic
-
3.130
5
p-value
0.000
9
Assumptions: n.π=50, n.π=450 MET
Hypothesis test decision:
Reject the Null Hypothesis
It can be seen from the multiple bar graph (figure 3.2) and the contingency table of dwelling type
and suburbs (table 3.3) that the students prefer to stay in the flats than the houses in all the suburbs. The
number of students dwelling in the houses is comparatively negligible than the number of students
dwelling in the flats in all the four selected suburbs.
Document Page
8BUS708 STATISTICS AND DATA ANALYTICS
Table 3.3: Contingency table of dwelling type and suburbs
Count of
DwellingType Column Labels
Row Labels Flat House
Grand
Total
AUBURN 40 14 54
PARRAMATTA 138 9 147
RANDWICK 119 5 124
SYDNEY 174 1 175
Grand Total 471 29 500
Figure 3.2: Multiple bar graph showing comparison of dwelling type in different suburbs
It can be suggested that houses are more available than flats as the preference of the students are
towards residing in the flats. Thus, it will be easier to rent a house for a student in terms of availability.
Document Page
9BUS708 STATISTICS AND DATA ANALYTICS
SECTION 4: RENTAL BOND BOARD PROPERTY DATA-WEEKLY RENT
Table 4.1 shows the weekly rents received by the four different suburbs. It can be seen that most
of the amount collected by weekly rents is Sydney but the number of members residing in Sydney is less
compared to the other suburbs. Thus, it can be said that the price if the flats or houses is very high
compared to the other suburbs.
Table 4.1: Weekly Rent of the four Suburbs
Suburb
Weekly
Rent
AUBURN 11,325
PARRAMATT
A 48,125
RANDWICK 50,305
SYDNEY 57,409
AUBURN PARRAMATTA RANDWICK SYDNEY
0
10,000
20,000
30,000
40,000
50,000
60,000
70,000
Weekly Rent
Weekly rent
Figure 4.1: Weekly rents collected by the suburbs from the sample selected
Considering residential with two bedrooms only, the difference in weekly rents among the four
different suburbs has been tested with the help of analysis of variance (ANOVA) technique. The null
hypothesis (H0) and the alternate hypothesis (H1) in this case has been defined as follows:
tabler-icon-diamond-filled.svg

Paraphrase This Document

Need a fresh take? Get an instant paraphrase of this document with our AI Paraphraser
Document Page
10BUS708 STATISTICS AND DATA ANALYTICS
H0: There is significant differences in the house rents of the suburbs
H1: There is no significant difference in the house rents in the suburbs
The ANOVA test results show that the p-value (0.000) is less than the level of significance
(0.05). Thus, the null hypothesis is accepted. Hence, it can be said that there is significant difference in
the prices of the house rents in the four different Australian suburbs that has been considered in this study.
The clients who are deciding to rent in one of the four selected suburbs can select the suburb of
Parramatta as most of the people reside in that area and the house rent of that region is also very low.
Thus, it can be affordable to all the people and will be convenient too.
Document Page
11BUS708 STATISTICS AND DATA ANALYTICS
SECTION 5: BOND AMOUNT
Figure 5.1 shows the relationship between the variables weekly rent and bond amount. From the
diagram it is clear that there is a very strong relationship between the two variables. Thus, with the
increase in the bond amount, the weekly rent of the apartment or house also increases significantly. The
correlation coefficient is found to be 0.989 which is very strong. Thus, it can be said that there is almost a
perfect linear relationship between bond amount and weekly rent.
A higher bond amount indicates higher weekly rent of the houses or flats. Thus, if a person is
looking for a place cheaper and more budget friendly, then the client should choose a place with low bond
amount.
$500 $1,000 $1,500 $2,000 $2,500 $3,000 $3,500 $4,000 $4,500
$0
$200
$400
$600
$800
$1,000
$1,200
WeeklyRent
Bond Amount
Weekly Rent
Figure 5.1: Relationship between bond amount and weekly rent
Table 5.1: Correlation table of bond amount and weekly rent
Bond Amount Weekly Rent
Bond Amount 1
Weekly Rent 0.988547764 1
chevron_up_icon
1 out of 14
circle_padding
hide_on_mobile
zoom_out_icon
[object Object]