Analysis of Student Social Media Usage: A Data Report

Verified

Added on  2023/01/10

|17
|2703
|30
Report
AI Summary
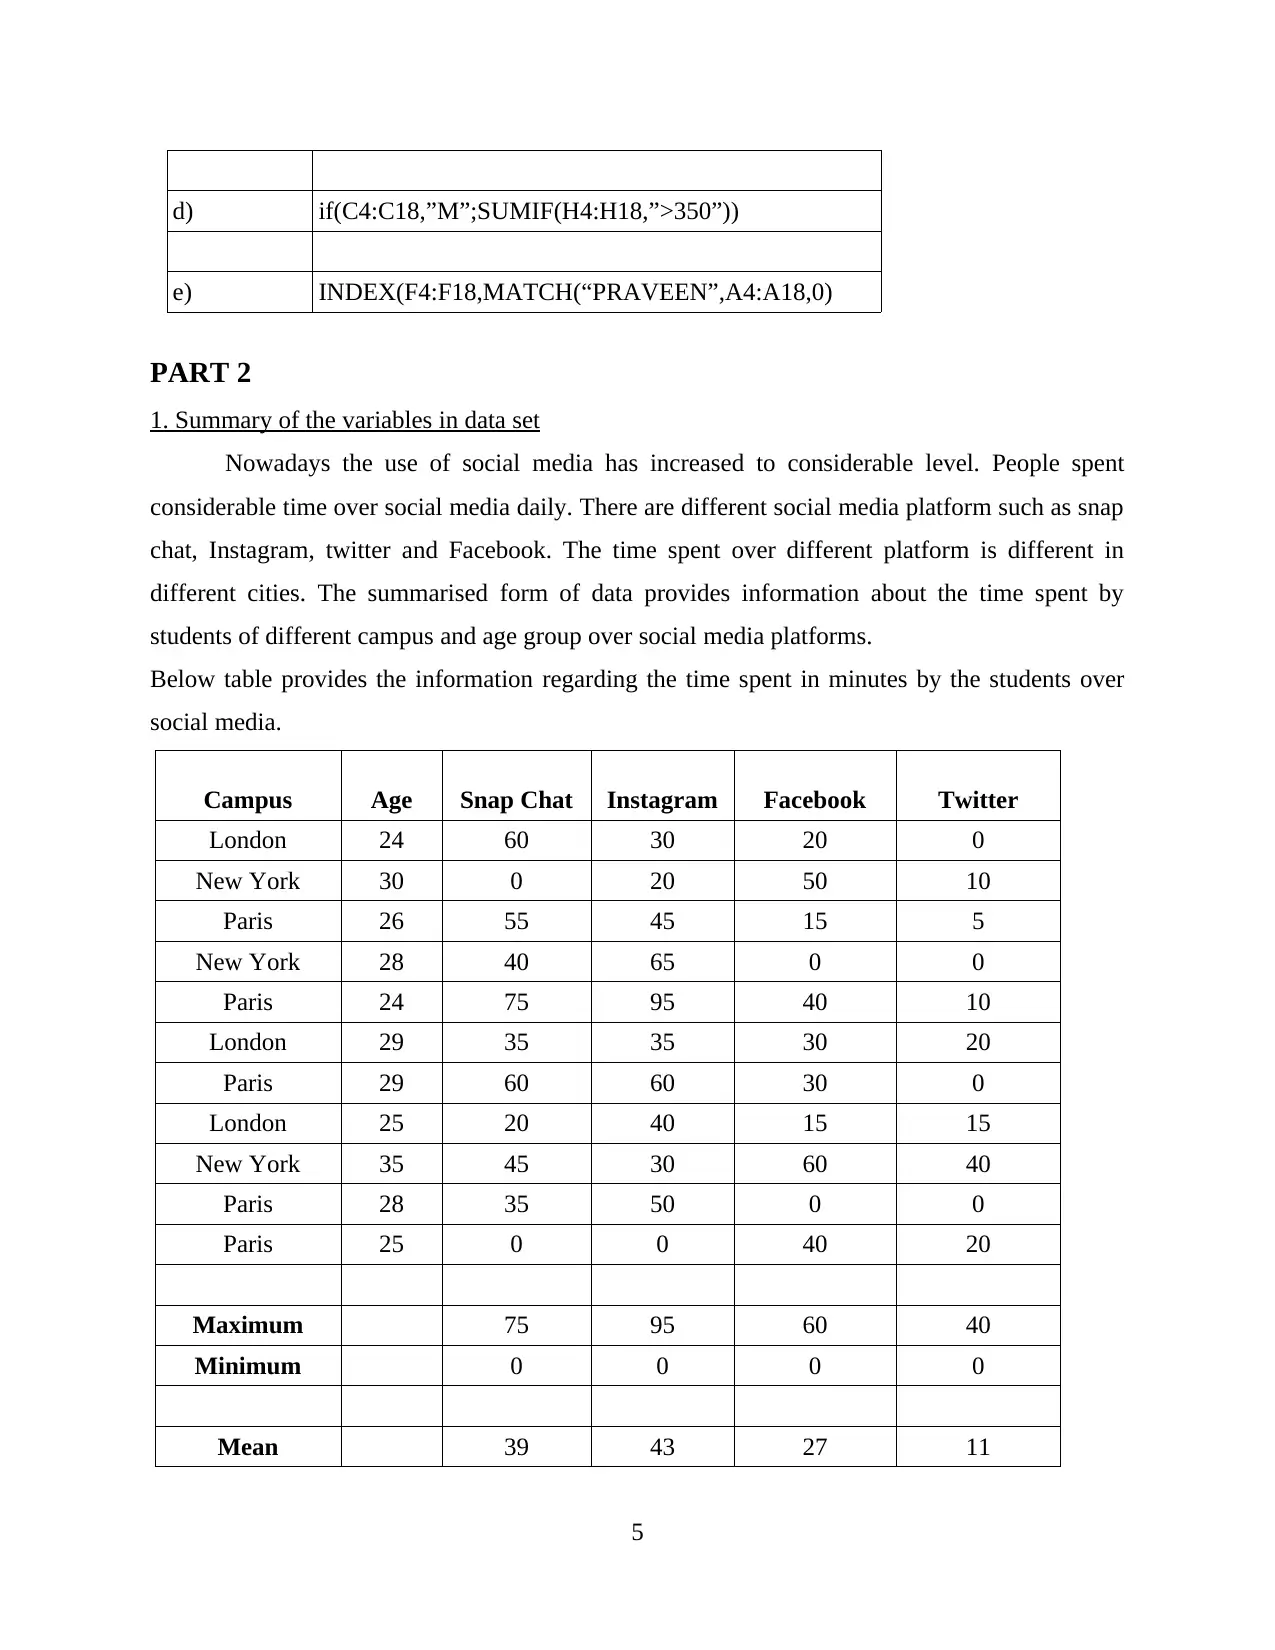
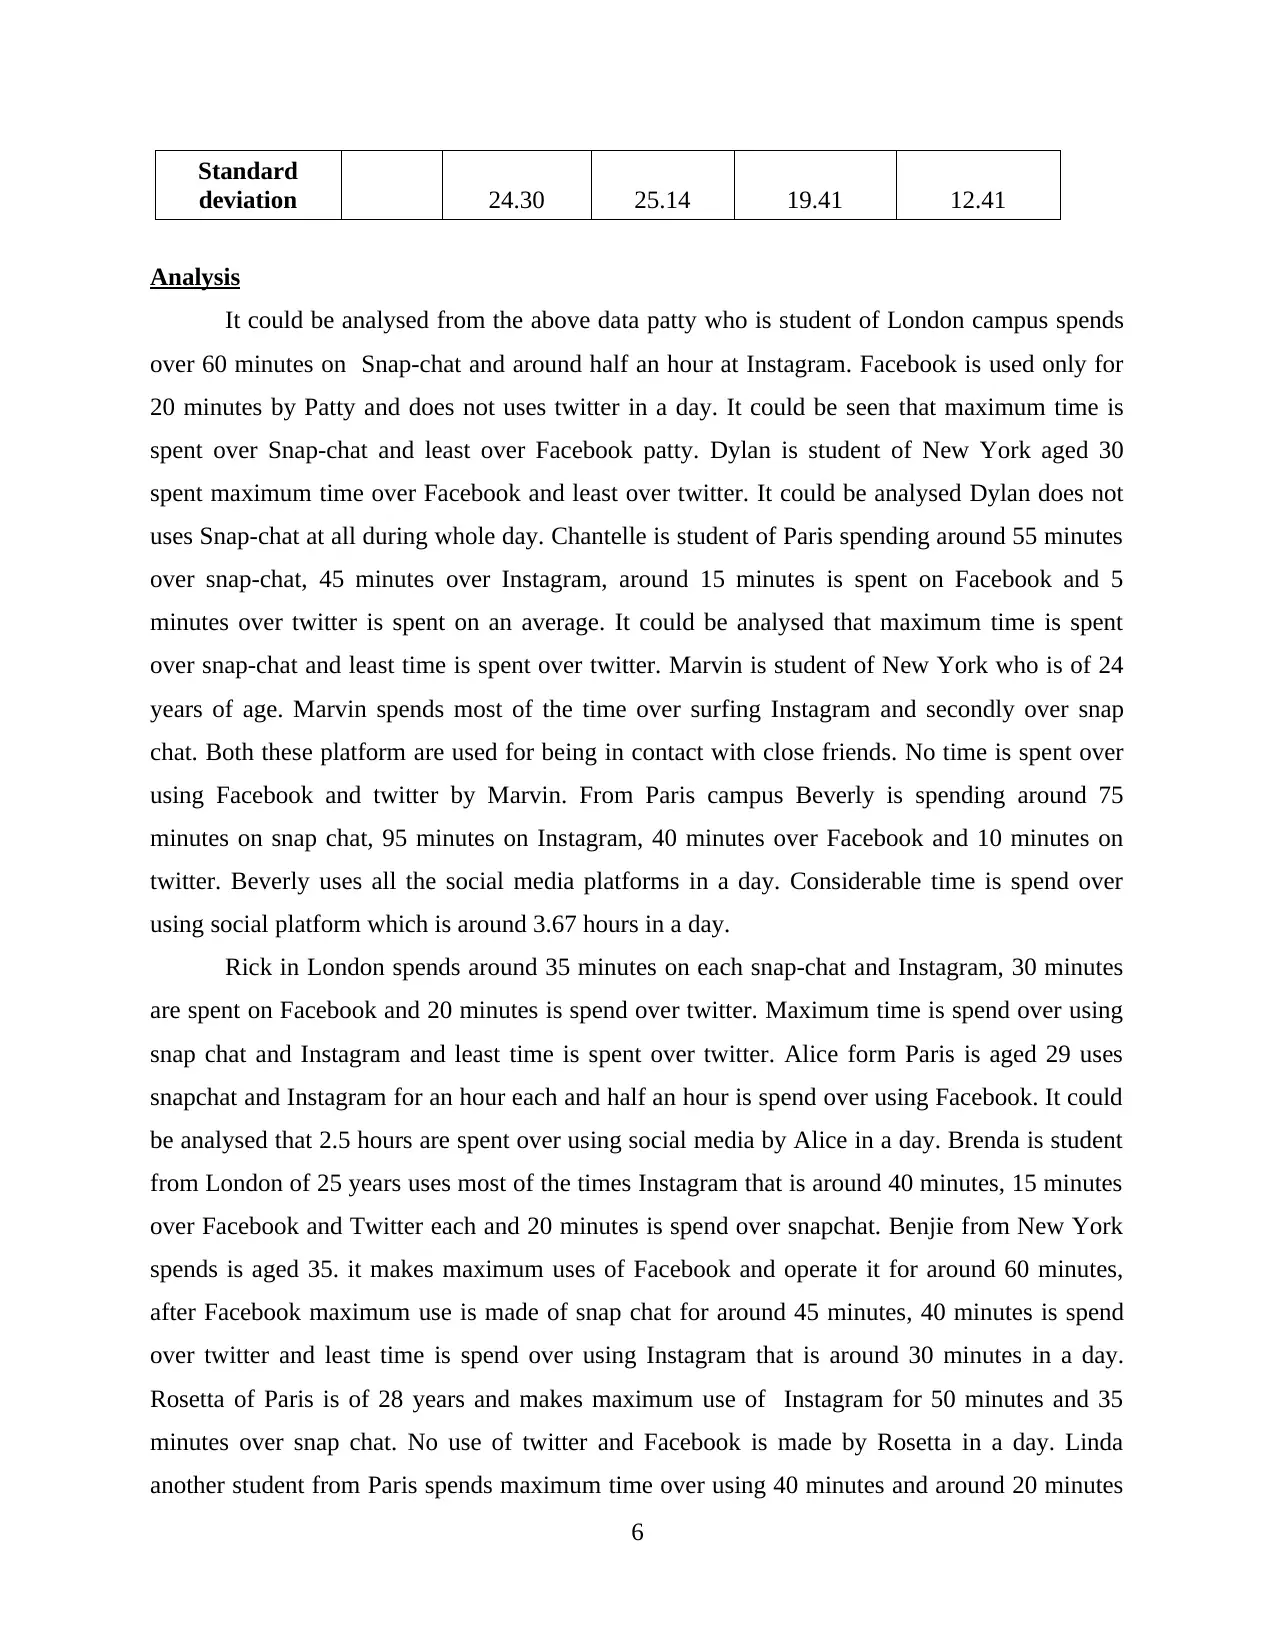
This report presents a comprehensive analysis of student social media usage, examining data from various campuses and age groups. It begins with a summary of the variables, followed by a correlation analysis between Snapchat and Instagram, as well as Instagram and Facebook, using scatter diagrams. The report then provides graphical and numerical summaries to present the data effectively, including mean, standard deviation, and campus-specific breakdowns. Furthermore, it calculates the probability of a student studying in London spending at least two hours on social media. The analysis reveals insights into platform preferences, usage patterns, and correlations between different social media platforms, providing valuable information for understanding student behavior. The report includes detailed calculations, interpretations, and graphical representations to support its findings.
tabler-icon-diamond-filled.svg

Contribute Materials

Your contribution can guide someone’s learning journey. Share your documents today.
Document Page
USING NUMERACY AND
DATA ANALYSIS
tabler-icon-diamond-filled.svg

Secure Best Marks with AI Grader

Need help grading? Try our AI Grader for instant feedback on your assignments.
Document Page
TABLE OF CONTENTS
PART 1............................................................................................................................................1
Section 1.......................................................................................................................................1
Section 2.......................................................................................................................................4
PART 2............................................................................................................................................5
1. Summary of the variables in data set.......................................................................................5
2. Determining correlation between Snapchat and Instagram and between Instagram and
Facebook users using scatter Diagrams. .....................................................................................7
3. Graphical and numerical summaries for presenting the data to others..................................10
4. Probability of student chosen at random studying in London and spending at least 2 hours
on social media..........................................................................................................................13
Document Page
PART 1
Section 1
Question 1
Minutes Hours
20 1/3
36 1 1/2
15 ¼
48 4/5
Question 2
24% of 120 = 28.8
Question 3
a) Fraction Percentage
1/7 15%
3/8 38%
5/9 55%
1 1/2 150%
b)
each student will get 20 pens
Question 4
Total payment 117.6
Aro paid 50.4
Shanti paid 117.6 – 50.4
67.2
Price per ticket 50.4 / 3
1
Document Page
16.8
Tickets bout by
Shanti 67.2 / 16.8
4
Question 5
a) Binary arithmetic
10110 –
111
10110
-111
1111
b) 1 in 310,325
1 ten
thousand
Question 6
a) savings
Discounted rides
(80%) 60
Discount 20%
Total rides 60 / 80%
75
savings 75 – 60
15
b) savings on 8 taxi 15 * 8
120
Question 7
a) Total heights 56
Total numbers 8
2
tabler-icon-diamond-filled.svg

Secure Best Marks with AI Grader

Need help grading? Try our AI Grader for instant feedback on your assignments.
Document Page
Mean 7
b)
Mode = Highest
frequency
Mode = 10
Question 8
Men 120
Women 80
Number
Together 3/5 120
Men 4/5 96
Women 1/5 24
Question 9
Mark Frequency
14 3
15 5
16 5
17 4
18 3
80 20
Mean = 80 / 5
16
Scored < 16 3+5
Students to retest 8
Question 10
3
Document Page
2/5 3/7
0.4 0.43
Lower bigger
Section 2
Question
11
a) F4-G4 H4
AVERAGE(H4:H18) H21
b) Instructions
>Select cell range of surname from excel
>On data tab , in Sort & Filter group
>Click on A-Z
>Surnames will be presented in
alphabetic order
c) IF(E4:E18,”>20”,”YES”,”NO”)
(Data tab > Filter)
>select YES
d) I4 => H4 / F4
>Click on % in home tab
Question 12
a) COUNT(A4:A18)
b) COUNTIF(IF(LEFT(B4:B18,1)="M",1,""))
c) COUNTIF(IF(MID(A4:A18,1)="Y",1,""))
4
Document Page
d) if(C4:C18,”M”;SUMIF(H4:H18,”>350”))
e) INDEX(F4:F18,MATCH(“PRAVEEN”,A4:A18,0)
PART 2
1. Summary of the variables in data set
Nowadays the use of social media has increased to considerable level. People spent
considerable time over social media daily. There are different social media platform such as snap
chat, Instagram, twitter and Facebook. The time spent over different platform is different in
different cities. The summarised form of data provides information about the time spent by
students of different campus and age group over social media platforms.
Below table provides the information regarding the time spent in minutes by the students over
social media.
Campus Age Snap Chat Instagram Facebook Twitter
London 24 60 30 20 0
New York 30 0 20 50 10
Paris 26 55 45 15 5
New York 28 40 65 0 0
Paris 24 75 95 40 10
London 29 35 35 30 20
Paris 29 60 60 30 0
London 25 20 40 15 15
New York 35 45 30 60 40
Paris 28 35 50 0 0
Paris 25 0 0 40 20
Maximum 75 95 60 40
Minimum 0 0 0 0
Mean 39 43 27 11
5
tabler-icon-diamond-filled.svg

Paraphrase This Document

Need a fresh take? Get an instant paraphrase of this document with our AI Paraphraser
Document Page
Standard
deviation 24.30 25.14 19.41 12.41
Analysis
It could be analysed from the above data patty who is student of London campus spends
over 60 minutes on Snap-chat and around half an hour at Instagram. Facebook is used only for
20 minutes by Patty and does not uses twitter in a day. It could be seen that maximum time is
spent over Snap-chat and least over Facebook patty. Dylan is student of New York aged 30
spent maximum time over Facebook and least over twitter. It could be analysed Dylan does not
uses Snap-chat at all during whole day. Chantelle is student of Paris spending around 55 minutes
over snap-chat, 45 minutes over Instagram, around 15 minutes is spent on Facebook and 5
minutes over twitter is spent on an average. It could be analysed that maximum time is spent
over snap-chat and least time is spent over twitter. Marvin is student of New York who is of 24
years of age. Marvin spends most of the time over surfing Instagram and secondly over snap
chat. Both these platform are used for being in contact with close friends. No time is spent over
using Facebook and twitter by Marvin. From Paris campus Beverly is spending around 75
minutes on snap chat, 95 minutes on Instagram, 40 minutes over Facebook and 10 minutes on
twitter. Beverly uses all the social media platforms in a day. Considerable time is spend over
using social platform which is around 3.67 hours in a day.
Rick in London spends around 35 minutes on each snap-chat and Instagram, 30 minutes
are spent on Facebook and 20 minutes is spend over twitter. Maximum time is spend over using
snap chat and Instagram and least time is spent over twitter. Alice form Paris is aged 29 uses
snapchat and Instagram for an hour each and half an hour is spend over using Facebook. It could
be analysed that 2.5 hours are spent over using social media by Alice in a day. Brenda is student
from London of 25 years uses most of the times Instagram that is around 40 minutes, 15 minutes
over Facebook and Twitter each and 20 minutes is spend over snapchat. Benjie from New York
spends is aged 35. it makes maximum uses of Facebook and operate it for around 60 minutes,
after Facebook maximum use is made of snap chat for around 45 minutes, 40 minutes is spend
over twitter and least time is spend over using Instagram that is around 30 minutes in a day.
Rosetta of Paris is of 28 years and makes maximum use of Instagram for 50 minutes and 35
minutes over snap chat. No use of twitter and Facebook is made by Rosetta in a day. Linda
another student from Paris spends maximum time over using 40 minutes and around 20 minutes
6
Document Page
on twitter. Age of Linda is 25 years and no use is made of snap chat and Instagram during whole
day.
Maximum use of the snap chat is 75 minutes which is student from Paris named Beverly.
On the other there are also students that do not use snap chat at all. Maximum use of the
Instagram is made by Beverly from Paris that is 95 minutes. There is only one student that does
not uses Instagram from all the campuses. It is identified that the maximum use of facebook is of
60 minutes which is by Benjie from New York. The least use of Facebook is zero minutes which
shows that there are students who do not use Facebook in the whole day. Over twitter maximum
time spend is 40 minutes and that is also used by Benjie. Twitter is very less used by the students
and there many student who do not uses twitter in a whole day.
Mean refers to the average of values in a given data set. Using mean average use of the
different social media platform could be measured. In the present case average use of the social
media could be identified where students on an average spends around 39 minutes on snapchat,
around 43 minutes over Instagram, 27 minutes over Facebook and 11 minutes over twitter. It is
identified students on average makes maximum use of Instagram and least use of twitter.
Standard deviation is used for measuring the deviation or variation from mean values.
From lower standard deviation it could be identified that values are closer to mean values and
higher standard deviation shows higher dispersion from the mean values. The method is used for
measuring confidence in the statistical conclusions. In the above data highest deviation is seen in
results of Instagram and Snapchat and lowest deviation is seen in results from twitter. The mean
values of twitter are most accurate as compared with other data.
2. Determining correlation between Snapchat and Instagram and between Instagram and
Facebook users using scatter Diagrams.
Correlation between Snapchat and Instagram
Scatter Diagram
7
Document Page
x y x-x̅ (x-x̅)^2 y-ȳ (y-ȳ)^2
r= (x-
x̅)*(y-ȳ)
Snap
Chat Instagram
Patty 60 30 21.36 456.40 -12.73 161.98 -271.90
Dylan 0 20 -38.64 1492.77 -22.73 516.53 878.10
Chantelle 55 45 16.36 267.77 2.27 5.17 37.19
Marvin 40 65 1.36 1.86 22.27 496.07 30.37
Beverley 75 95 36.36 1322.31 52.27 2732.44 1900.83
Rick 35 35 -3.64 13.22 -7.73 59.71 28.10
Alice 60 60 21.36 456.40 17.27 298.35 369.01
Brenda 20 40 -18.64 347.31 -2.73 7.44 50.83
Benjie 45 30 6.36 40.50 -12.73 161.98 -80.99
Rosetta 35 50 -3.64 13.22 7.27 52.89 -26.45
Linda 0 0 -38.64 1492.77 -42.73 1825.62 1650.83
38.6 42.7 536.8 574.4 415.1
8
0 2 4 6 8 10 12
0
10
20
30
40
50
60
70
80
90
100
Scatter Diagram
Facebook
Instagram
tabler-icon-diamond-filled.svg

Secure Best Marks with AI Grader

Need help grading? Try our AI Grader for instant feedback on your assignments.
Document Page
Std deviation (x)
√536.8 23.17
Std deviation (y) √574.4 23.97
r=
415 /
(23.17*23.97) 0.75
Analysis
It could be evaluated from the above table that the correlation between Snap chat and
Instagram is positive. Correlation between both the social platform is 0.75. It represents strong
positive correlation between the use of Instagram and snap chat by the students. While
interpreting correlation it is essential that the correlation is not the causation. This could be
interpreted that the users who use snap chat spends considerable time over Instagram also.
Correlation between Facebook and Instagram
Scatter Diagram
x y x-x̅ (x-x̅)^2 y-ȳ (y-ȳ)^2
r= (x-
x̅)*(y-ȳ)
Facebook Instagram
9
0 2 4 6 8 10 12
0
10
20
30
40
50
60
70
80
90
100
Scatter Diagram
Facebook
Instagram
Document Page
Patty 20 30 -7.27 52.89 -12.73 161.98 92.56
Dylan 50 20 22.73 516.53 -22.73 516.53 -516.53
Chantelle 15 45 -12.27 150.62 2.27 5.17 -27.89
Marvin 0 65 -27.27 743.80 22.27 496.07 -607.44
Beverley 40 95 12.73 161.98 52.27 2732.44 665.29
Rick 30 35 2.73 7.44 -7.73 59.71 -21.07
Alice 30 60 2.73 7.44 17.27 298.35 47.11
Brenda 15 40 -12.27 150.62 -2.73 7.44 33.47
Benjie 60 30 32.73 1071.07 -12.73 161.98 -416.53
Rosetta 0 50 -27.27 743.80 7.27 52.89 -198.35
Linda 40 0 12.73 161.98 -42.73 1825.62 -543.80
27.3 42.7 342.6 574.4 -135.7
Std deviation (x)
√342.6 18.51
Std deviation (y)
√574.4 23.97
r=
[- 135 /
(18.51*23.97)] -0.31
Analysis
It could be analysed from the correlation between Instagram and Facebook is negative.
Correlation between the use of two social media platforms is -0.31. It represents strongly
negative correlation between Instagram and Facebook. It could be evaluated from the correlation
if the student uses Instagram there are very less chances that student also uses Facebook. Higher
the use of Instagram lower the use of Facebook.
3. Graphical and numerical summaries for presenting the data to others.
Measuring use of data in campuses separately.
London Campus
Name Campus Age
Snap
Chat
Instagra
m Facebook Twitter
Total
Hours
Patty London 24 60 30 20 0 1.83
10
Document Page
Rick London 29 35 35 30 20 2.00
Brenda London 25 20 40 15 15 1.50
Maximu
m 60 40 30 20
Minimum 20 30 15 0
Mean 38.3 35.0 21.7 11.7 1.8
Standard
deviation 20.21 5.00 7.64 10.41
Analysis
It could be seen that in London students spend maximum time over using snap chat. A
students spends at least 1 and a half hour using social platforms. Standard deviation of Snap chat
users is highest.
New York Campus
Name Campus Age
Snap
Chat
Instagra
m Facebook Twitter
Total
Hours
Dylan New York 30 0 20 50 10 1.33
Marvin New York 28 40 65 0 0 1.75
Benjie New York 35 45 30 60 40 2.92
Maximu
m 45 65 60 40
Minimum 0 20 0 0
Mean 28.3 38.3 36.7 16.7 2
Standard
deviation 24.66 23.63 32.15 20.82
Analysis
The analysis shows that maximum time of the students is spend over Instagram and
Facebook after that. There is equivalent use of snap chat and twitter by users. It could be
evaluated from the above information around 2 hours are spend on average over social platforms.
11
tabler-icon-diamond-filled.svg

Paraphrase This Document

Need a fresh take? Get an instant paraphrase of this document with our AI Paraphraser
Document Page
Paris Campus
Name Campus Age
Snap
Chat
Instagra
m Facebook Twitter
Total
Hours
Chantelle Paris 26 55 45 15 5 2.00
Beverley Paris 24 75 95 40 10 3.67
Alice Paris 29 60 60 30 0 2.50
Rosetta Paris 28 35 50 0 0 1.42
Linda Paris 25 0 0 40 20 1.00
Maximu
m 75 95 40 20
Minimum 0 0 0 0
Mean 45 50 25 7 2.1
Standard
deviation 28.94 34.1 17.32 8.37
Analysis
Students mainly use Instagram and snapchat in Paris. There is least use of twitter by the
students of Paris. There is highest variation in results of snapchat and on average students spend
around 2.1 hours over social media.
Graphical representation of the use of social media by different campuses.
Campus Snap Chat Instagram Facebook Twitter
London 60 30 20 0
New York 0 20 50 10
Paris 55 45 15 5
New York 40 65 0 0
Paris 75 95 40 10
London 35 35 30 20
Paris 60 60 30 0
London 20 40 15 15
New York 45 30 60 40
Paris 35 50 0 0
12
Document Page
Paris 0 0 40 20
4. Probability of student chosen at random studying in London and spending at least 2 hours on
social media
Probability Calculation
Name Campus Snap Chat Instagram Facebook Twitter
Total
hours
Patty London 60 30 20 0 1.83
Dylan New York 0 20 50 10 1.33
Chantelle Paris 55 45 15 5 2.00
Marvin New York 40 65 0 0 1.75
Beverley Paris 75 95 40 10 3.67
Rick London 35 35 30 20 2.00
Alice Paris 60 60 30 0 2.50
Brenda London 20 40 15 15 1.50
Benjie New York 45 30 60 40 2.92
Rosetta Paris 35 50 0 0 1.42
Linda Paris 0 0 40 20 1.00
13
London
New York
Paris
Patty Rick Brenda Dylan Marvi
n
Benjie Chan
telle
Beve
rley
Alice Rose
tta
Linda
0
10
20
30
40
50
60
70
80
90
100
Snap Chat
Instagram
Facebook
Twitter
Document Page
Probability of
being from
london (3/11) 0.27
Probability of
spending over 2
hours (1/3) 0.33
Probability (0.27*0.33) 9.09%
Analysis
It could be evaluated that the probability of a random student being from London and
using the social media is 9.09%. The probability is very low of the events. In this dependent
variable is time spend and independent variable is Y
14
tabler-icon-diamond-filled.svg

Secure Best Marks with AI Grader

Need help grading? Try our AI Grader for instant feedback on your assignments.
Document Page
15
chevron_up_icon
1 out of 17
circle_padding
hide_on_mobile
zoom_out_icon
logo.png

Your All-in-One AI-Powered Toolkit for Academic Success.

Available 24*7 on WhatsApp / Email

[object Object]