Analysis of UKCBC Student Survey for Business Decision Making Report
VerifiedAdded on 2020/10/22
|23
|5015
|50
Report
AI Summary
This report details a student-led survey conducted at UKCBC to gather data on student preferences and satisfaction, aiming to inform business decision-making. The report encompasses various stages, starting with data collection methods, including primary and secondary sources, and the creation of a questionnaire. The analysis involves calculating mean, median, and mode, along with the use of charts and trend lines to visualize the survey results. The study also explores sampling methodologies, such as random sampling, and the application of statistical tools like quartiles, percentiles, and correlation coefficients. Finally, the report provides a critical examination of data processing tools, including a Gantt chart, and the utilization of financial tools for decision-making, culminating in a final report for the QAA committee.
Business Decision
Making
Making
Paraphrase This Document
Need a fresh take? Get an instant paraphrase of this document with our AI Paraphraser
Table of Contents
INTRODUCTION...........................................................................................................................1
TASK 1............................................................................................................................................1
1.1 Data collection from different student across.......................................................................1
1.2 Survey methodology and sampling framework used............................................................2
1.3 Questionnaire for collecting the data....................................................................................3
TASK2.............................................................................................................................................5
2.1 Investigation of data collection that are gather from research work.....................................5
2.2 Analyse the result of Survey.................................................................................................7
2.3 Analysis through measure of dispersion...............................................................................8
2.4 Use quartiles, percentiles and the correlation coefficient.....................................................8
TASK 3 ...........................................................................................................................................9
3.1 Various charts and digram to show the result. .....................................................................9
3.2 Trends lines analysis...........................................................................................................14
3.3 presentation.........................................................................................................................15
3.4 Final report to QAA committee..........................................................................................18
TASK 4..........................................................................................................................................19
4.1 Appropriate information processing tools. .........................................................................19
4.2: Critical way examine and Gantt chart................................................................................20
4.3 Utilisation of financial tool for decision making................................................................21
CONCLUSION..............................................................................................................................22
REFERECNCE .............................................................................................................................23

⊘ This is a preview!⊘
Do you want full access?
Subscribe today to unlock all pages.
Trusted by 1+ million students worldwide
INTRODUCTION
In today world, every business wants to grow and expand at globe level and this can be
only happen by making effective decision. It is observed that whole business is depend on right
decision of entrepreneur, that help in performing business activity for achieving predefined
goals. Under this report, as a leader of student group in UK collage of business and computing a
plan is structure from a basic survey from different student (Bayne and Woolcock, 2011). The
information is collected from various sources and summit the report to QAA team that will
review the data about student preference.
In this report, different tasks are covered, that are linked with functional unit of business
decision making related to UKCBC. Survey research is conducted from various sources about
the collages the determine the reviews of student and other member and their satisfaction level.
Report shows different calculation of mean median and mode with the use of graphs. At last it
shows NPV and critical path that help in ascertaining the minimum time needed to perform a
task.
TASK 1
1.1 Data collection from different student across.
To do a proper research it is very important to include all relevant factor and consider the
most dependable investigation. It is very important for researcher to involve every facts and
number that are related to the research and gives the best result at present time. In research,
different information in gathered from various sources including campuses of college from
young students etc. with the help of different data collection process. Primary and secondary
sources through which relevant data is collected and analysed that is described below:
Primary sources: This sources are referred to be the first information collected directly from the
clients. Gradually, research itself collect the information that is free from any false statement and
this data is commonly real time data. This collected information is basically based on
experience and observation of researcher itself. Some of the basic aspect of primary sources that
are explained below:
Interview: This process is related to an effective interaction with an individual to
determine the actual result. The outcome are different as every student in college have
different set of mind and preference toward facilities and services.
1
Paraphrase This Document
Need a fresh take? Get an instant paraphrase of this document with our AI Paraphraser
Questionnaire: This is related to multiple choice question that is been asked to different
student. It is an effective research technique that help in getting most appropriate result.
Secondary source: According to this data source the previously collected data is used by the
researcher for determining result (Goodwin and Wright, 2014). This data set is basically used
for making comparison of actual data from the past data that is used in college. The different
secondary sources of collecting data are published statement, journals and article etc.
A plan for collecting data is one of the most significant approach, as it help in gathering
and measuring the various sources of data in order to get best result. The plan has the following
structure that is to be followed while doing research:
Too narrow: Under this method only answers are in Yes or No format.
Too broad: This technique requires lot of time and it is not easy to have a lengthy paper
discussion.
Too simple: This can be done by researcher without making unique collection of data.
To conduct a research there are certain basic principle that are to be consider while
making question:
Authentic: The real aspect is taken into consideration so that question must be real and
deliberate.
Outlook: It is related to the knowledge of the individual from whom the question are
already asked.
It is clear that primary source of data is more useful for conducting a study as it will gives
the new and unique ideas and reviews about UKCBC. Similarly, secondary data is already
available with the management that helps them in making comparison with the primary data
collected presently. Researcher collect data by asking various question and taking interviews
from different students and other staff member from UKCBC college. The data is collected from
60 respondent from college. It is collected from those individuals who are helpful in giving exact
information about college.
1.2 Survey methodology and sampling framework used.
In respect to make effective research, the researcher is responsible to make an effective
decision and need to figure out the important factor from the research. A survey is consider to be
a method for asking question from different people that help in getting a most reliable result. In
this survey is conducted upon different student about their experience and satisfaction regarding
2
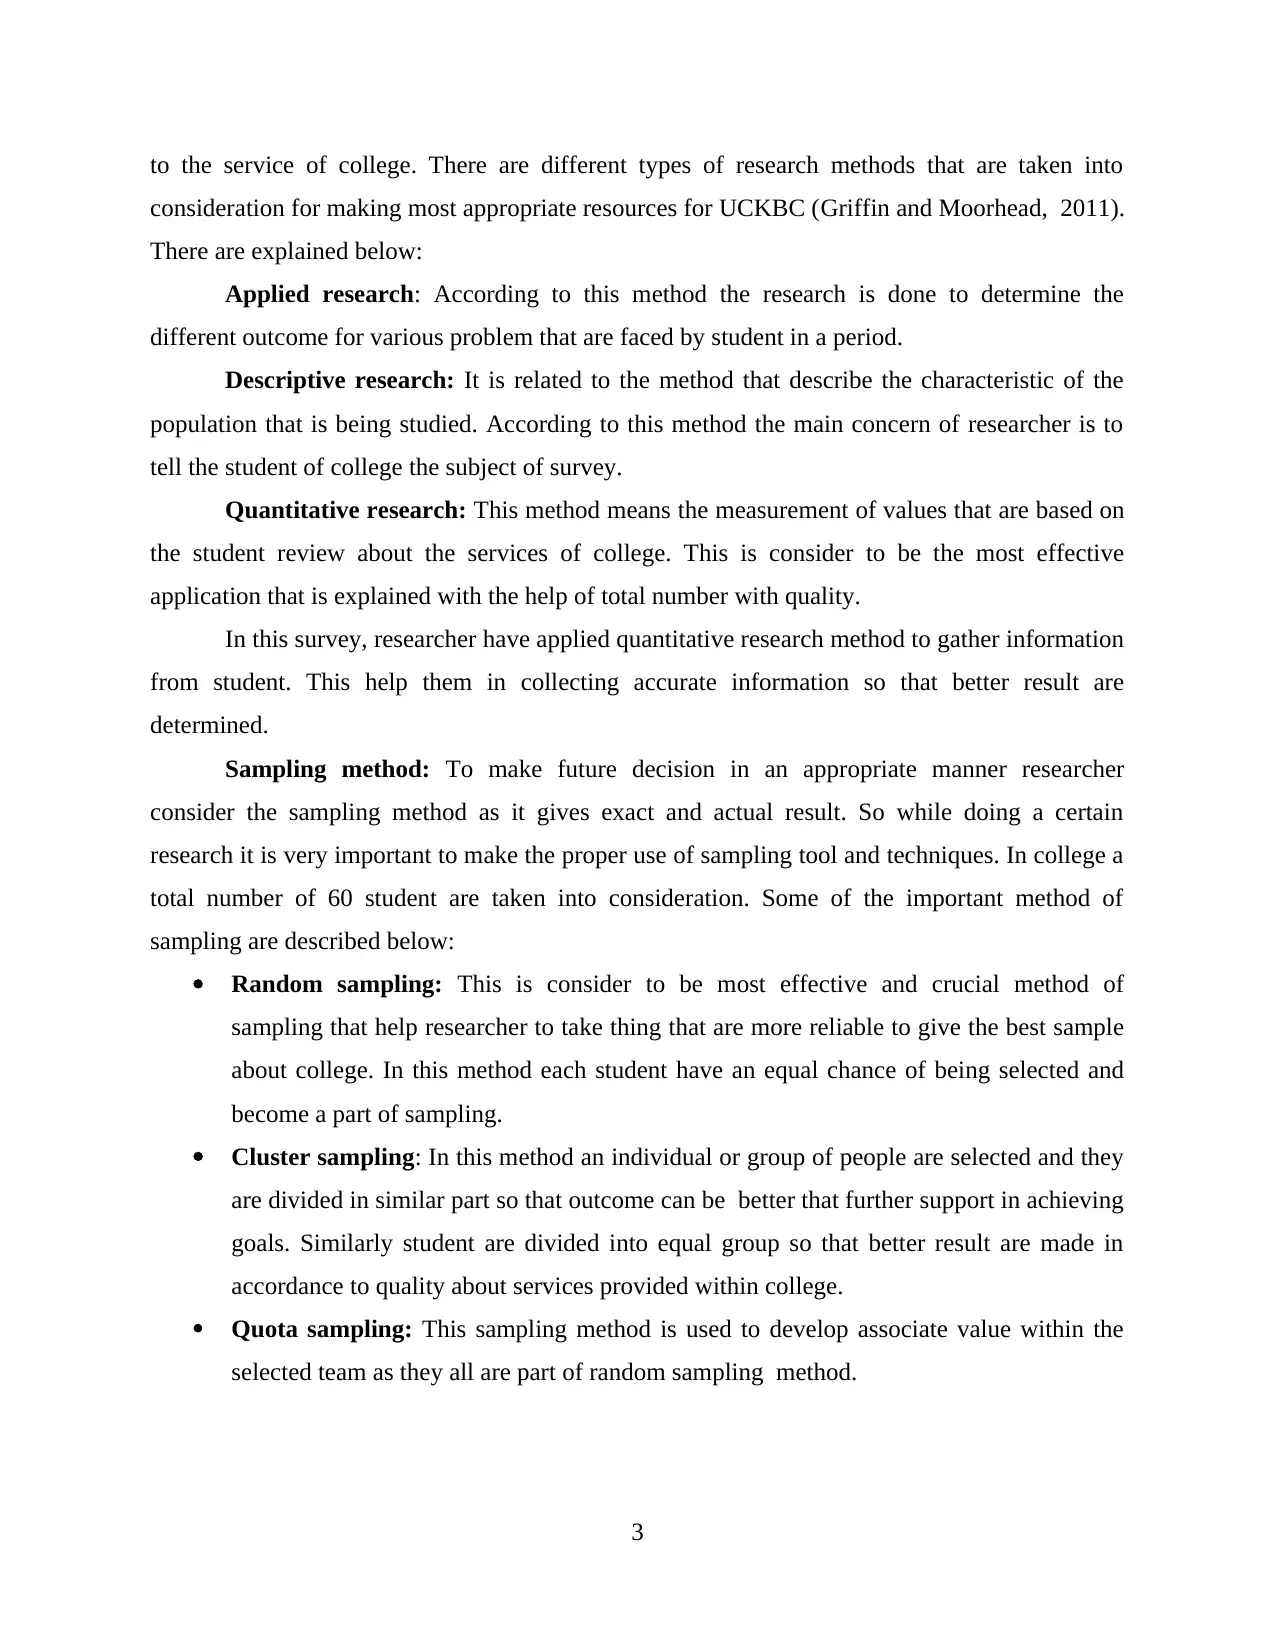
to the service of college. There are different types of research methods that are taken into
consideration for making most appropriate resources for UCKBC (Griffin and Moorhead, 2011).
There are explained below:
Applied research: According to this method the research is done to determine the
different outcome for various problem that are faced by student in a period.
Descriptive research: It is related to the method that describe the characteristic of the
population that is being studied. According to this method the main concern of researcher is to
tell the student of college the subject of survey.
Quantitative research: This method means the measurement of values that are based on
the student review about the services of college. This is consider to be the most effective
application that is explained with the help of total number with quality.
In this survey, researcher have applied quantitative research method to gather information
from student. This help them in collecting accurate information so that better result are
determined.
Sampling method: To make future decision in an appropriate manner researcher
consider the sampling method as it gives exact and actual result. So while doing a certain
research it is very important to make the proper use of sampling tool and techniques. In college a
total number of 60 student are taken into consideration. Some of the important method of
sampling are described below:
Random sampling: This is consider to be most effective and crucial method of
sampling that help researcher to take thing that are more reliable to give the best sample
about college. In this method each student have an equal chance of being selected and
become a part of sampling.
Cluster sampling: In this method an individual or group of people are selected and they
are divided in similar part so that outcome can be better that further support in achieving
goals. Similarly student are divided into equal group so that better result are made in
accordance to quality about services provided within college.
Quota sampling: This sampling method is used to develop associate value within the
selected team as they all are part of random sampling method.
3
⊘ This is a preview!⊘
Do you want full access?
Subscribe today to unlock all pages.
Trusted by 1+ million students worldwide
From the above mention sampling method researcher have applied, random sampling
approach to complete the survey. They select different student from different streams of UKCBC
in order to ascertain their satisfaction level from college services.
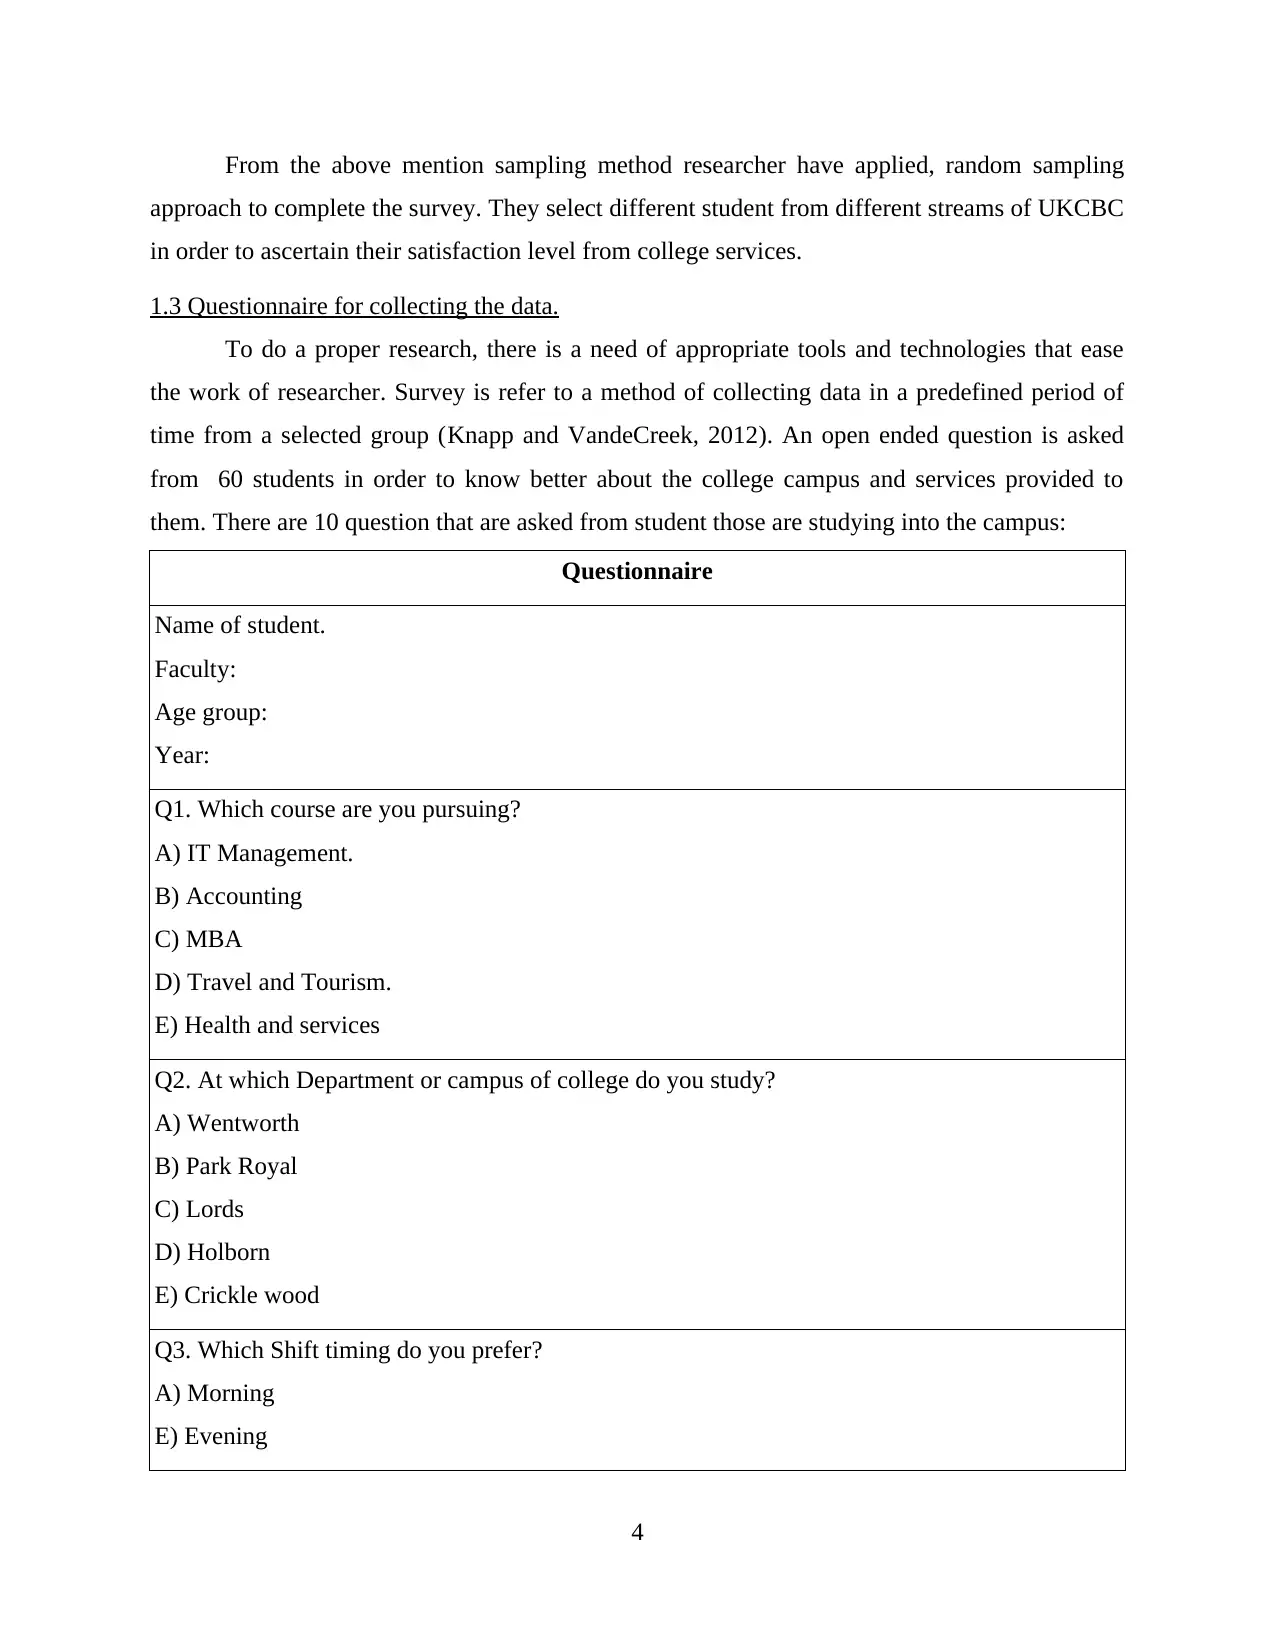
1.3 Questionnaire for collecting the data.
To do a proper research, there is a need of appropriate tools and technologies that ease
the work of researcher. Survey is refer to a method of collecting data in a predefined period of
time from a selected group (Knapp and VandeCreek, 2012). An open ended question is asked
from 60 students in order to know better about the college campus and services provided to
them. There are 10 question that are asked from student those are studying into the campus:
Questionnaire
Name of student.
Faculty:
Age group:
Year:
Q1. Which course are you pursuing?
A) IT Management.
B) Accounting
C) MBA
D) Travel and Tourism.
E) Health and services
Q2. At which Department or campus of college do you study?
A) Wentworth
B) Park Royal
C) Lords
D) Holborn
E) Crickle wood
Q3. Which Shift timing do you prefer?
A) Morning
E) Evening
4
approach to complete the survey. They select different student from different streams of UKCBC
in order to ascertain their satisfaction level from college services.
1.3 Questionnaire for collecting the data.
To do a proper research, there is a need of appropriate tools and technologies that ease
the work of researcher. Survey is refer to a method of collecting data in a predefined period of
time from a selected group (Knapp and VandeCreek, 2012). An open ended question is asked
from 60 students in order to know better about the college campus and services provided to
them. There are 10 question that are asked from student those are studying into the campus:
Questionnaire
Name of student.
Faculty:
Age group:
Year:
Q1. Which course are you pursuing?
A) IT Management.
B) Accounting
C) MBA
D) Travel and Tourism.
E) Health and services
Q2. At which Department or campus of college do you study?
A) Wentworth
B) Park Royal
C) Lords
D) Holborn
E) Crickle wood
Q3. Which Shift timing do you prefer?
A) Morning
E) Evening
4
Paraphrase This Document
Need a fresh take? Get an instant paraphrase of this document with our AI Paraphraser
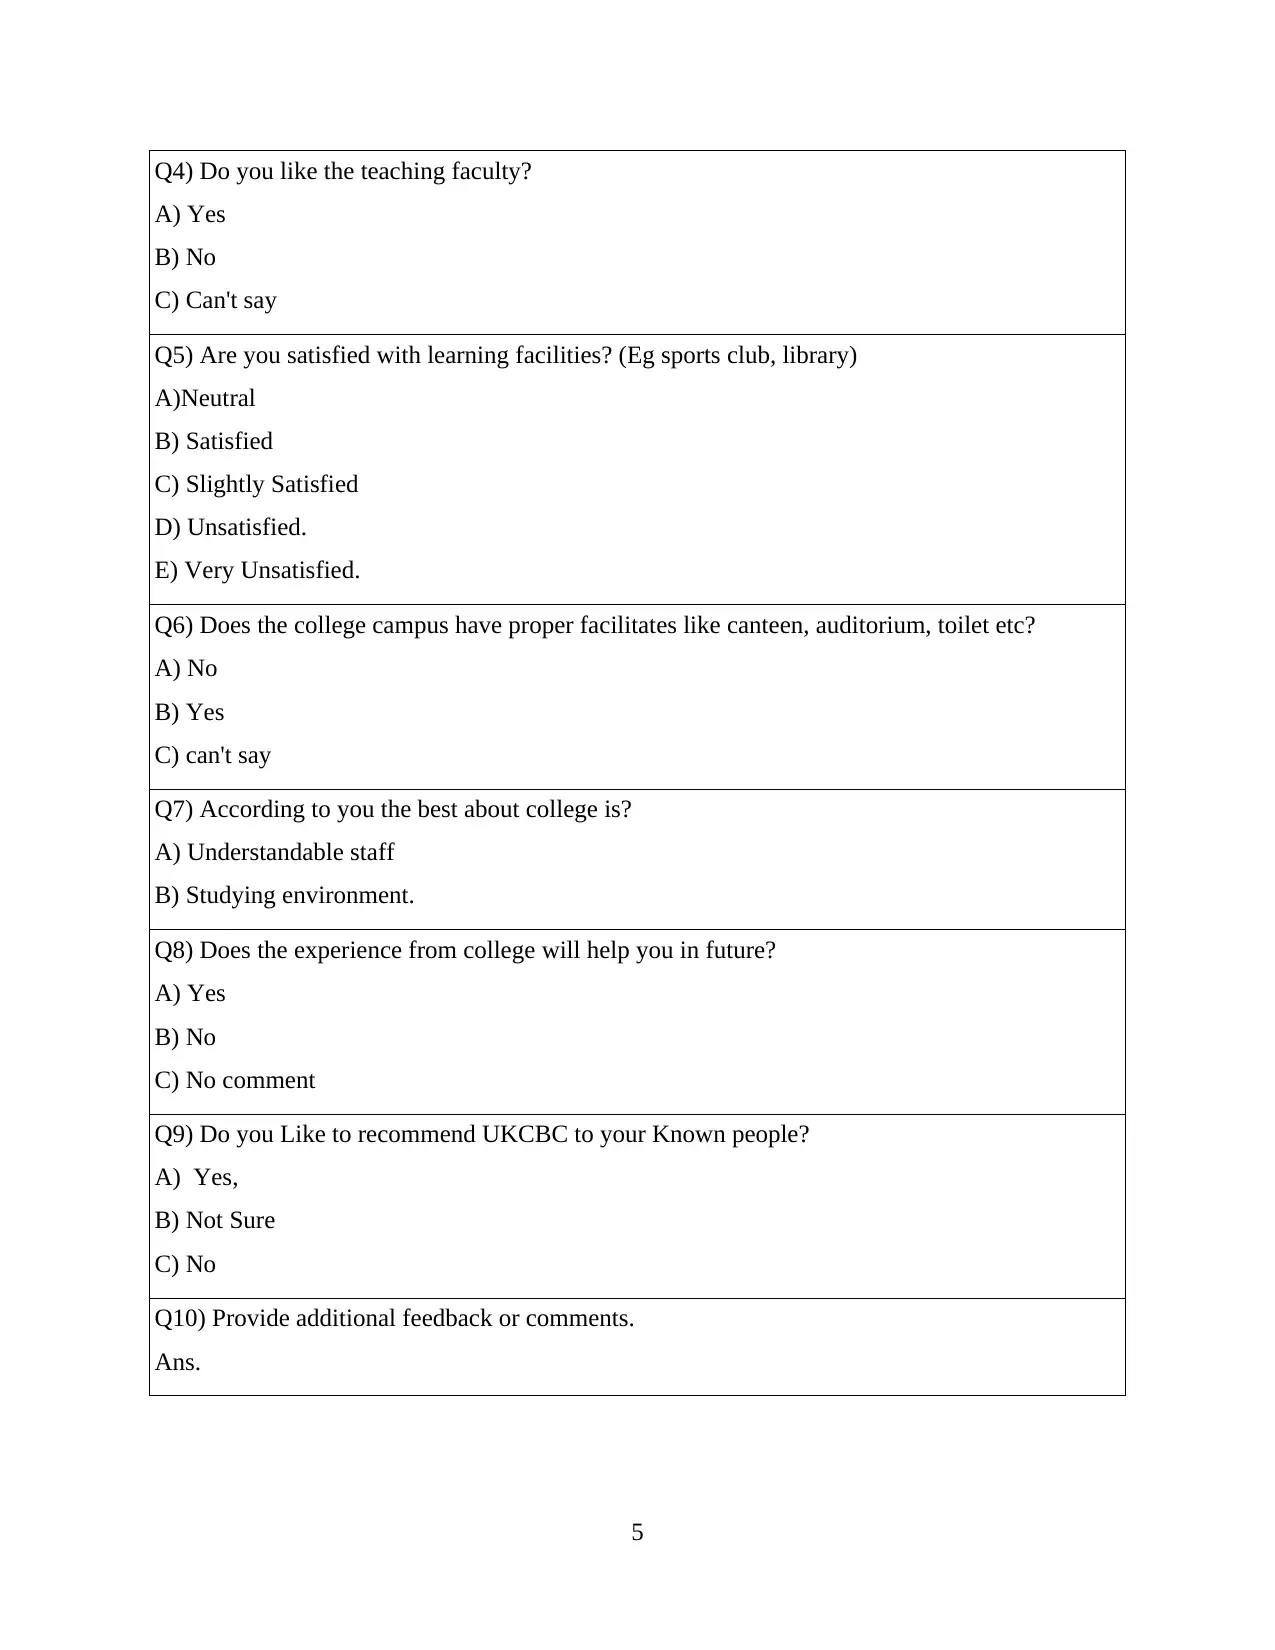
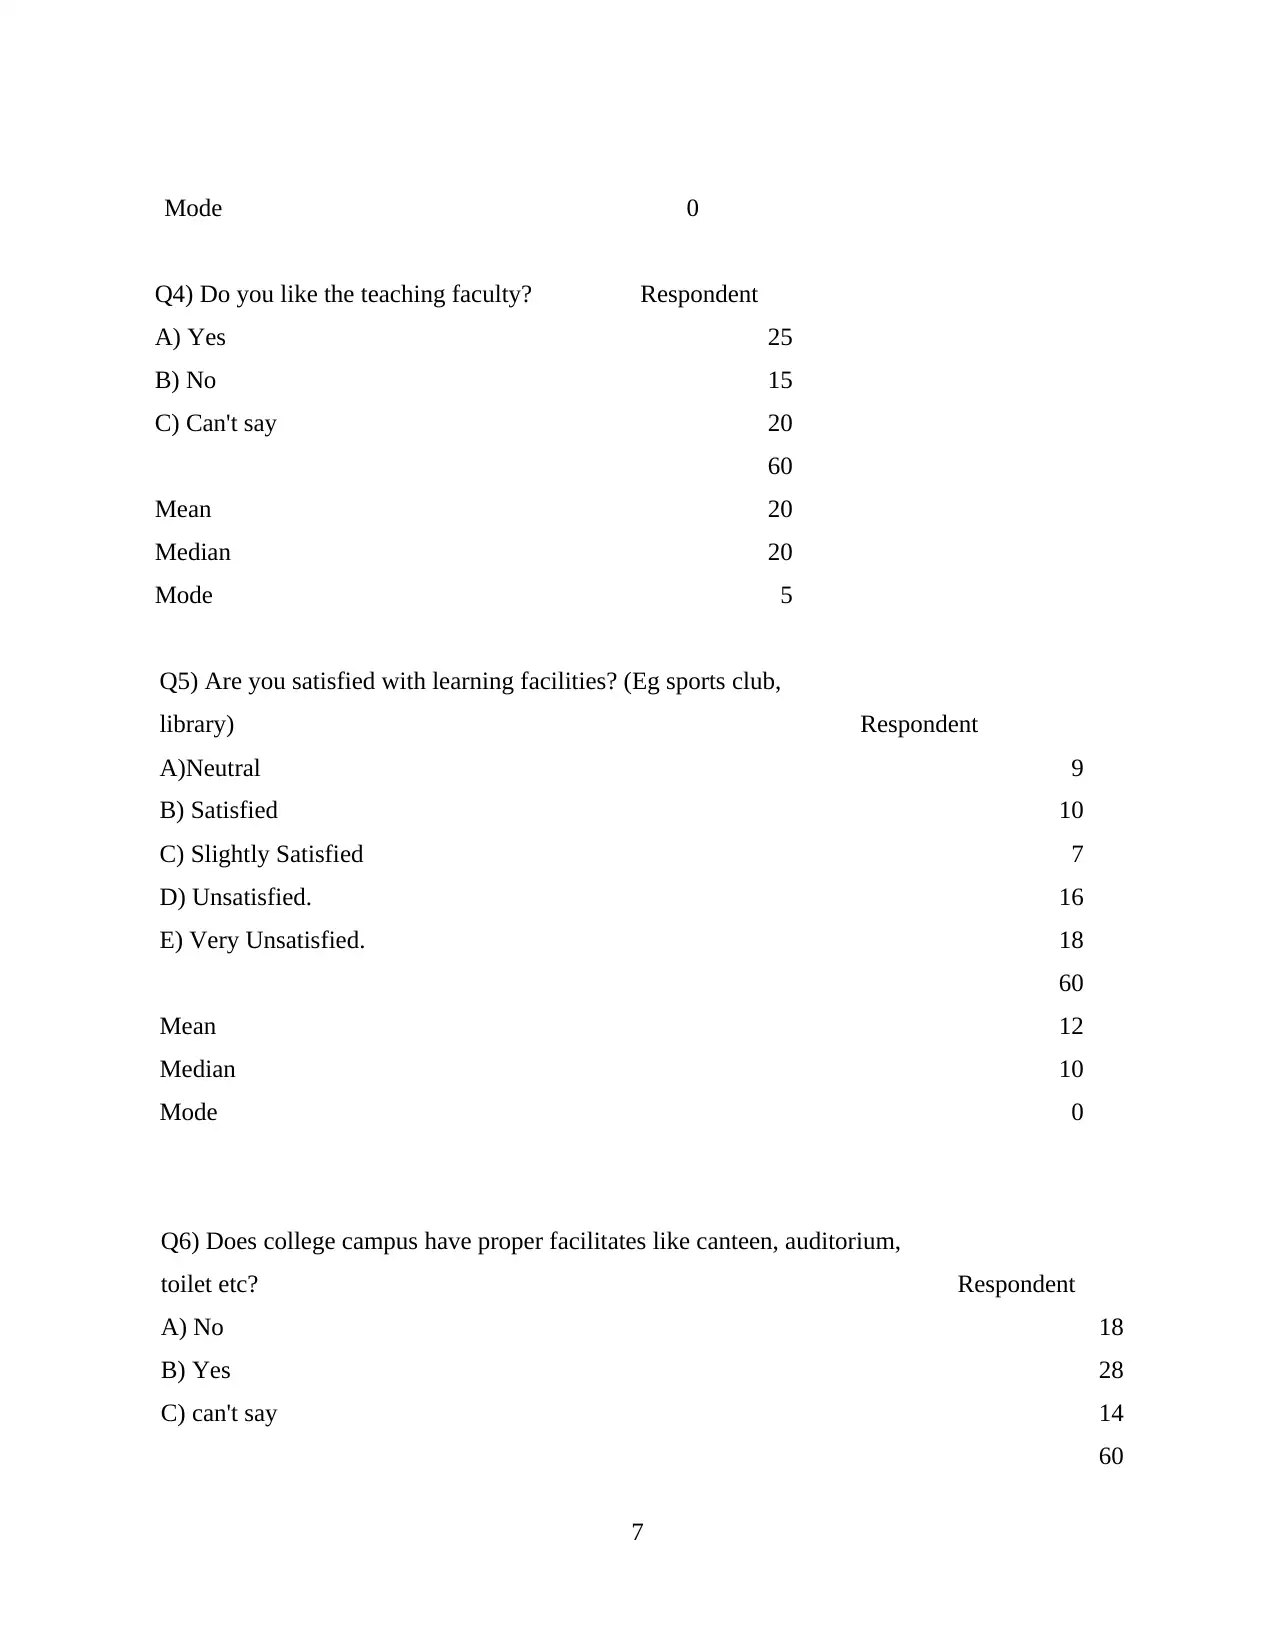
Q4) Do you like the teaching faculty?
A) Yes
B) No
C) Can't say
Q5) Are you satisfied with learning facilities? (Eg sports club, library)
A)Neutral
B) Satisfied
C) Slightly Satisfied
D) Unsatisfied.
E) Very Unsatisfied.
Q6) Does the college campus have proper facilitates like canteen, auditorium, toilet etc?
A) No
B) Yes
C) can't say
Q7) According to you the best about college is?
A) Understandable staff
B) Studying environment.
Q8) Does the experience from college will help you in future?
A) Yes
B) No
C) No comment
Q9) Do you Like to recommend UKCBC to your Known people?
A) Yes,
B) Not Sure
C) No
Q10) Provide additional feedback or comments.
Ans.
5
A) Yes
B) No
C) Can't say
Q5) Are you satisfied with learning facilities? (Eg sports club, library)
A)Neutral
B) Satisfied
C) Slightly Satisfied
D) Unsatisfied.
E) Very Unsatisfied.
Q6) Does the college campus have proper facilitates like canteen, auditorium, toilet etc?
A) No
B) Yes
C) can't say
Q7) According to you the best about college is?
A) Understandable staff
B) Studying environment.
Q8) Does the experience from college will help you in future?
A) Yes
B) No
C) No comment
Q9) Do you Like to recommend UKCBC to your Known people?
A) Yes,
B) Not Sure
C) No
Q10) Provide additional feedback or comments.
Ans.
5
TASK2
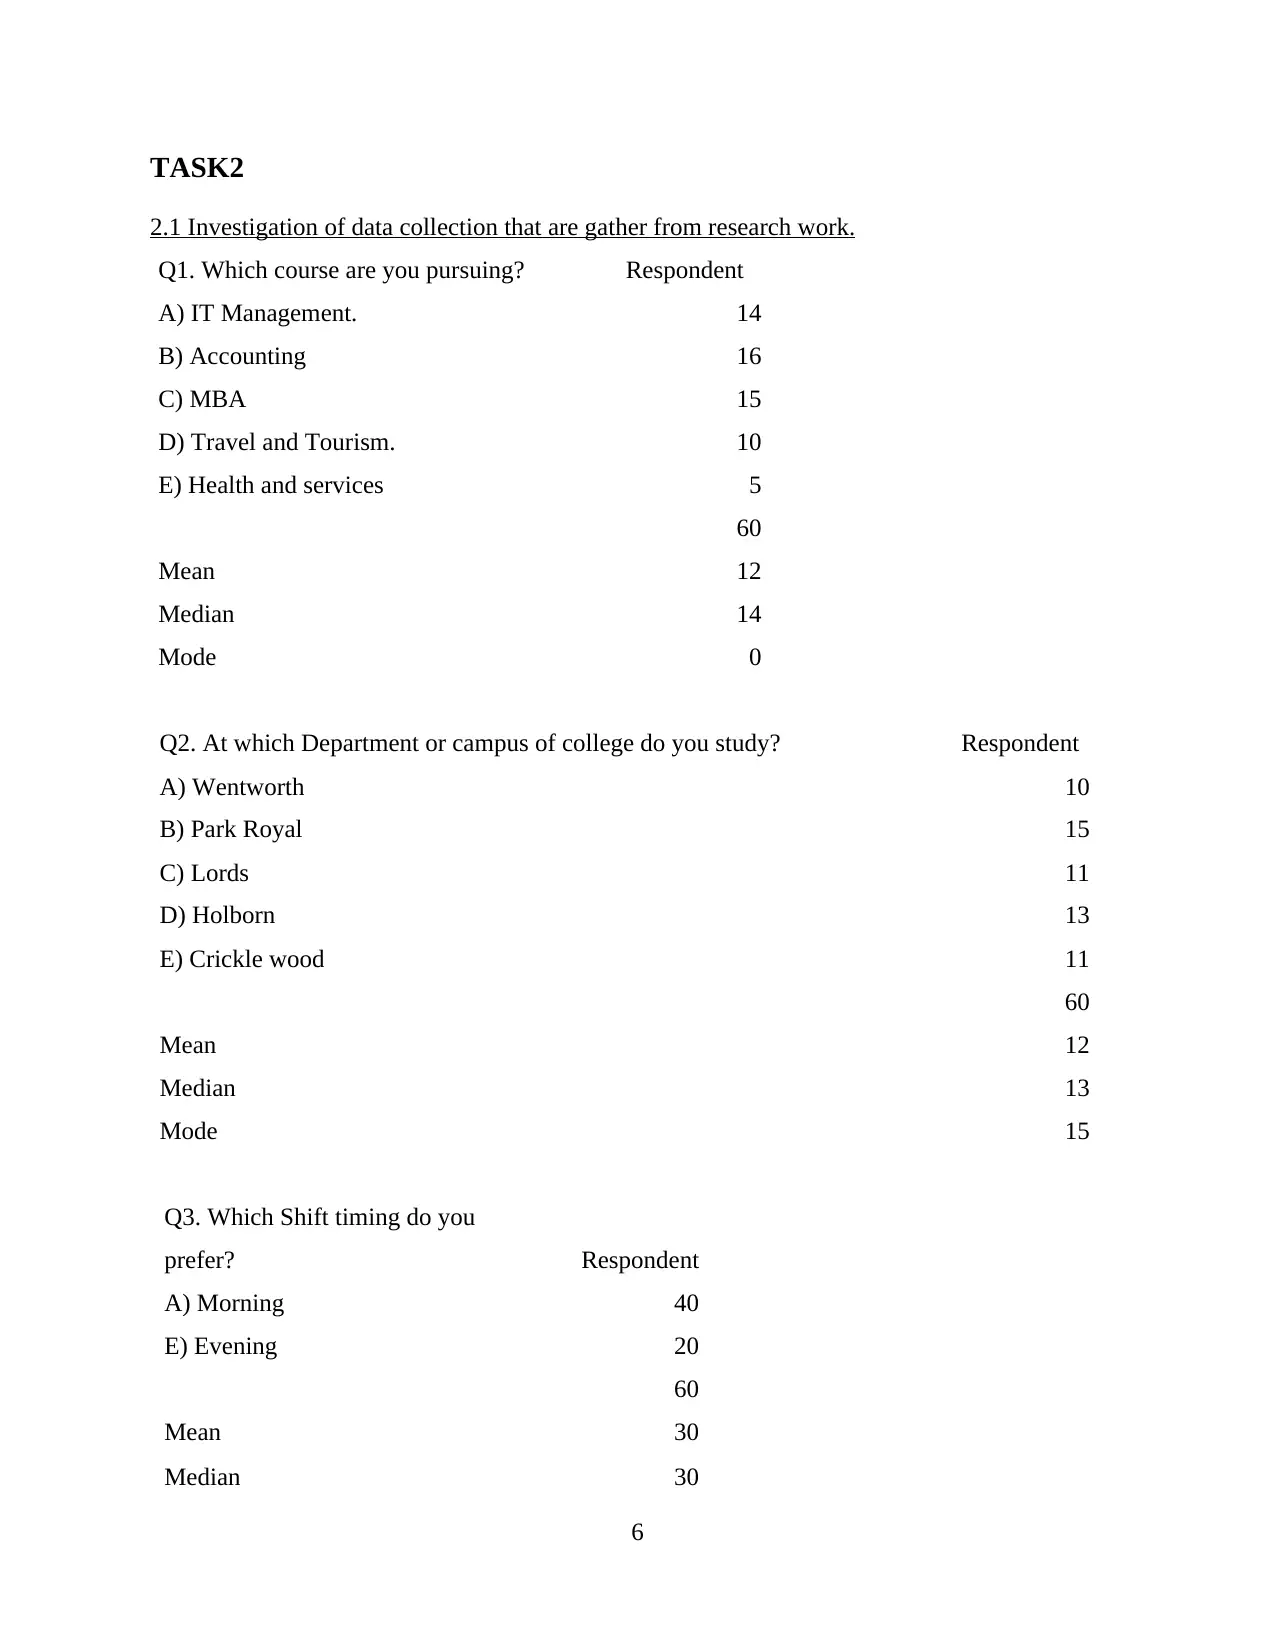
2.1 Investigation of data collection that are gather from research work.
Q1. Which course are you pursuing? Respondent
A) IT Management. 14
B) Accounting 16
C) MBA 15
D) Travel and Tourism. 10
E) Health and services 5
60
Mean 12
Median 14
Mode 0
Q2. At which Department or campus of college do you study? Respondent
A) Wentworth 10
B) Park Royal 15
C) Lords 11
D) Holborn 13
E) Crickle wood 11
60
Mean 12
Median 13
Mode 15
Q3. Which Shift timing do you
prefer? Respondent
A) Morning 40
E) Evening 20
60
Mean 30
Median 30
6
⊘ This is a preview!⊘
Do you want full access?
Subscribe today to unlock all pages.
Trusted by 1+ million students worldwide
Mode 0
Q4) Do you like the teaching faculty? Respondent
A) Yes 25
B) No 15
C) Can't say 20
60
Mean 20
Median 20
Mode 5
Q5) Are you satisfied with learning facilities? (Eg sports club,
library) Respondent
A)Neutral 9
B) Satisfied 10
C) Slightly Satisfied 7
D) Unsatisfied. 16
E) Very Unsatisfied. 18
60
Mean 12
Median 10
Mode 0
Q6) Does college campus have proper facilitates like canteen, auditorium,
toilet etc? Respondent
A) No 18
B) Yes 28
C) can't say 14
60
7
Paraphrase This Document
Need a fresh take? Get an instant paraphrase of this document with our AI Paraphraser
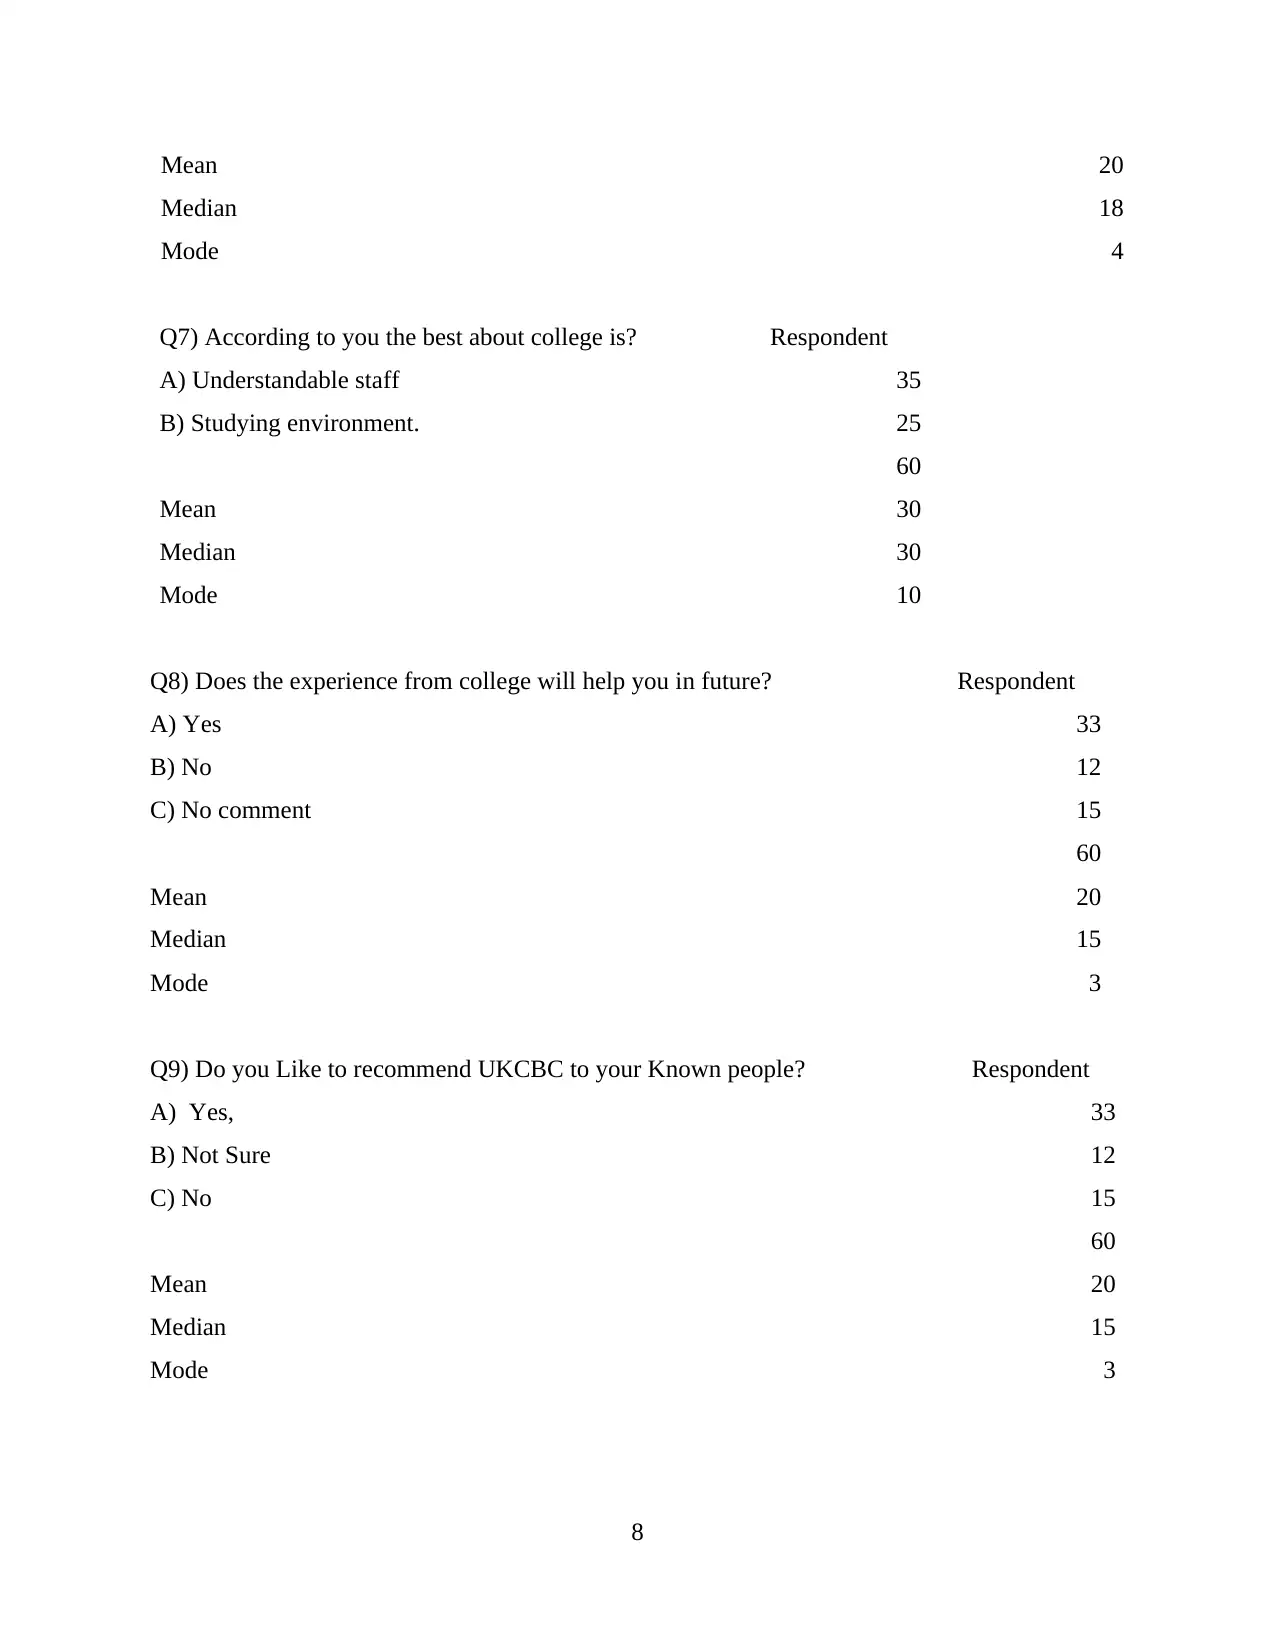
Mean 20
Median 18
Mode 4
Q7) According to you the best about college is? Respondent
A) Understandable staff 35
B) Studying environment. 25
60
Mean 30
Median 30
Mode 10
Q8) Does the experience from college will help you in future? Respondent
A) Yes 33
B) No 12
C) No comment 15
60
Mean 20
Median 15
Mode 3
Q9) Do you Like to recommend UKCBC to your Known people? Respondent
A) Yes, 33
B) Not Sure 12
C) No 15
60
Mean 20
Median 15
Mode 3
8
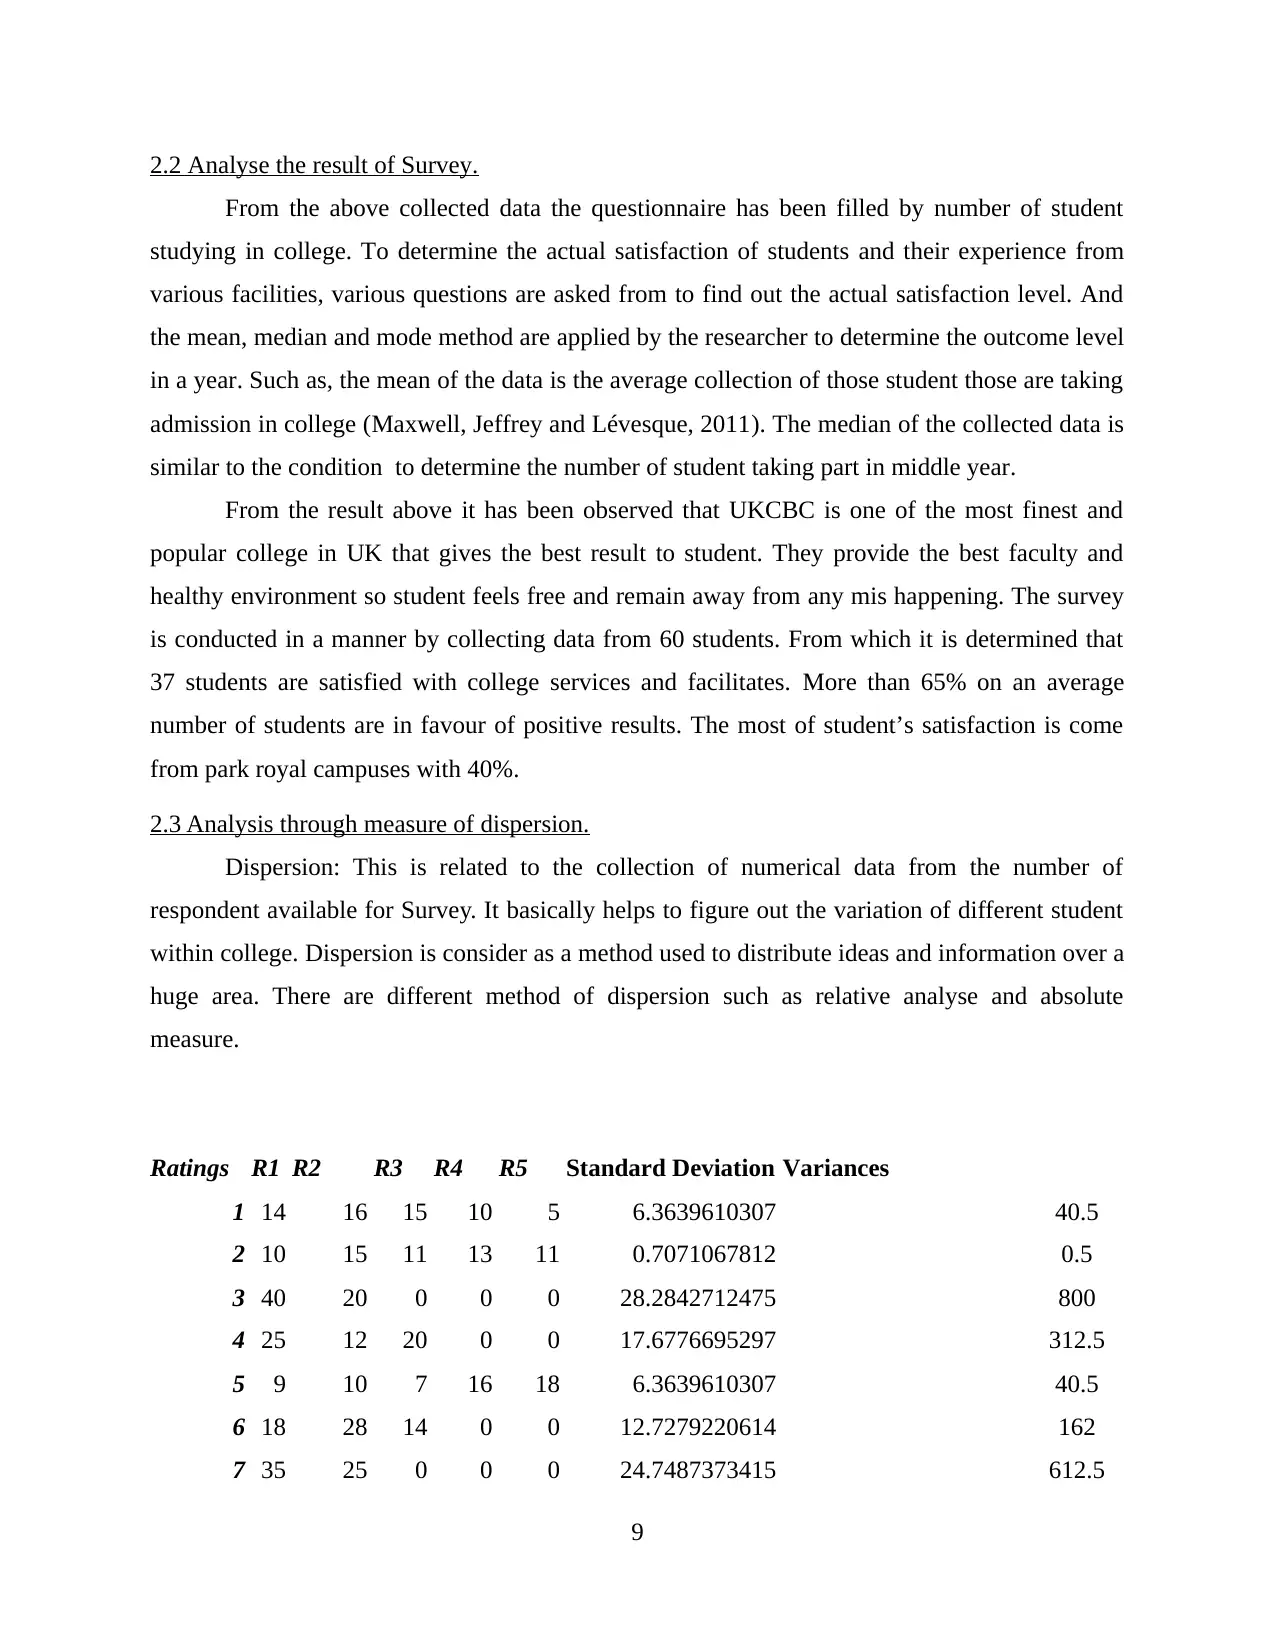
2.2 Analyse the result of Survey.
From the above collected data the questionnaire has been filled by number of student
studying in college. To determine the actual satisfaction of students and their experience from
various facilities, various questions are asked from to find out the actual satisfaction level. And
the mean, median and mode method are applied by the researcher to determine the outcome level
in a year. Such as, the mean of the data is the average collection of those student those are taking
admission in college (Maxwell, Jeffrey and Lévesque, 2011). The median of the collected data is
similar to the condition to determine the number of student taking part in middle year.
From the result above it has been observed that UKCBC is one of the most finest and
popular college in UK that gives the best result to student. They provide the best faculty and
healthy environment so student feels free and remain away from any mis happening. The survey
is conducted in a manner by collecting data from 60 students. From which it is determined that
37 students are satisfied with college services and facilitates. More than 65% on an average
number of students are in favour of positive results. The most of student’s satisfaction is come
from park royal campuses with 40%.
2.3 Analysis through measure of dispersion.
Dispersion: This is related to the collection of numerical data from the number of
respondent available for Survey. It basically helps to figure out the variation of different student
within college. Dispersion is consider as a method used to distribute ideas and information over a
huge area. There are different method of dispersion such as relative analyse and absolute
measure.
Ratings R1 R2 R3 R4 R5 Standard Deviation Variances
1 14 16 15 10 5 6.3639610307 40.5
2 10 15 11 13 11 0.7071067812 0.5
3 40 20 0 0 0 28.2842712475 800
4 25 12 20 0 0 17.6776695297 312.5
5 9 10 7 16 18 6.3639610307 40.5
6 18 28 14 0 0 12.7279220614 162
7 35 25 0 0 0 24.7487373415 612.5
9
⊘ This is a preview!⊘
Do you want full access?
Subscribe today to unlock all pages.
Trusted by 1+ million students worldwide
1 out of 23
Related Documents


Your All-in-One AI-Powered Toolkit for Academic Success.
+13062052269
info@desklib.com
Available 24*7 on WhatsApp / Email
![[object Object]](/_next/static/media/star-bottom.7253800d.svg)
Unlock your academic potential
Copyright © 2020–2026 A2Z Services. All Rights Reserved. Developed and managed by ZUCOL.