Comprehensive Report on Numeracy and Data Analysis for Study Hours

Verified

Added on  2023/01/03

|10
|1277
|20
Report
AI Summary
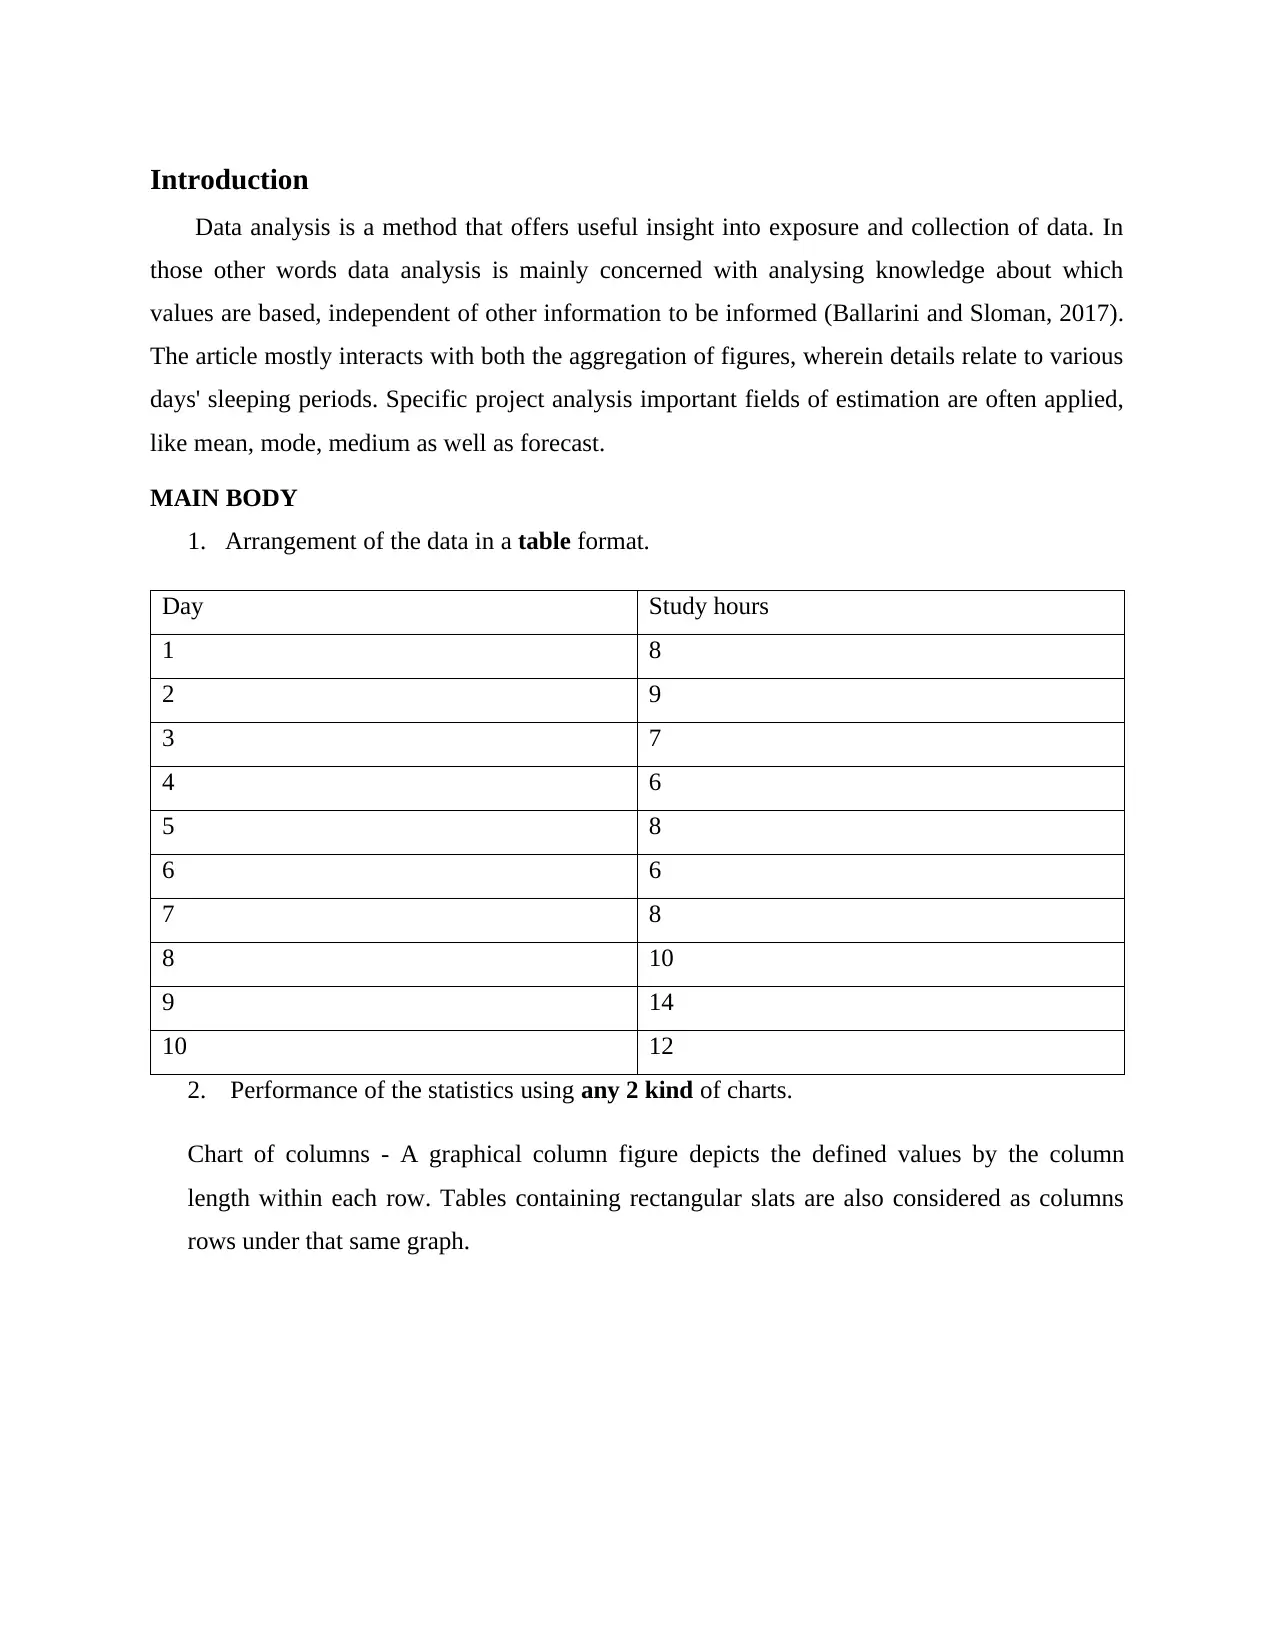
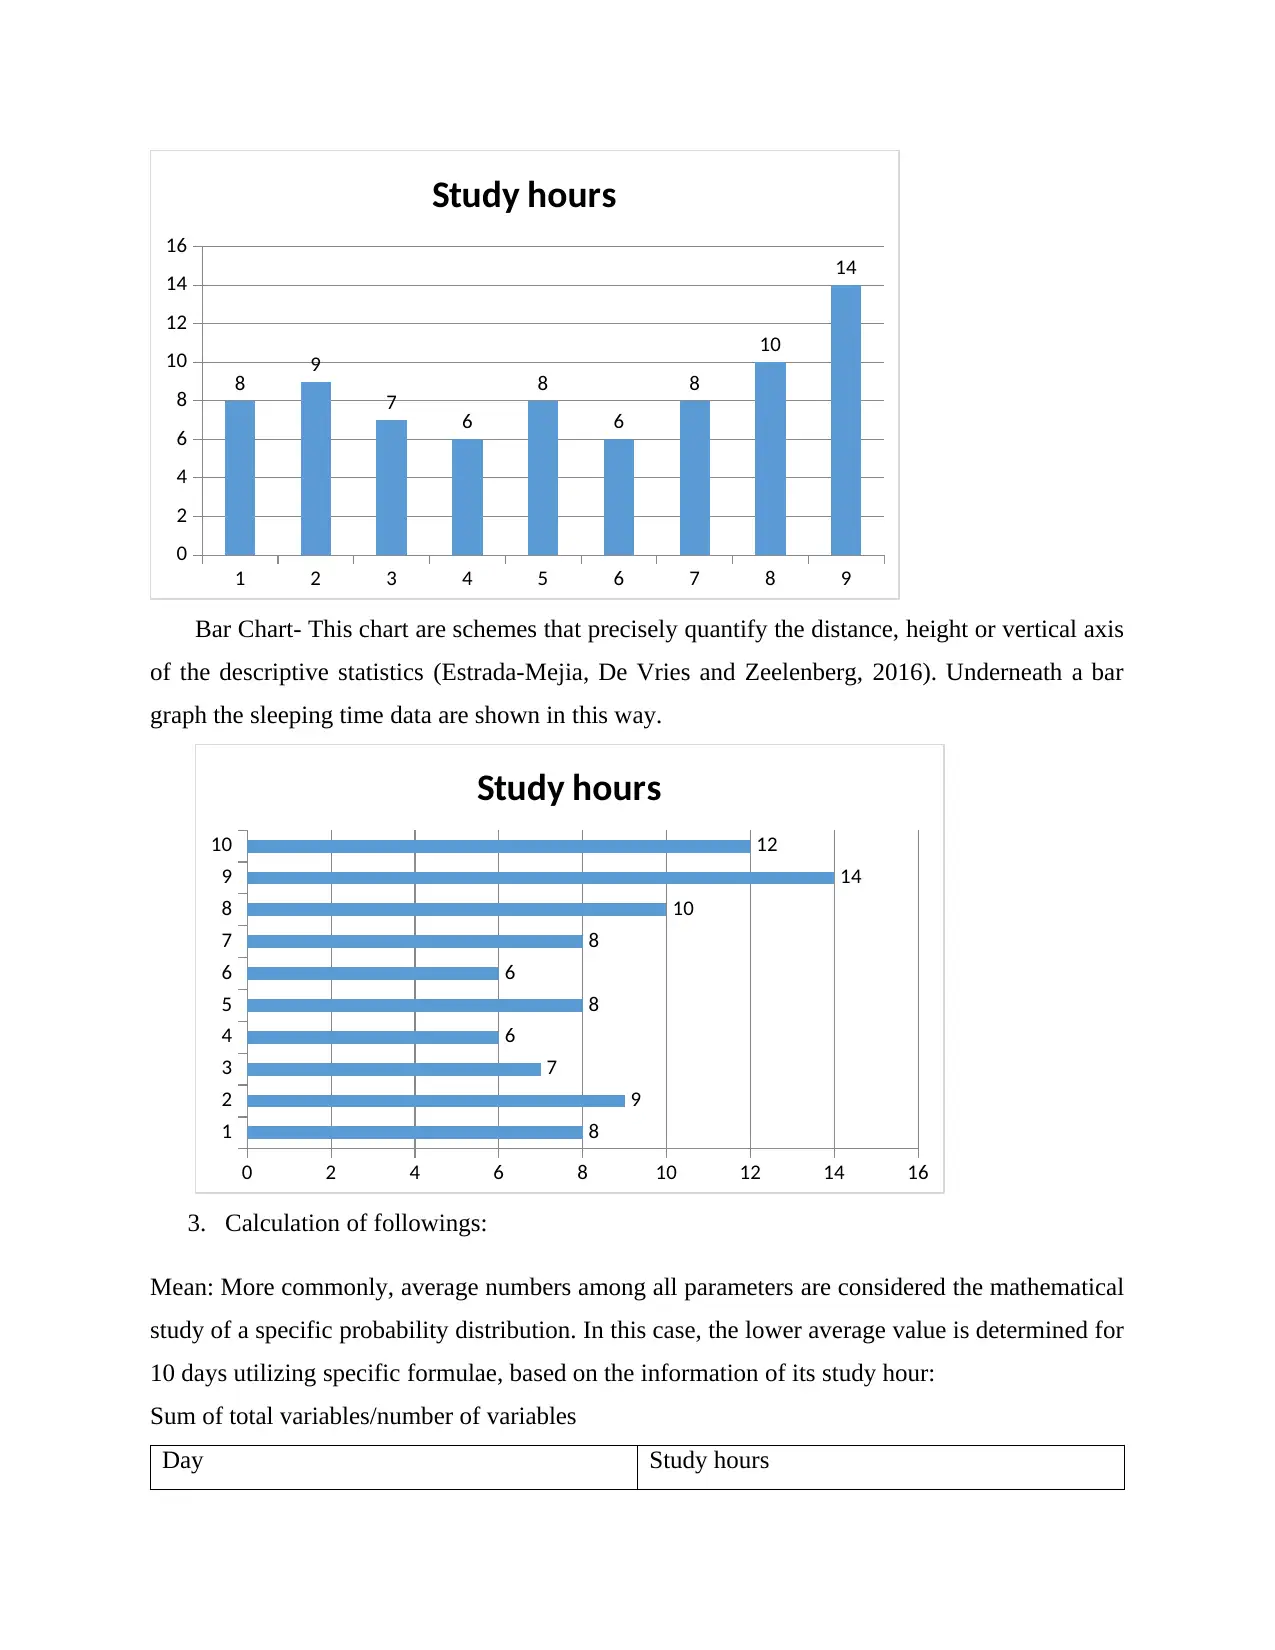
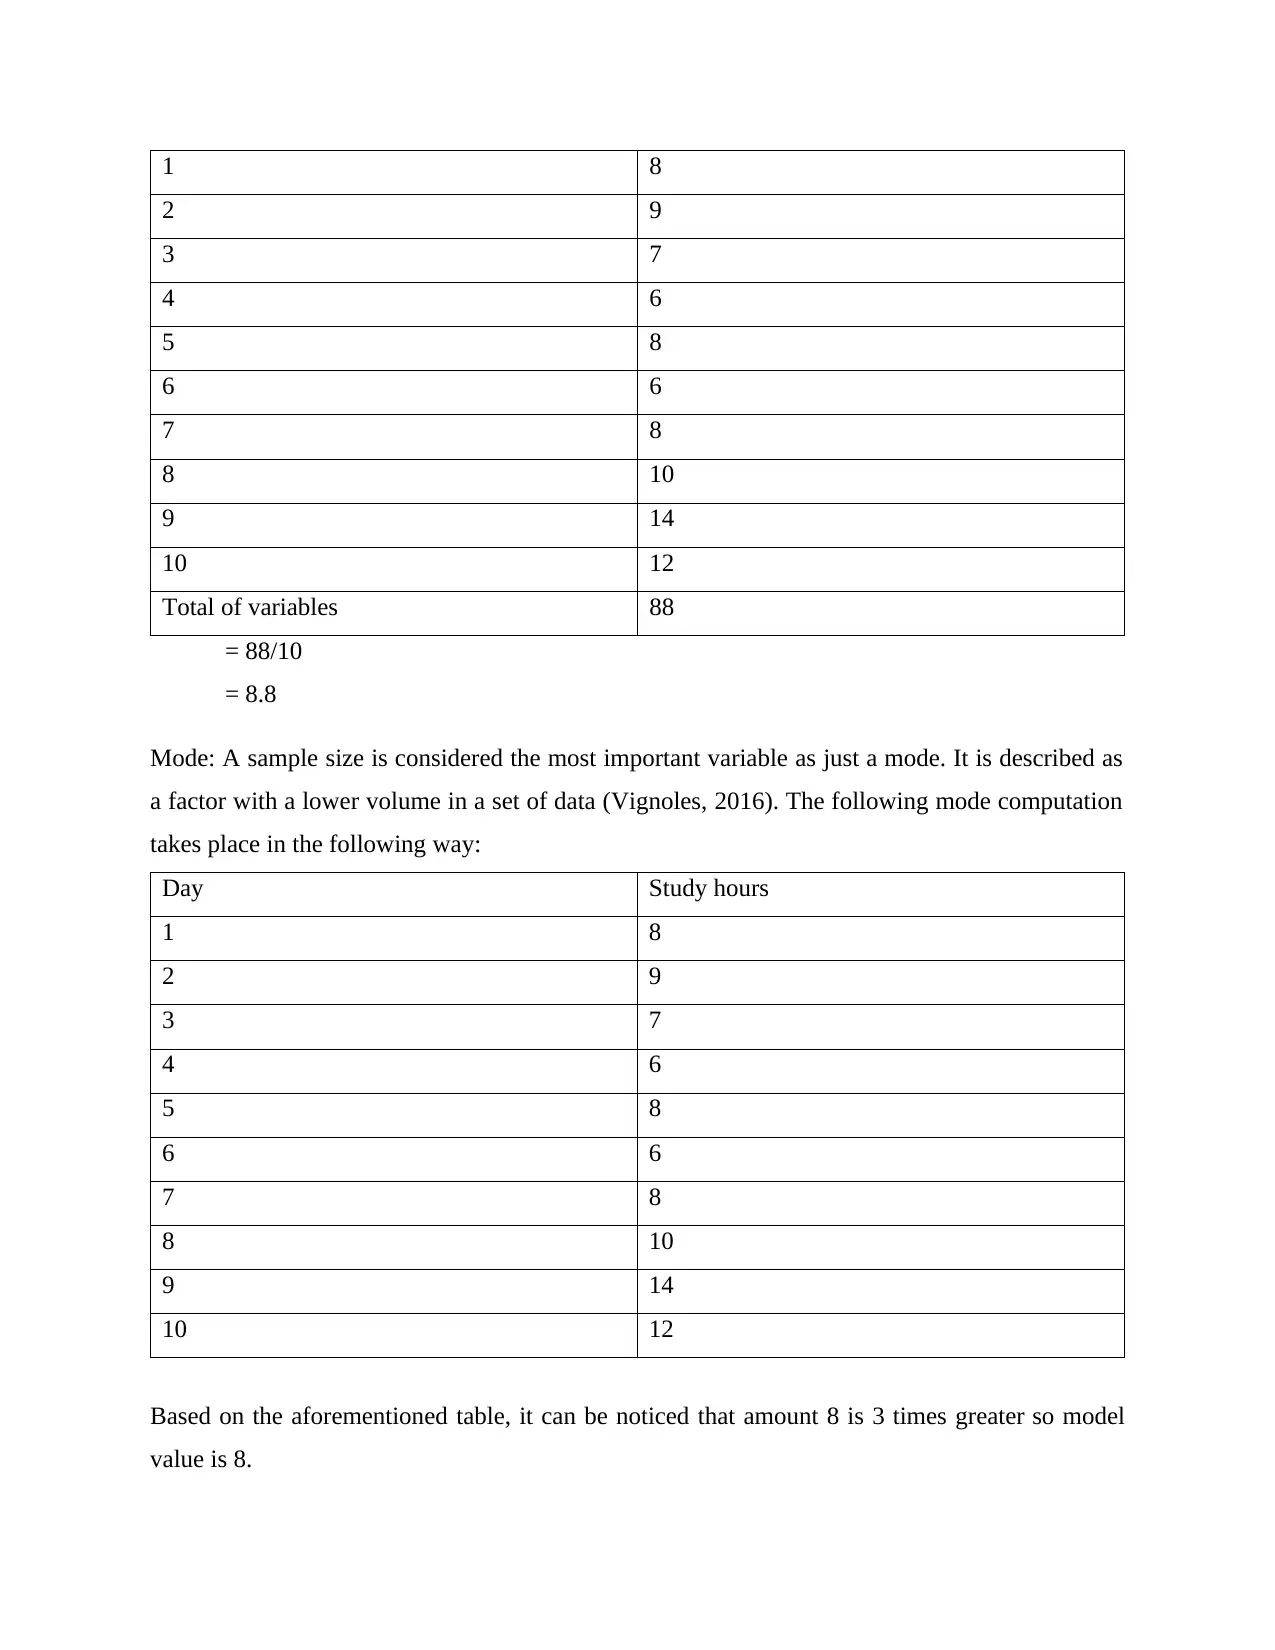
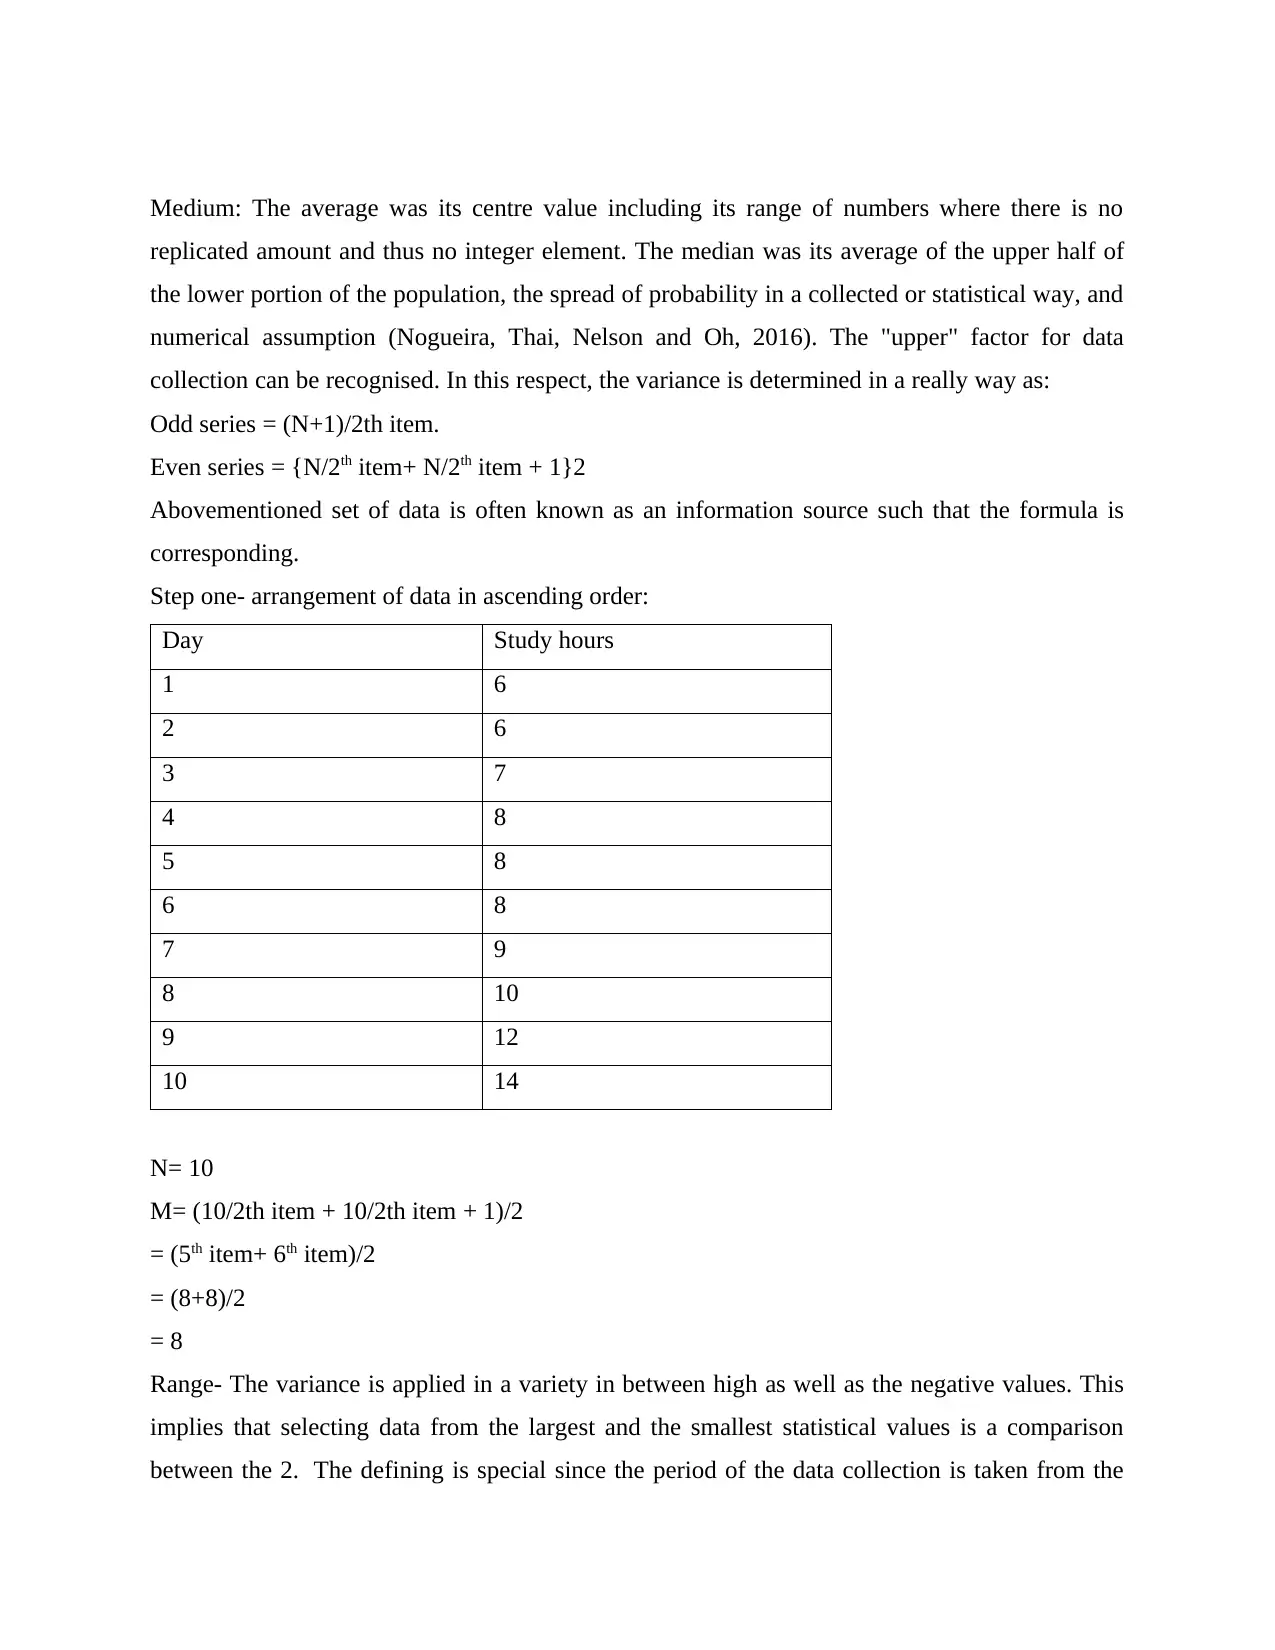
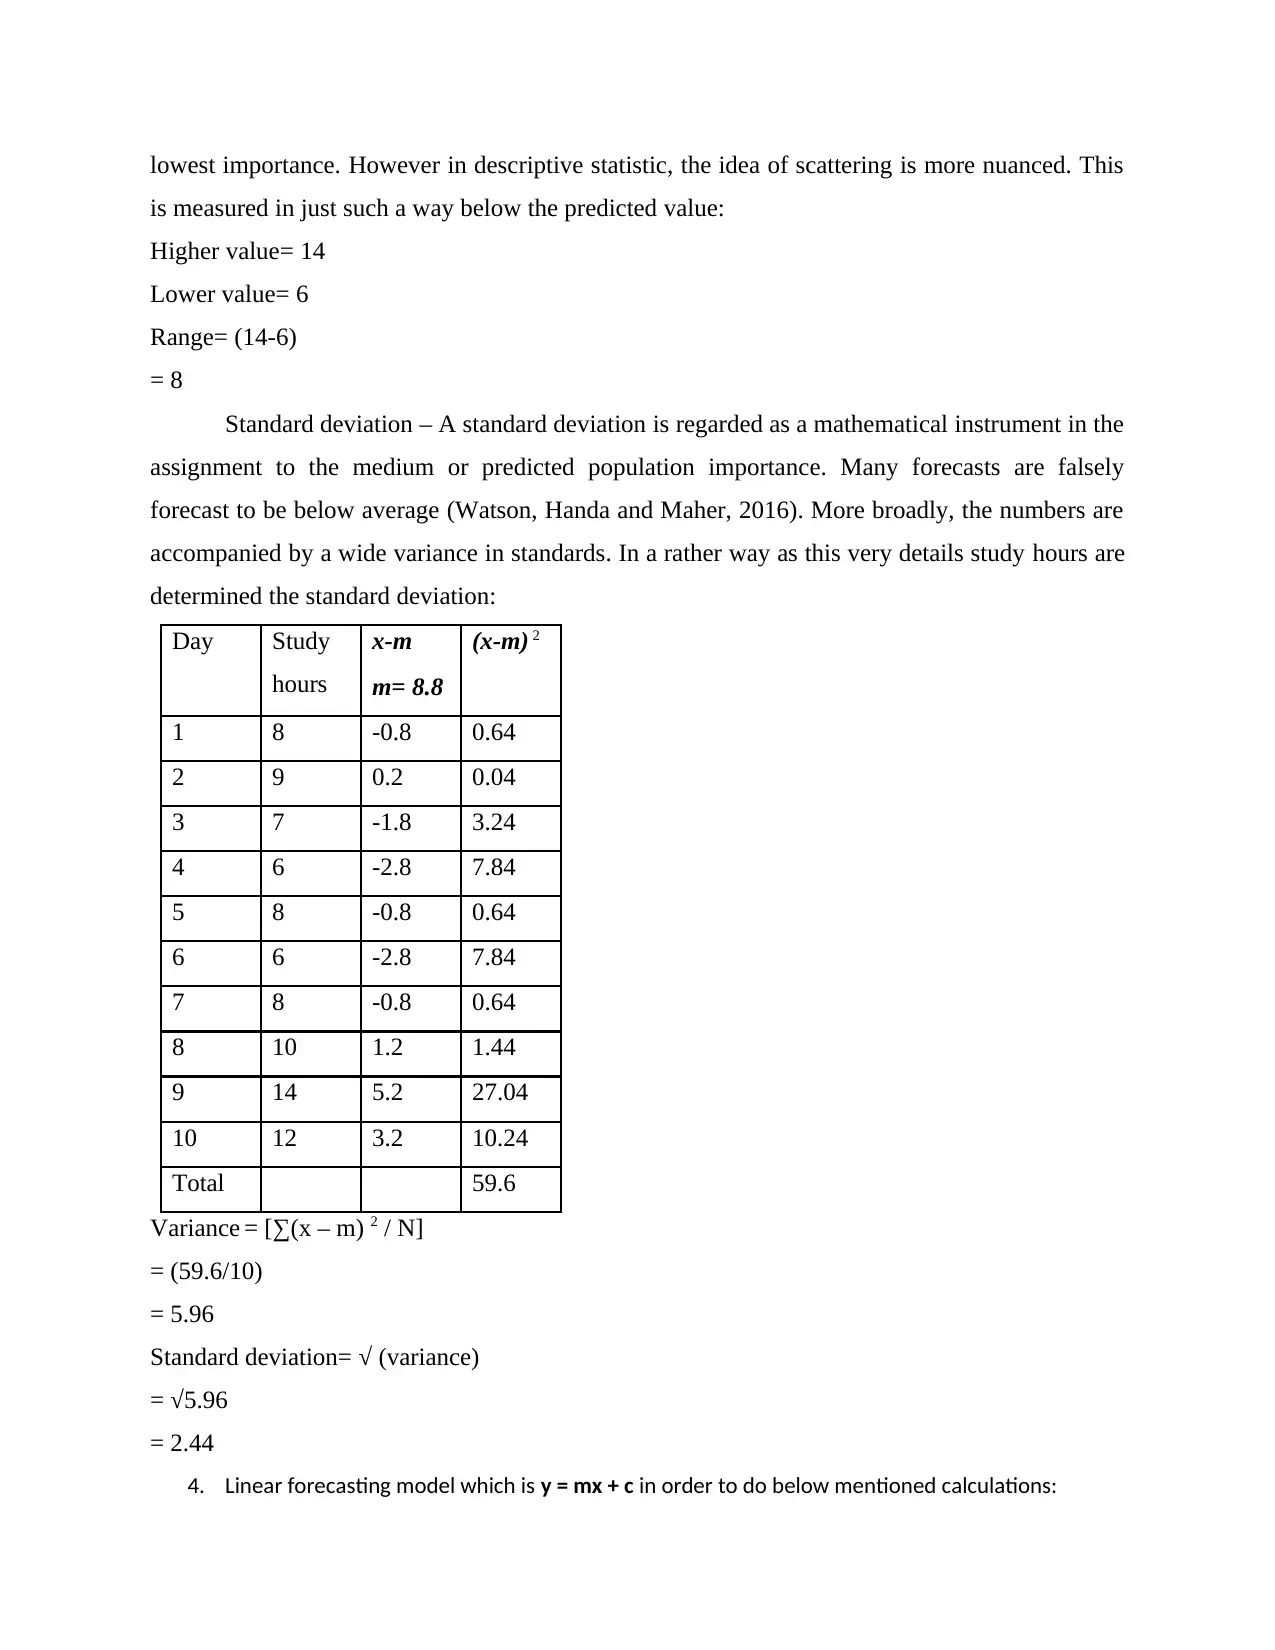
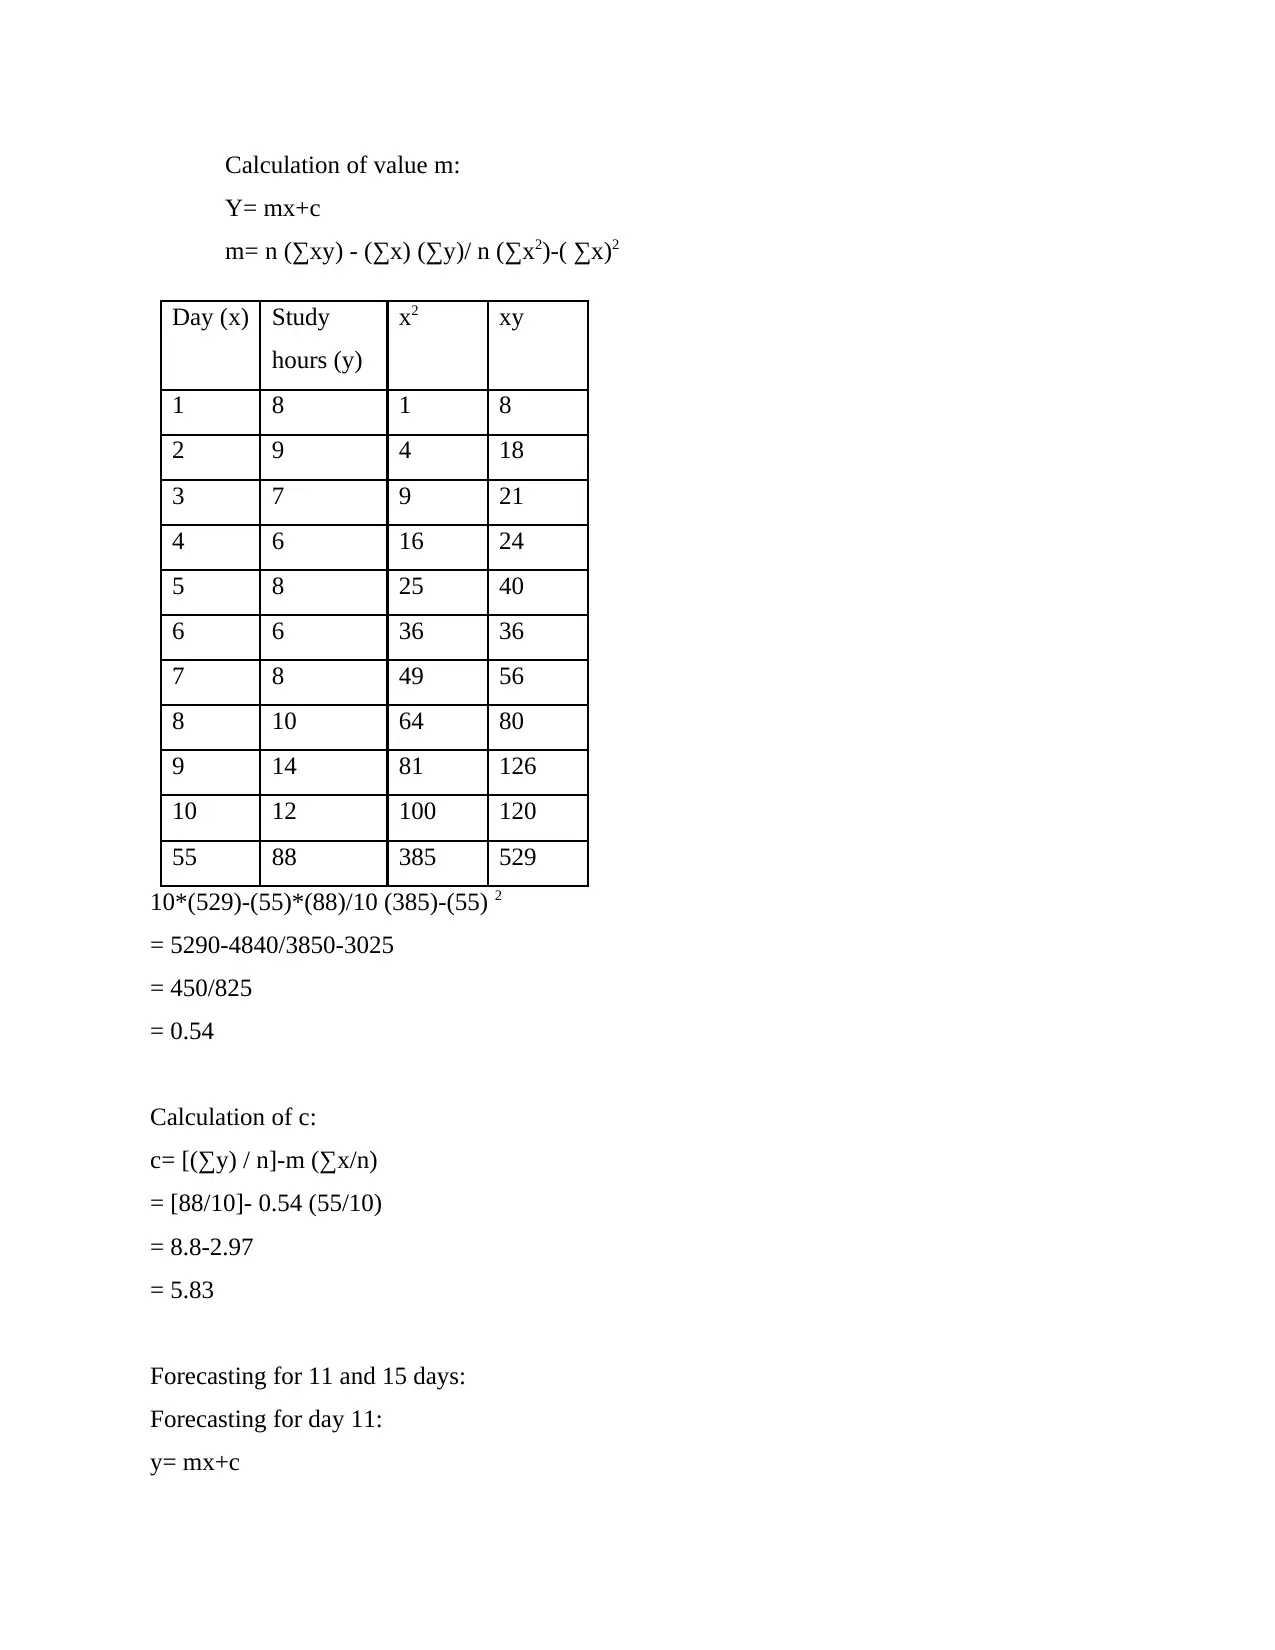
This report delves into the application of numeracy and data analysis, focusing on the analysis of study hours over a ten-day period. The report begins with data organization in a table format and proceeds to present the data visually using column and bar charts. Key statistical measures, including mean, mode, median, range, and standard deviation, are calculated to provide a comprehensive understanding of the data's central tendencies and dispersion. Furthermore, the report employs a linear forecasting model to predict study hours for the 11th and 15th days. The analysis highlights the practical utility of data analysis methods in drawing insights and making informed predictions, concluding with a summary of the findings and their implications.
tabler-icon-diamond-filled.svg

Contribute Materials

Your contribution can guide someone’s learning journey. Share your documents today.
Document Page
Numeracy and data
analysis
tabler-icon-diamond-filled.svg

Secure Best Marks with AI Grader

Need help grading? Try our AI Grader for instant feedback on your assignments.
Document Page
Table of Contents
Introduction......................................................................................................................................3
MAIN BODY..................................................................................................................................3
CONCLUSION................................................................................................................................9
REFERENCES..............................................................................................................................10
Document Page
Introduction
Data analysis is a method that offers useful insight into exposure and collection of data. In
those other words data analysis is mainly concerned with analysing knowledge about which
values are based, independent of other information to be informed (Ballarini and Sloman, 2017).
The article mostly interacts with both the aggregation of figures, wherein details relate to various
days' sleeping periods. Specific project analysis important fields of estimation are often applied,
like mean, mode, medium as well as forecast.
MAIN BODY
1. Arrangement of the data in a table format.
Day Study hours
1 8
2 9
3 7
4 6
5 8
6 6
7 8
8 10
9 14
10 12
2. Performance of the statistics using any 2 kind of charts.
Chart of columns - A graphical column figure depicts the defined values by the column
length within each row. Tables containing rectangular slats are also considered as columns
rows under that same graph.
Document Page
1 2 3 4 5 6 7 8 9
0
2
4
6
8
10
12
14
16
8 9
7 6
8
6
8
10
14
Study hours
Bar Chart- This chart are schemes that precisely quantify the distance, height or vertical axis
of the descriptive statistics (Estrada-Mejia, De Vries and Zeelenberg, 2016). Underneath a bar
graph the sleeping time data are shown in this way.
1
2
3
4
5
6
7
8
9
10
0 2 4 6 8 10 12 14 16
8
9
7
6
8
6
8
10
14
12
Study hours
3. Calculation of followings:
Mean: More commonly, average numbers among all parameters are considered the mathematical
study of a specific probability distribution. In this case, the lower average value is determined for
10 days utilizing specific formulae, based on the information of its study hour:
Sum of total variables/number of variables
Day Study hours
tabler-icon-diamond-filled.svg

Secure Best Marks with AI Grader

Need help grading? Try our AI Grader for instant feedback on your assignments.
Document Page
1 8
2 9
3 7
4 6
5 8
6 6
7 8
8 10
9 14
10 12
Total of variables 88
= 88/10
= 8.8
Mode: A sample size is considered the most important variable as just a mode. It is described as
a factor with a lower volume in a set of data (Vignoles, 2016). The following mode computation
takes place in the following way:
Day Study hours
1 8
2 9
3 7
4 6
5 8
6 6
7 8
8 10
9 14
10 12
Based on the aforementioned table, it can be noticed that amount 8 is 3 times greater so model
value is 8.
Document Page
Medium: The average was its centre value including its range of numbers where there is no
replicated amount and thus no integer element. The median was its average of the upper half of
the lower portion of the population, the spread of probability in a collected or statistical way, and
numerical assumption (Nogueira, Thai, Nelson and Oh, 2016). The "upper" factor for data
collection can be recognised. In this respect, the variance is determined in a really way as:
Odd series = (N+1)/2th item.
Even series = {N/2th item+ N/2th item + 1}2
Abovementioned set of data is often known as an information source such that the formula is
corresponding.
Step one- arrangement of data in ascending order:
Day Study hours
1 6
2 6
3 7
4 8
5 8
6 8
7 9
8 10
9 12
10 14
N= 10
M= (10/2th item + 10/2th item + 1)/2
= (5th item+ 6th item)/2
= (8+8)/2
= 8
Range- The variance is applied in a variety in between high as well as the negative values. This
implies that selecting data from the largest and the smallest statistical values is a comparison
between the 2. The defining is special since the period of the data collection is taken from the
Document Page
lowest importance. However in descriptive statistic, the idea of scattering is more nuanced. This
is measured in just such a way below the predicted value:
Higher value= 14
Lower value= 6
Range= (14-6)
= 8
Standard deviation – A standard deviation is regarded as a mathematical instrument in the
assignment to the medium or predicted population importance. Many forecasts are falsely
forecast to be below average (Watson, Handa and Maher, 2016). More broadly, the numbers are
accompanied by a wide variance in standards. In a rather way as this very details study hours are
determined the standard deviation:
Day Study
hours
x-m (x-m) 2
m= 8.8
1 8 -0.8 0.64
2 9 0.2 0.04
3 7 -1.8 3.24
4 6 -2.8 7.84
5 8 -0.8 0.64
6 6 -2.8 7.84
7 8 -0.8 0.64
8 10 1.2 1.44
9 14 5.2 27.04
10 12 3.2 10.24
Total 59.6
Variance = [∑(x – m) 2 / N]
= (59.6/10)
= 5.96
Standard deviation= √ (variance)
= √5.96
= 2.44
4. Linear forecasting model which is y = mx + c in order to do below mentioned calculations:
tabler-icon-diamond-filled.svg

Paraphrase This Document

Need a fresh take? Get an instant paraphrase of this document with our AI Paraphraser
Document Page
Calculation of value m:
Y= mx+c
m= n (∑xy) - (∑x) (∑y)/ n (∑x2)-( ∑x)2
Day (x) Study
hours (y)
x2 xy
1 8 1 8
2 9 4 18
3 7 9 21
4 6 16 24
5 8 25 40
6 6 36 36
7 8 49 56
8 10 64 80
9 14 81 126
10 12 100 120
55 88 385 529
10*(529)-(55)*(88)/10 (385)-(55) 2
= 5290-4840/3850-3025
= 450/825
= 0.54
Calculation of c:
c= [(∑y) / n]-m (∑x/n)
= [88/10]- 0.54 (55/10)
= 8.8-2.97
= 5.83
Forecasting for 11 and 15 days:
Forecasting for day 11:
y= mx+c
Document Page
= 0.54*11+5.83
= 11.77 OR 12 hour
Forecasting for day 15:
= 0.54*15+5.83
= 13.93 OR 14 hour
CONCLUSION
Based according to the above project paper, the analysis of data as well as its methods are
valuable to business organisations. The study ends on numerous forms of measurements along
with mean, mode, medium and standard deviations. The 11 and 15 day projection will be
performed according to the linear prediction system throughout the second section.
Document Page
REFERENCES
Books and journal:
Ballarini, C. and Sloman, S.A., 2017. Reasons and the “Motivated Numeracy Effect.”.
In Proceedings of the 39th annual meeting of the Cognitive Science Society (pp. 1580-
1585).
Estrada-Mejia, C., De Vries, M. and Zeelenberg, M., 2016. Numeracy and wealth. Journal of
Economic Psychology, 54, pp.53-63.
Vignoles, A., 2016. What is the economic value of literacy and numeracy?. IZA World of Labor.
chevron_up_icon
1 out of 10
circle_padding
hide_on_mobile
zoom_out_icon
logo.png

Your All-in-One AI-Powered Toolkit for Academic Success.

Available 24*7 on WhatsApp / Email

[object Object]