Analyzing Sublime Delight Coffee Company: A Business Case Study
VerifiedAdded on 2020/02/14
|12
|2671
|36
Case Study
AI Summary
This case study analyzes the performance of Sublime Delight, a coffee company, based on provided datasets. The analysis covers sales distribution across outlets, profit margins, and growth areas, using data from external customer orders, internal cart orders, and mobile orders. The report examines sales figures, profit per kilogram, and the impact of consumer volume on production costs. Furthermore, the study investigates service and coffee quality differences between outlets using consumer survey data, highlighting the importance of consumer satisfaction. The report also evaluates the bean mix supplied to external outlets, comparing it to a market analysis from 2014, which suggested a specific mix ratio. The conclusion emphasizes the importance of data-driven decision-making for future forecasting and long-term business benefits. The report provides actionable insights for improving sales, customer satisfaction, and overall business performance. The analysis includes detailed tables and interpretations of the data, offering a comprehensive overview of the company's operations and market position.
CASE ANALYSIS
Paraphrase This Document
Need a fresh take? Get an instant paraphrase of this document with our AI Paraphraser
Contents
EXECUTIVE SUMMARY.................................................................................................................................2
INTRODUCTION...........................................................................................................................................2
TASK 1..........................................................................................................................................................2
Task 2..........................................................................................................................................................3
TASK 3..........................................................................................................................................................6
SUMMARY...................................................................................................................................................7
REFERENCE..................................................................................................................................................7
OVERALL PRESENTATION OF THE BUSINESS REPORT..................................................................................7
PEER REVIEW...............................................................................................................................................8
EXECUTIVE SUMMARY
A collection of data with scientifical manner is important for every origination. It is as it is easily
understandable for every stakeholder. It has many benefits for the company like forecasting, decision-
making etc. Therefore, the collection of data must be necessary to arrange in right manner, so that
every interested person can understand it adequately. It is to be noted that, without arranging of data it
is not possible to understand this easily. Calculation of sales, profit and gross profit exhibits an overall
business scenario with right manner (Savage, 1972). A consumer survey shows that review of the user
for the product, which is important for a known company market condition. The coffee maker enterprise
should follow standard guidelines for achieving success target as what their management decides.
Therefore, the graph goes upward as target basis so that it can reach the decided profit level.
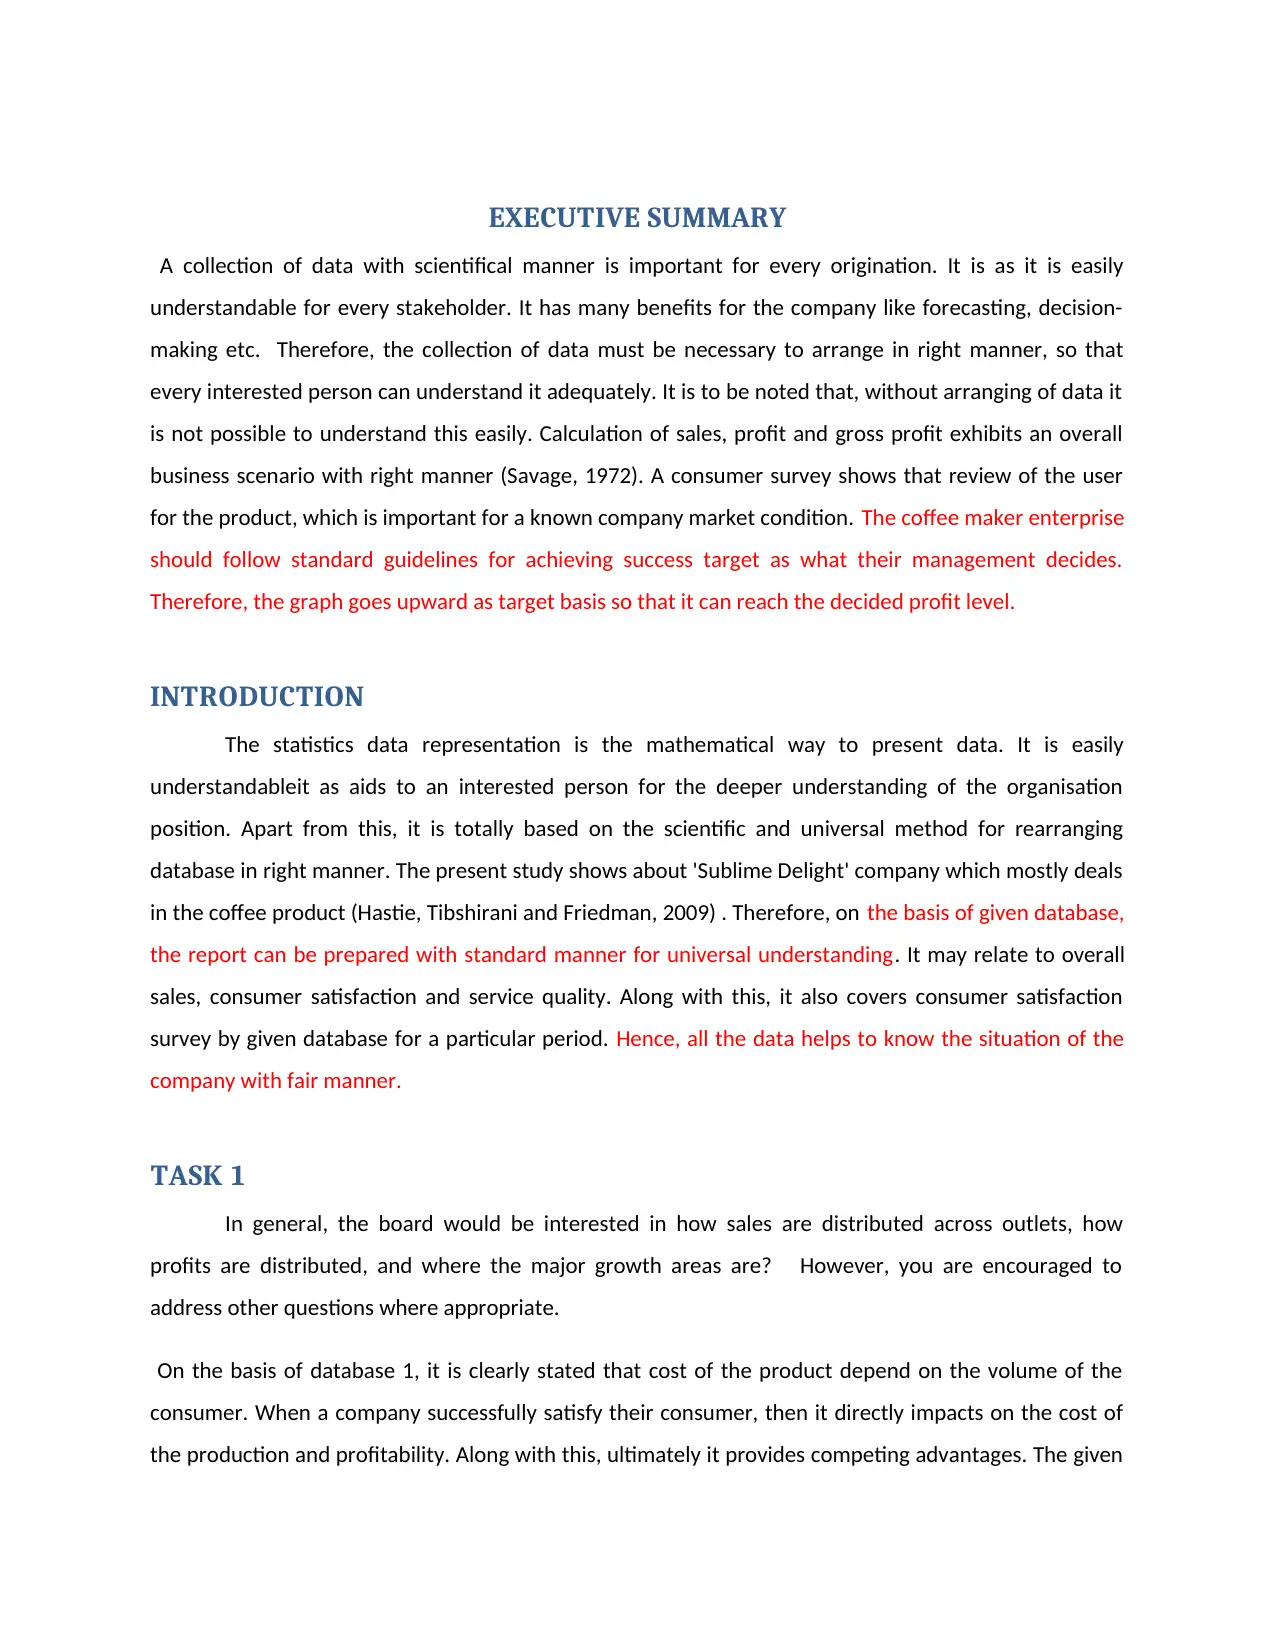
INTRODUCTION
The statistics data representation is the mathematical way to present data. It is easily
understandableit as aids to an interested person for the deeper understanding of the organisation
position. Apart from this, it is totally based on the scientific and universal method for rearranging
database in right manner. The present study shows about 'Sublime Delight' company which mostly deals
in the coffee product (Hastie, Tibshirani and Friedman, 2009) . Therefore, on the basis of given database,
the report can be prepared with standard manner for universal understanding. It may relate to overall
sales, consumer satisfaction and service quality. Along with this, it also covers consumer satisfaction
survey by given database for a particular period. Hence, all the data helps to know the situation of the
company with fair manner.
TASK 1
In general, the board would be interested in how sales are distributed across outlets, how
profits are distributed, and where the major growth areas are? However, you are encouraged to
address other questions where appropriate.
On the basis of database 1, it is clearly stated that cost of the product depend on the volume of the
consumer. When a company successfully satisfy their consumer, then it directly impacts on the cost of
the production and profitability. Along with this, ultimately it provides competing advantages. The given
A collection of data with scientifical manner is important for every origination. It is as it is easily
understandable for every stakeholder. It has many benefits for the company like forecasting, decision-
making etc. Therefore, the collection of data must be necessary to arrange in right manner, so that
every interested person can understand it adequately. It is to be noted that, without arranging of data it
is not possible to understand this easily. Calculation of sales, profit and gross profit exhibits an overall
business scenario with right manner (Savage, 1972). A consumer survey shows that review of the user
for the product, which is important for a known company market condition. The coffee maker enterprise
should follow standard guidelines for achieving success target as what their management decides.
Therefore, the graph goes upward as target basis so that it can reach the decided profit level.
INTRODUCTION
The statistics data representation is the mathematical way to present data. It is easily
understandableit as aids to an interested person for the deeper understanding of the organisation
position. Apart from this, it is totally based on the scientific and universal method for rearranging
database in right manner. The present study shows about 'Sublime Delight' company which mostly deals
in the coffee product (Hastie, Tibshirani and Friedman, 2009) . Therefore, on the basis of given database,
the report can be prepared with standard manner for universal understanding. It may relate to overall
sales, consumer satisfaction and service quality. Along with this, it also covers consumer satisfaction
survey by given database for a particular period. Hence, all the data helps to know the situation of the
company with fair manner.
TASK 1
In general, the board would be interested in how sales are distributed across outlets, how
profits are distributed, and where the major growth areas are? However, you are encouraged to
address other questions where appropriate.
On the basis of database 1, it is clearly stated that cost of the product depend on the volume of the
consumer. When a company successfully satisfy their consumer, then it directly impacts on the cost of
the production and profitability. Along with this, ultimately it provides competing advantages. The given
⊘ This is a preview!⊘
Do you want full access?
Subscribe today to unlock all pages.
Trusted by 1+ million students worldwide
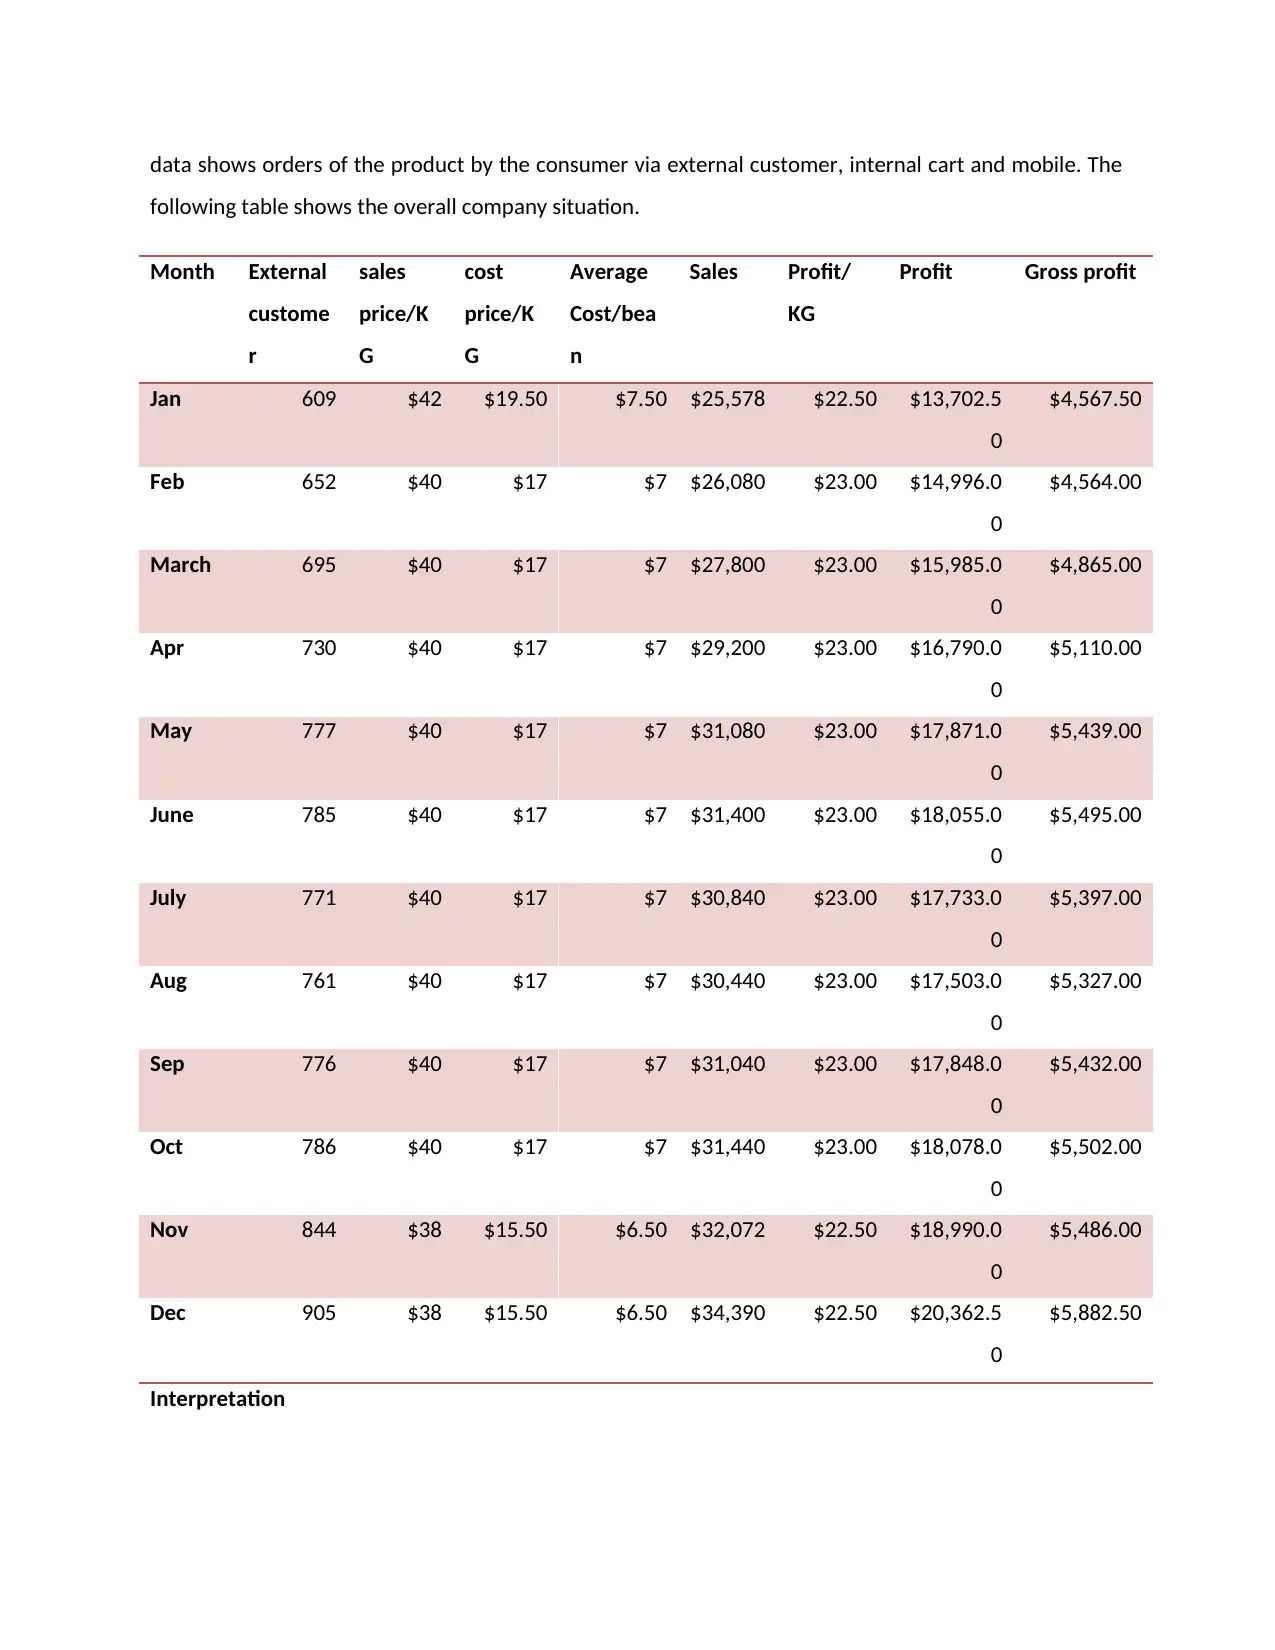
data shows orders of the product by the consumer via external customer, internal cart and mobile. The
following table shows the overall company situation.
Month External
custome
r
sales
price/K
G
cost
price/K
G
Average
Cost/bea
n
Sales Profit/
KG
Profit Gross profit
Jan 609 $42 $19.50 $7.50 $25,578 $22.50 $13,702.5
0
$4,567.50
Feb 652 $40 $17 $7 $26,080 $23.00 $14,996.0
0
$4,564.00
March 695 $40 $17 $7 $27,800 $23.00 $15,985.0
0
$4,865.00
Apr 730 $40 $17 $7 $29,200 $23.00 $16,790.0
0
$5,110.00
May 777 $40 $17 $7 $31,080 $23.00 $17,871.0
0
$5,439.00
June 785 $40 $17 $7 $31,400 $23.00 $18,055.0
0
$5,495.00
July 771 $40 $17 $7 $30,840 $23.00 $17,733.0
0
$5,397.00
Aug 761 $40 $17 $7 $30,440 $23.00 $17,503.0
0
$5,327.00
Sep 776 $40 $17 $7 $31,040 $23.00 $17,848.0
0
$5,432.00
Oct 786 $40 $17 $7 $31,440 $23.00 $18,078.0
0
$5,502.00
Nov 844 $38 $15.50 $6.50 $32,072 $22.50 $18,990.0
0
$5,486.00
Dec 905 $38 $15.50 $6.50 $34,390 $22.50 $20,362.5
0
$5,882.50
Interpretation
Paraphrase This Document
Need a fresh take? Get an instant paraphrase of this document with our AI Paraphraser
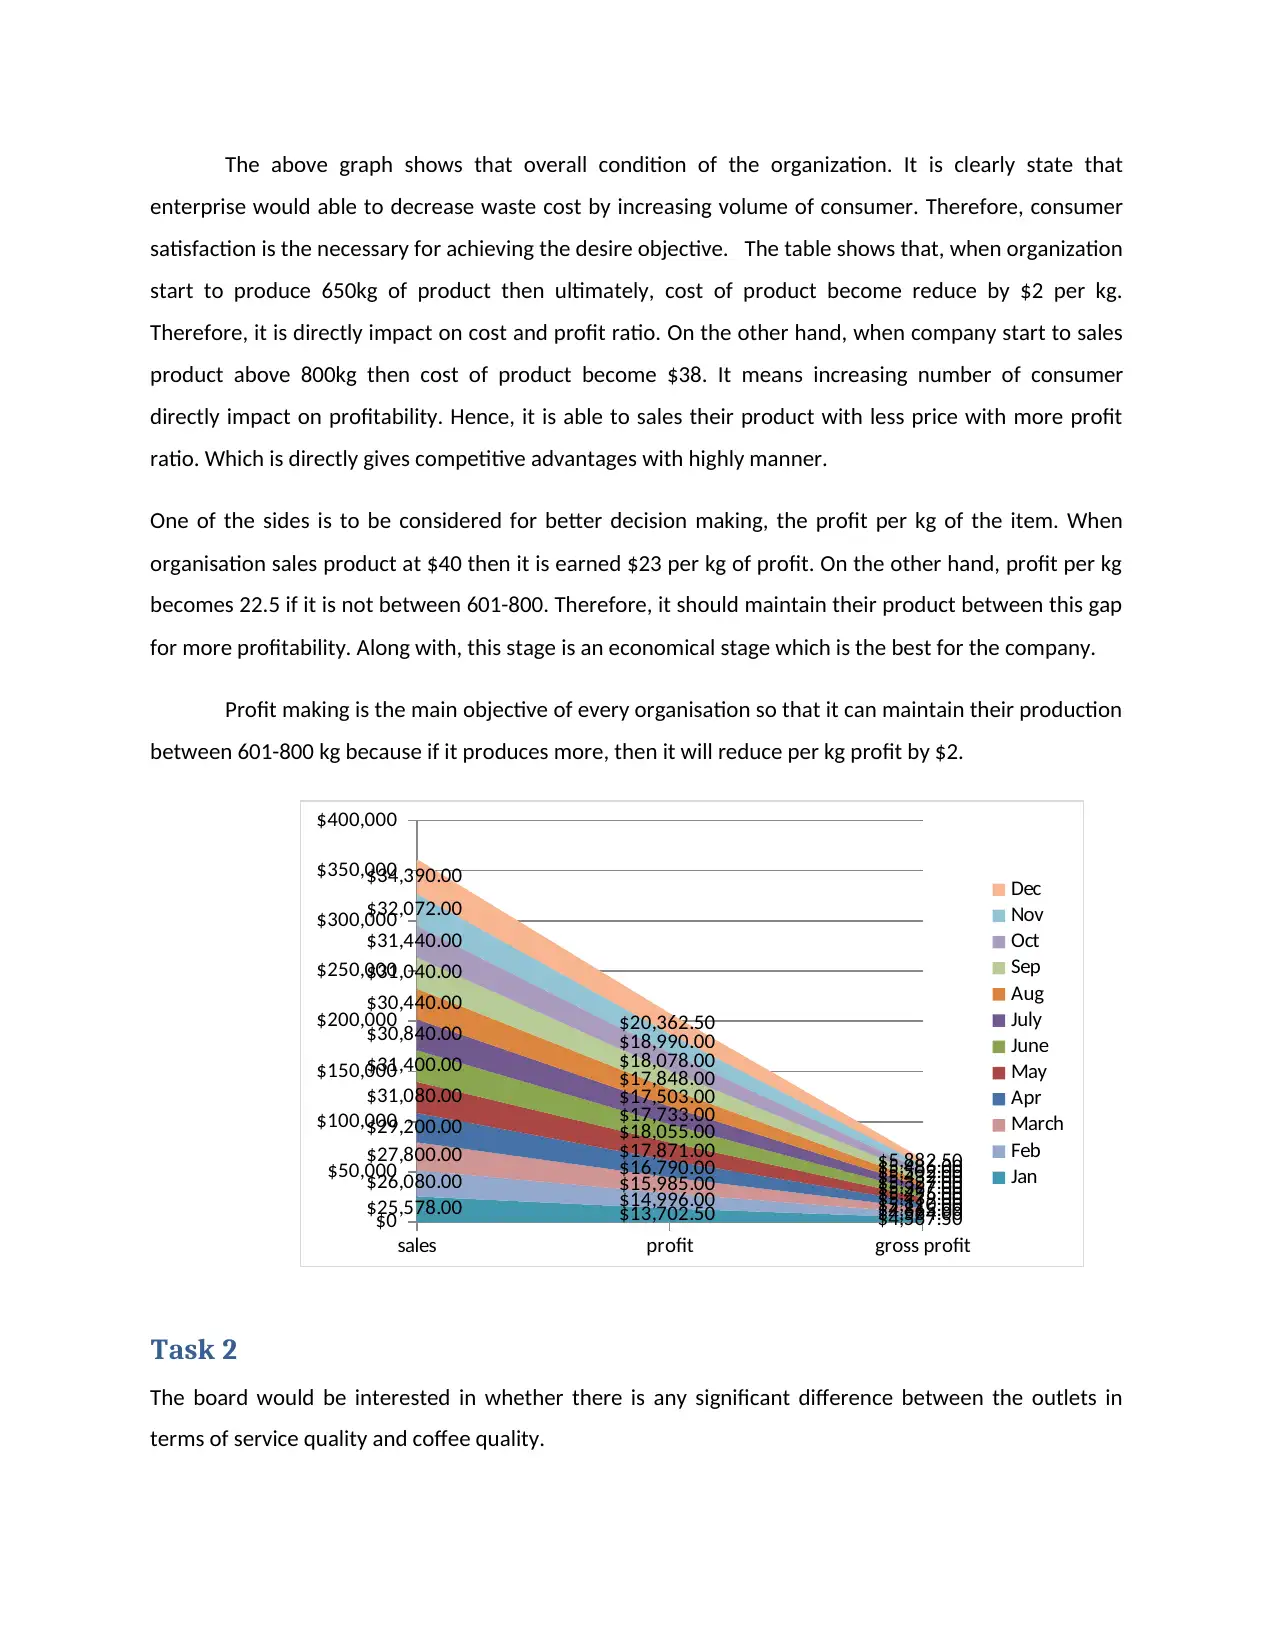
The above graph shows that overall condition of the organization. It is clearly state that
enterprise would able to decrease waste cost by increasing volume of consumer. Therefore, consumer
satisfaction is the necessary for achieving the desire objective. The table shows that, when organization
start to produce 650kg of product then ultimately, cost of product become reduce by $2 per kg.
Therefore, it is directly impact on cost and profit ratio. On the other hand, when company start to sales
product above 800kg then cost of product become $38. It means increasing number of consumer
directly impact on profitability. Hence, it is able to sales their product with less price with more profit
ratio. Which is directly gives competitive advantages with highly manner.
One of the sides is to be considered for better decision making, the profit per kg of the item. When
organisation sales product at $40 then it is earned $23 per kg of profit. On the other hand, profit per kg
becomes 22.5 if it is not between 601-800. Therefore, it should maintain their product between this gap
for more profitability. Along with, this stage is an economical stage which is the best for the company.
Profit making is the main objective of every organisation so that it can maintain their production
between 601-800 kg because if it produces more, then it will reduce per kg profit by $2.
sales profit gross profit
$0
$50,000
$100,000
$150,000
$200,000
$250,000
$300,000
$350,000
$400,000
$25,578.00 $13,702.50 $4,567.50
$26,080.00 $14,996.00 $4,564.00
$27,800.00
$15,985.00
$4,865.00
$29,200.00
$16,790.00
$5,110.00
$31,080.00
$17,871.00
$5,439.00
$31,400.00
$18,055.00
$5,495.00
$30,840.00
$17,733.00
$5,397.00
$30,440.00
$17,503.00
$5,327.00
$31,040.00
$17,848.00
$5,432.00
$31,440.00
$18,078.00
$5,502.00
$32,072.00
$18,990.00
$5,486.00
$34,390.00
$20,362.50
$5,882.50
Dec
Nov
Oct
Sep
Aug
July
June
May
Apr
March
Feb
Jan
Task 2
The board would be interested in whether there is any significant difference between the outlets in
terms of service quality and coffee quality.
Outlet Service Coffee Frequenc
y
1 3 4 c
1 4 4 c
2 5 4 d
1 4 5 d
1 5 4 d
1 4 5 d
2 5 5 c
1 4 5 c
2 5 5 c
2 1 2 a
1 4 5 d
2 3 3 b
1 4 5 d
1 4 5 d
2 5 5 d
1 4 5 c
2 5 3 A
1 4 3 A
2 3 3 b
2 5 4 a
1 5 4 d
2 5 4 b
1 3 4 b
2 3 3 B
1 4 3 B
2 4 4 A
1 5 3 B
2 5 5 c
1 4 5 d
1 4 5 d
y
1 3 4 c
1 4 4 c
2 5 4 d
1 4 5 d
1 5 4 d
1 4 5 d
2 5 5 c
1 4 5 c
2 5 5 c
2 1 2 a
1 4 5 d
2 3 3 b
1 4 5 d
1 4 5 d
2 5 5 d
1 4 5 c
2 5 3 A
1 4 3 A
2 3 3 b
2 5 4 a
1 5 4 d
2 5 4 b
1 3 4 b
2 3 3 B
1 4 3 B
2 4 4 A
1 5 3 B
2 5 5 c
1 4 5 d
1 4 5 d
⊘ This is a preview!⊘
Do you want full access?
Subscribe today to unlock all pages.
Trusted by 1+ million students worldwide
2 4 5 d
2 3 5 c
2 5 5 c
1 5 5 c
2 2 5 c
1 4 5 c
2 5 5 c
1 5 5 d
1 5 4 c
2 4 4 c
1 4 4 c
2 4 4 c
1 3 4 b
1 5 4 b
1 5 4 b
2 4 4 b
2 4 4 b
1 5 4 b
1 5 3 A
2 3 4 b
2 2 5 b
1 4 5 d
1 4 5 c
1 1 3 a
1 2 3 a
1 4 5 d
1 5 3 b
1 3 4 d
1 5 4 d
1 5 5 d
1 4 3 c
1 4 5 d
1 5 3 c
2 3 5 c
2 5 5 c
1 5 5 c
2 2 5 c
1 4 5 c
2 5 5 c
1 5 5 d
1 5 4 c
2 4 4 c
1 4 4 c
2 4 4 c
1 3 4 b
1 5 4 b
1 5 4 b
2 4 4 b
2 4 4 b
1 5 4 b
1 5 3 A
2 3 4 b
2 2 5 b
1 4 5 d
1 4 5 c
1 1 3 a
1 2 3 a
1 4 5 d
1 5 3 b
1 3 4 d
1 5 4 d
1 5 5 d
1 4 3 c
1 4 5 d
1 5 3 c
Paraphrase This Document
Need a fresh take? Get an instant paraphrase of this document with our AI Paraphraser
1 5 3 c
2 1 1 b
2 3 3 c
2 5 4 d
2 4 5 d
2 3 3 c
2 5 5 d
2 2 2 c
2 3 3 b
2 5 4 c
2 4 4 c
2 5 3 d
2 4 4 d
2 5 3 d
2 2 4 d
2 2 4 b
2 3 3 a
2 3 4 a
total 319s 326c
Interpretation
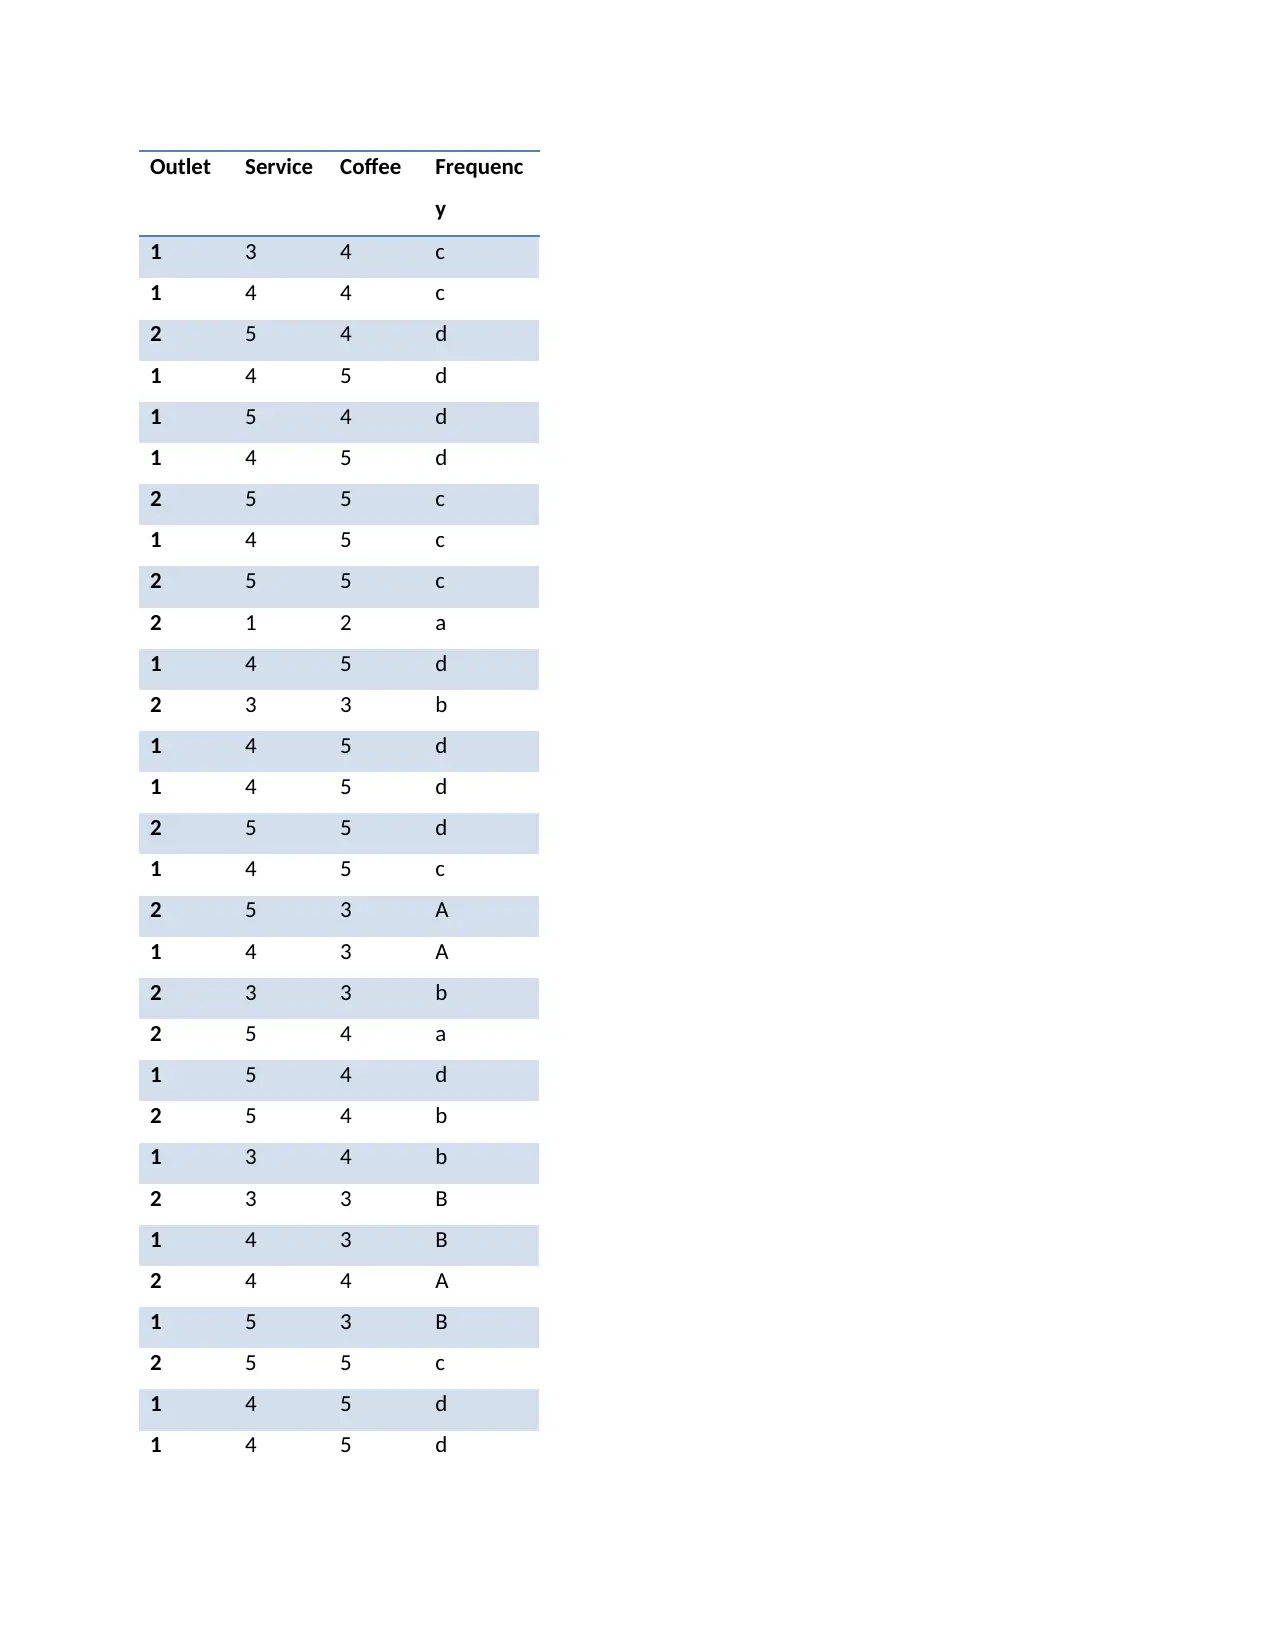
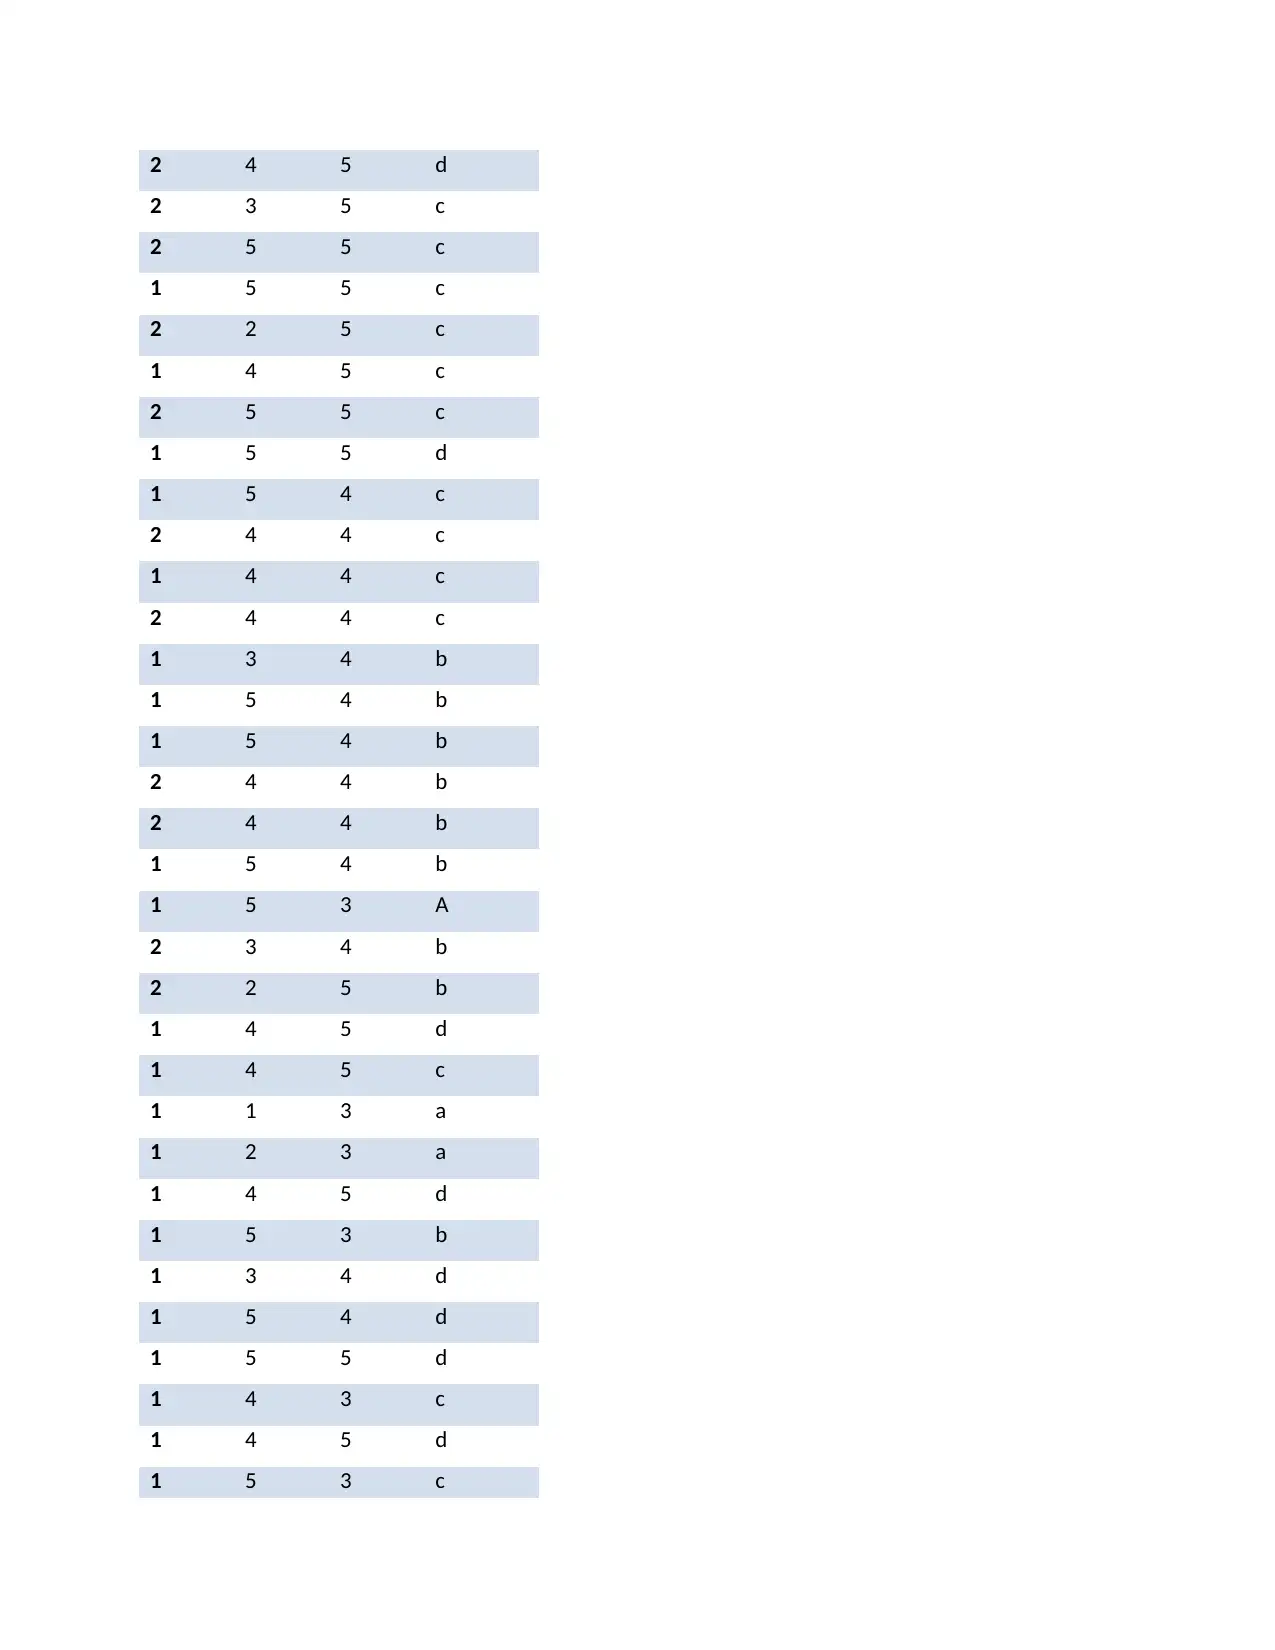
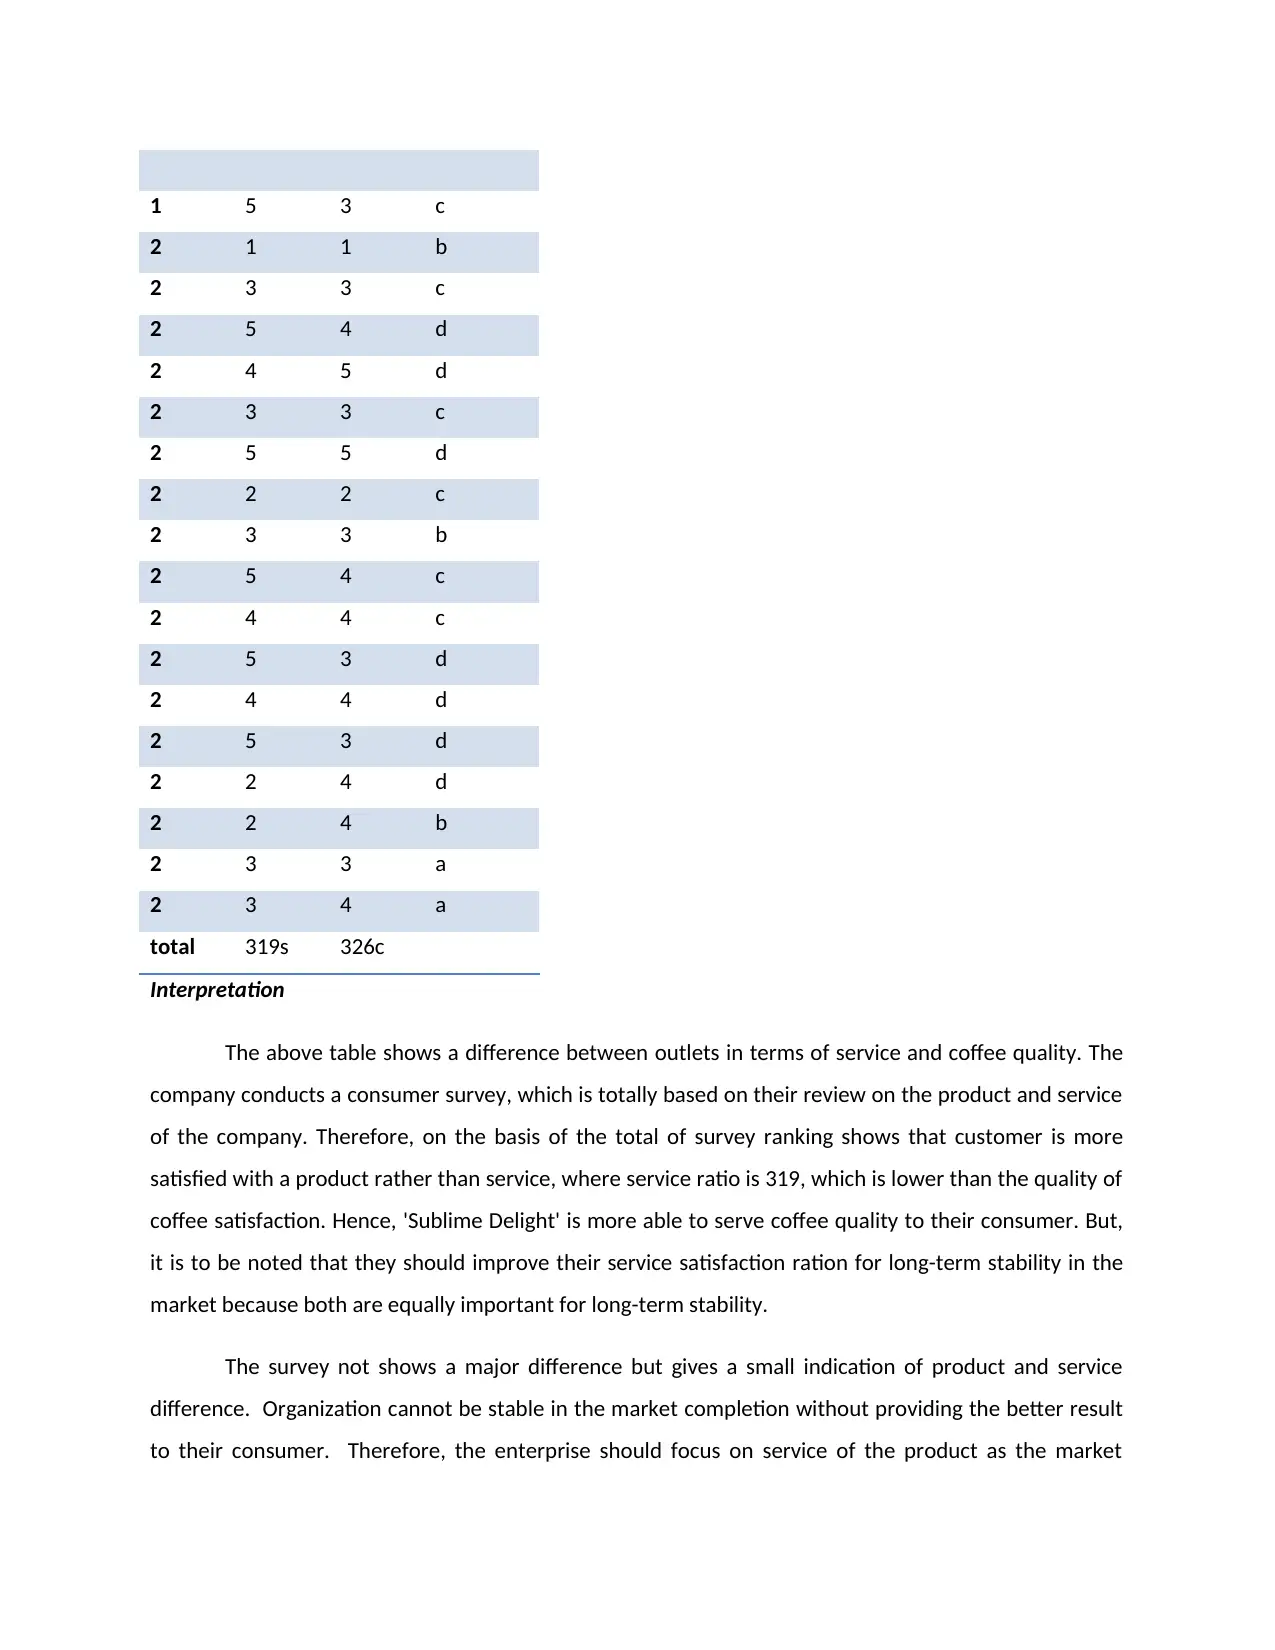
The above table shows a difference between outlets in terms of service and coffee quality. The
company conducts a consumer survey, which is totally based on their review on the product and service
of the company. Therefore, on the basis of the total of survey ranking shows that customer is more
satisfied with a product rather than service, where service ratio is 319, which is lower than the quality of
coffee satisfaction. Hence, 'Sublime Delight' is more able to serve coffee quality to their consumer. But,
it is to be noted that they should improve their service satisfaction ration for long-term stability in the
market because both are equally important for long-term stability.
The survey not shows a major difference but gives a small indication of product and service
difference. Organization cannot be stable in the market completion without providing the better result
to their consumer. Therefore, the enterprise should focus on service of the product as the market
2 1 1 b
2 3 3 c
2 5 4 d
2 4 5 d
2 3 3 c
2 5 5 d
2 2 2 c
2 3 3 b
2 5 4 c
2 4 4 c
2 5 3 d
2 4 4 d
2 5 3 d
2 2 4 d
2 2 4 b
2 3 3 a
2 3 4 a
total 319s 326c
Interpretation
The above table shows a difference between outlets in terms of service and coffee quality. The
company conducts a consumer survey, which is totally based on their review on the product and service
of the company. Therefore, on the basis of the total of survey ranking shows that customer is more
satisfied with a product rather than service, where service ratio is 319, which is lower than the quality of
coffee satisfaction. Hence, 'Sublime Delight' is more able to serve coffee quality to their consumer. But,
it is to be noted that they should improve their service satisfaction ration for long-term stability in the
market because both are equally important for long-term stability.
The survey not shows a major difference but gives a small indication of product and service
difference. Organization cannot be stable in the market completion without providing the better result
to their consumer. Therefore, the enterprise should focus on service of the product as the market
requirement. Management should be focused on what consumer wanted from a company. Delay in
service may lose to enterprise with high manner.
On the other hand, the company should monitor their human resources and other resources to
maintain co-ordinance between quality and service. It is very important for stability in competition
market. Therefore, without correlated, it is not possible to provide better satisfaction to their regular
consumers so that it will not be able to invite new consumers. Ultimately, it majorly harms to the
organization.
Along with, above table also shows, frequency of purchase, which is totally based on the quality
and service provided by the enterprise. In this survey, frequency of purchase would be higher as the
level of consumer satisfaction. Customer who gives low rating, frequency of purchase is as same. Hence,
sales and profits totally depend on better service and quality of the products which is provided by the
organization to their consumer.
Also, complaint of a consumer is also necessary to be considered because of better satisfaction only
possible by timely solved complaints. In case, the enterprise is not able to solve it in better manner, then
it will reduce the image and finally decreases its volume of sale.
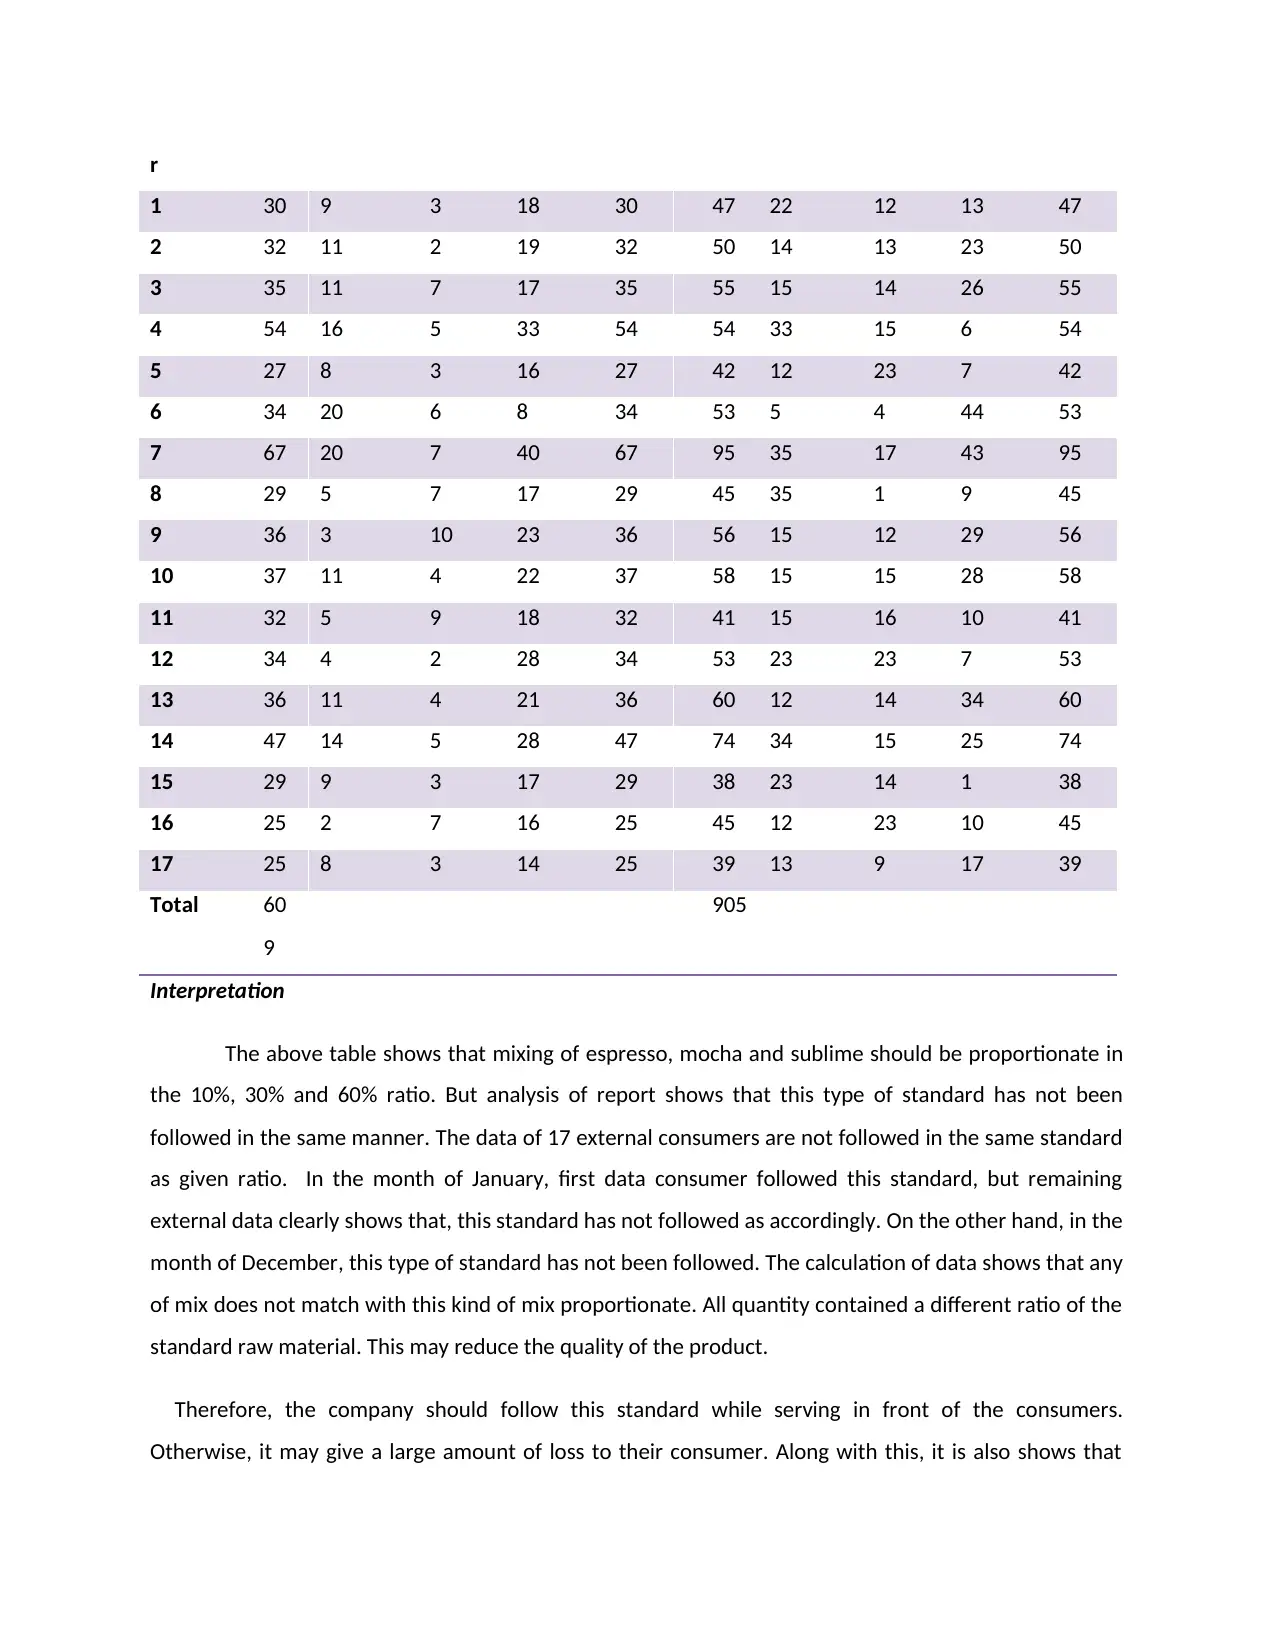
TASK 3
The data in DATASET 3 covers the type of bean mix supplied to external outlets in January and
December of 2015. A market analysis done in mid 2014 suggested that the mix would be 30%
Espresso, 10% Mocha and 60% Sublime
Orders
2015
2015
Jan Espresso Moch
a
Sublim
e
Tota
l
De
c
Espress
o
Moch
a
Sublim
e
Tota
l
External
Custome
service may lose to enterprise with high manner.
On the other hand, the company should monitor their human resources and other resources to
maintain co-ordinance between quality and service. It is very important for stability in competition
market. Therefore, without correlated, it is not possible to provide better satisfaction to their regular
consumers so that it will not be able to invite new consumers. Ultimately, it majorly harms to the
organization.
Along with, above table also shows, frequency of purchase, which is totally based on the quality
and service provided by the enterprise. In this survey, frequency of purchase would be higher as the
level of consumer satisfaction. Customer who gives low rating, frequency of purchase is as same. Hence,
sales and profits totally depend on better service and quality of the products which is provided by the
organization to their consumer.
Also, complaint of a consumer is also necessary to be considered because of better satisfaction only
possible by timely solved complaints. In case, the enterprise is not able to solve it in better manner, then
it will reduce the image and finally decreases its volume of sale.
TASK 3
The data in DATASET 3 covers the type of bean mix supplied to external outlets in January and
December of 2015. A market analysis done in mid 2014 suggested that the mix would be 30%
Espresso, 10% Mocha and 60% Sublime
Orders
2015
2015
Jan Espresso Moch
a
Sublim
e
Tota
l
De
c
Espress
o
Moch
a
Sublim
e
Tota
l
External
Custome
⊘ This is a preview!⊘
Do you want full access?
Subscribe today to unlock all pages.
Trusted by 1+ million students worldwide
r
1 30 9 3 18 30 47 22 12 13 47
2 32 11 2 19 32 50 14 13 23 50
3 35 11 7 17 35 55 15 14 26 55
4 54 16 5 33 54 54 33 15 6 54
5 27 8 3 16 27 42 12 23 7 42
6 34 20 6 8 34 53 5 4 44 53
7 67 20 7 40 67 95 35 17 43 95
8 29 5 7 17 29 45 35 1 9 45
9 36 3 10 23 36 56 15 12 29 56
10 37 11 4 22 37 58 15 15 28 58
11 32 5 9 18 32 41 15 16 10 41
12 34 4 2 28 34 53 23 23 7 53
13 36 11 4 21 36 60 12 14 34 60
14 47 14 5 28 47 74 34 15 25 74
15 29 9 3 17 29 38 23 14 1 38
16 25 2 7 16 25 45 12 23 10 45
17 25 8 3 14 25 39 13 9 17 39
Total 60
9
905
Interpretation
The above table shows that mixing of espresso, mocha and sublime should be proportionate in
the 10%, 30% and 60% ratio. But analysis of report shows that this type of standard has not been
followed in the same manner. The data of 17 external consumers are not followed in the same standard
as given ratio. In the month of January, first data consumer followed this standard, but remaining
external data clearly shows that, this standard has not followed as accordingly. On the other hand, in the
month of December, this type of standard has not been followed. The calculation of data shows that any
of mix does not match with this kind of mix proportionate. All quantity contained a different ratio of the
standard raw material. This may reduce the quality of the product.
Therefore, the company should follow this standard while serving in front of the consumers.
Otherwise, it may give a large amount of loss to their consumer. Along with this, it is also shows that
Paraphrase This Document
Need a fresh take? Get an instant paraphrase of this document with our AI Paraphraser
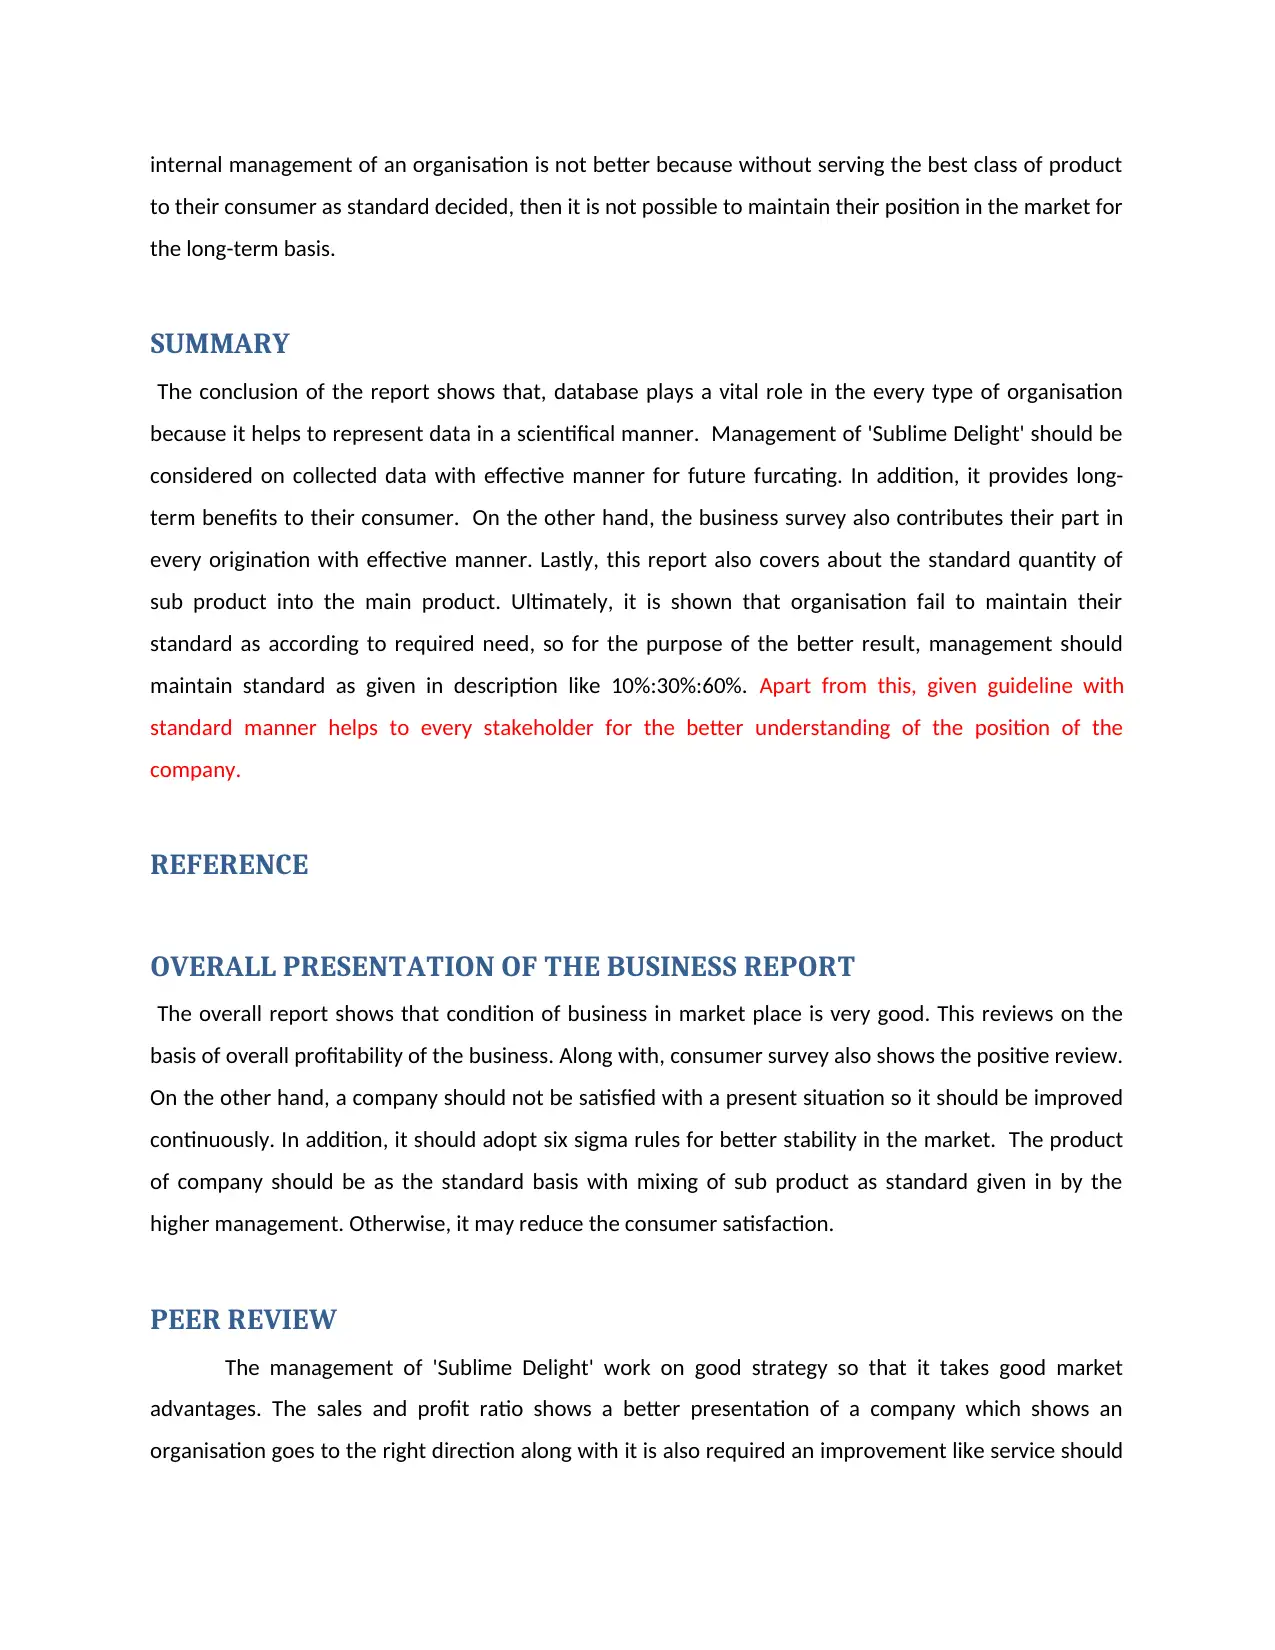
internal management of an organisation is not better because without serving the best class of product
to their consumer as standard decided, then it is not possible to maintain their position in the market for
the long-term basis.
SUMMARY
The conclusion of the report shows that, database plays a vital role in the every type of organisation
because it helps to represent data in a scientifical manner. Management of 'Sublime Delight' should be
considered on collected data with effective manner for future furcating. In addition, it provides long-
term benefits to their consumer. On the other hand, the business survey also contributes their part in
every origination with effective manner. Lastly, this report also covers about the standard quantity of
sub product into the main product. Ultimately, it is shown that organisation fail to maintain their
standard as according to required need, so for the purpose of the better result, management should
maintain standard as given in description like 10%:30%:60%. Apart from this, given guideline with
standard manner helps to every stakeholder for the better understanding of the position of the
company.
REFERENCE
OVERALL PRESENTATION OF THE BUSINESS REPORT
The overall report shows that condition of business in market place is very good. This reviews on the
basis of overall profitability of the business. Along with, consumer survey also shows the positive review.
On the other hand, a company should not be satisfied with a present situation so it should be improved
continuously. In addition, it should adopt six sigma rules for better stability in the market. The product
of company should be as the standard basis with mixing of sub product as standard given in by the
higher management. Otherwise, it may reduce the consumer satisfaction.
PEER REVIEW
The management of 'Sublime Delight' work on good strategy so that it takes good market
advantages. The sales and profit ratio shows a better presentation of a company which shows an
organisation goes to the right direction along with it is also required an improvement like service should
be coordinated with a quality of the product, improve more consumer satisfaction and maintain
standard while producing the product. Lastly, it is work with right direction with satisfactory manner.
Apart from this, on the basis of the given data, the organisation should follow the instruction as the fair
manner for the purpose of achieving the desired target. The above chart shows that organisation is able
to serve the best class service. On the other hand, service chart becomes lower so it ought to equal both
for fair operation.
⊘ This is a preview!⊘
Do you want full access?
Subscribe today to unlock all pages.
Trusted by 1+ million students worldwide
1 out of 12
Related Documents


Your All-in-One AI-Powered Toolkit for Academic Success.
+13062052269
info@desklib.com
Available 24*7 on WhatsApp / Email
![[object Object]](/_next/static/media/star-bottom.7253800d.svg)
Unlock your academic potential
Copyright © 2020–2026 A2Z Services. All Rights Reserved. Developed and managed by ZUCOL.