Practical Report: Succinate Dehydrogenase Assay - SLE206
VerifiedAdded on 2023/06/07
|14
|3803
|362
Practical Assignment
AI Summary
This report details a laboratory experiment focused on the Succinate Dehydrogenase (SDH) assay, a crucial component of cellular respiration. The experiment aimed to measure the activity rate of SDH in catalyzing the conversion of succinate to fumarate in vitro, using a mitochondrial fraction extracted from cauliflower cells. The activity was measured by observing the reduction of 2,6-dichlorophenolindphenol (DCPIP), an artificial electron acceptor. The experiment involved isolating mitochondria, preparing enzyme solutions with varying concentrations, and testing the effects of a competitive inhibitor (malonate) and sodium azide. Absorbance readings were taken at regular intervals using a spectrophotometer, allowing the determination of initial reaction velocities and the impact of inhibitors on enzyme activity. The results, presented in tables and figures, illustrate the relationship between enzyme concentration, reaction rate, and the influence of inhibitors, providing insights into enzyme kinetics and the function of mitochondria in cellular processes. The experiment utilized differential centrifugation for isolating liver cell components and assessing succinate dehydrogenase presence, using the Bradford assay for protein quantification.

SUCCINATE DEHYDROGENASE ASSAY
By Name
Course
Instructor
Institution
Location
Date
By Name
Course
Instructor
Institution
Location
Date
Paraphrase This Document
Need a fresh take? Get an instant paraphrase of this document with our AI Paraphraser
SUCCINATE DEHYDROGENASE ASSAY
Introduction
The mitochondrion is usually known to be the powerhouse of any living cells in the body of an
organism. It is composed of all the required machinery in the provision of the cells as well as
their components with the energy that is needed to carry out the various cellular processes
including movement, growth and development among other vital processes of the cell. The
matrix of the mitochondrion forms the base on which TCA cycles takes place, where pyruvate
which is oxidize from glucose in glycolysis processes ins changed into acetyl-CoA, which is then
fed into the pathway to undergo oxidation releasing carbon dioxide and the conserved (Aspuria
et al., 2014).
Succinate dehydrogenase remains the only enzyme rom the TCA cycle which is as well part of
the electron transport system hence it is often located on the inner membrane. Succinate
dehydrogenase has a co-enzyme, flavin adenine dinucleotiede all of which are represented as a
complex E-FAD and work by oxidizing the metabolite succinate to form fumarate. Succinate
dehydrogenase eliminates the electrons from succinate leading to a reduction in FAD and thus a
decrease in the enzyme complex E-FADH2. The reduced enzyme in turn transfers electrons to
coenzyme Q from which it is takes through the remaining chain of electron transport (Calió et
al., 2017).
Succinate dehydrogenase is an enzyme that is located in the inner membrane. The location
makes it a very easy target for isolation when conducting a study on the citric acid cycle. The
main role of the enzyme in the cell is to oxidize succinate to form fumarate which is then usable
as a marker during the process of isolation of mitochondria via differential centrifugation. The
isolated mitochondria can then be treated using a sodium azide reagent to prevent transportation
of electron of the mitochondrion in the cell extract.
An artificial electron acceptor is often used in taking the measurement of the activity of an
enzyme (2, 6-dichlorophenolindphenol, DCPIP), which is used in the acceptance of two
electrons. Upon reception of electrons, the oxidised 2, 6-dichlorophenolindphenol undergoes
reduction and the colour of the mixture turns to colourless from blue (Dudek et al., 2015). The
change in the colour can be quantified suing spectrometry at a range of 600nm which then
provides the contents of mitochondria in the given sample.
Enzymes serve as regulators for the various metabolic pathways which reduce the activation
energy so as to catalyze acceleration in the rate of biochemical reactions. Most of the enzymes
are characterized as demonstrating Michaelis-Menten (M-M) kinetic characteristics. Enzymes
work by creating a binding with their substrates in a reversible manner thereby altering the
conformation of the substrate leading to the formation of a complex of enzyme-substrate and
hence detaching resulting in free enzyme and the product. In cases where the concentration of the
substrate is low, little enzyme activity is noticed and thus a slow rate of reaction (Guzzo et al.,
2014).
On the contrary, a high concentration of the substrate or when the substrate has a saturated
concentration, the enzymes tend to be more active and hence a faster rate of reaction. At some
point when the substrate concentration is highly saturated, where is recorded no increase in the
rate of the reaction. Alongside the concentration of the substrate, these changes could be featured
as the Michaelis-Menten (M-M) constant as well as the maximum velocity (Lampropoulou et al.,
2016). These factors form an integral part of the factors which influence the initial velocity of
⊘ This is a preview!⊘
Do you want full access?
Subscribe today to unlock all pages.
Trusted by 1+ million students worldwide
any biochemical reactions and thus contributing to an elaborate understanding of the Michaelis-
Menten (M-M) equation.
Nonetheless, in the presence of a competitive inhibitor, the inhibitor is able to bind to the active
site as to stop the normal substrate from making a bind and forming the product. This leads to a
competition between the substrate and the product for the active site of the enzyme, a dynamic
that is based on the Michaelis-Menten (M-M) equation and permits the maximum velocity to
remain constant even as the Michaelis-Menten (M-M) constant changes (Kim et al., 2015).
The role of this laboratory experiment was measurement of the activity rate of succinate
dehydrogenase in the catalysis of the reaction succinate to form fumarate in vitiro with the aid of
mitochondrial fraction extracted from cauliflower cells. The measurement of the rate of the
reaction is done through making observations on the reduction of 2, 6-dichlorophenolindphenol
which is an artificial electron acceptor as opposed to coenzyme Q.
Sodium azide blocks are added to the electron systems to ensure that the electrons are
empowered to reduce the concentration of coenzyme Q (Kitazawa et al., 2017). The electrons are
rather transported to 2, 6-dichlorophenolindphenol from E-FADH2. A colour change of the 2, 6-
dichlorophenolindphenol would be used to identify its reduction where the oxidized form of the
acceptor is often blue in colour which changes to colourless upon being reduced. The equation of
the reduction is as shown below:
E-FADH2+DCPIPox (blue) E-FADH2+DCPIPre (colourless)
The degree of oxidation of the 2, 6-dichlorophenolindphenol DCIP is measured using the various
absorbances of the various concentrations of enzymes through the use of a spectrophotometer at
600nm.
Paraphrase This Document
Need a fresh take? Get an instant paraphrase of this document with our AI Paraphraser
The tubes 1 to 3 are used in testing the initial velocities of the reaction when it begins from
succinate to fumarate of the various concentrations of enzymes having the same quantity of
succinate. The initial velocities of the reaction change with changes in the concentration of the
enzymes. The tube labelled 4 is used in testing the effect of a competitive inhibitor (Malonate for
this experiment) on the level of activity of an enzyme.
The tube labelled 5 does not have sodium azide blocks added to the normal electron path in the
chain of electron transport and is thus used for the purposes of making comparison of the rates of
reaction against those tubes which contain sodium azide blocks (Lampropoulou et al., 2016). The
tube labelled 6 is used in the testing of the rate of reaction in which succinate is not added while
the tube labelled 7 has been heated inside a hot water bath so as to kill or denature the enzyme
succinate dehydrogenase thereby bringing it to an inactivated state.
This tube is then adopted as the 0-minute mark of reading for all the other tubes in taking the
measurement of the changes in the absorbance since as it undergoes cooling; it changes into its
original conformation. This serves to be representing the enzymes before the occurrence of a
reaction.
The variation in the absorbance across the 35 minutes of the experiments should demonstrate the
variations in the rates of reaction as per the differences in the concentration of enzyme. It should
as well indicate the rate of a reaction is slowed with the presence of competitive inhibitors or the
absences of the enzyme blockers (sodium azide for this experiment) and substrate
(Lampropoulou et al., 2016).
Experiment Aim
The experiment aims at separating the components of the liver cells based on the using
differential centrifugation
Experiment Objectives
Determine which components of the liver cells contain succinate dehydrogenase
Identification of the factions that contain mitochondria
Materials and Methods
1. Mitochondria was isolated
2. The suspension was filtered using cheesecloth and the centrifuged at about 600g for 10
minutes at 4⁰C
3. The post mitochondrial supernatant fluid was discarded
4. The pellet was scraped from the use and the sediment resuspended in the medium of
assay using a pipette. It was kept in ice bath
5. The 10 cuvettes were labelled as per the table below. 0.6 mL of the solution was heated
for the case of tube 7 for about 5 minutes after which it was cooled in an ice bath.
6. The spectrophotometer was set at 600 nm (Li et al., 2016)
7. The appropriate volume of the medium of assay was added and the different solutions as
indicated in the table below were as well added expect mitochondrial suspension.
8. The tube was covered using parafilm and the inverted so as to ensure thorough mixing of
the contents
9. The accurate volume of the mitochondrial suspension was then added to the fist cuvette
as per the table and the turned upside down so as to ensure thorough mixing.
⊘ This is a preview!⊘
Do you want full access?
Subscribe today to unlock all pages.
Trusted by 1+ million students worldwide
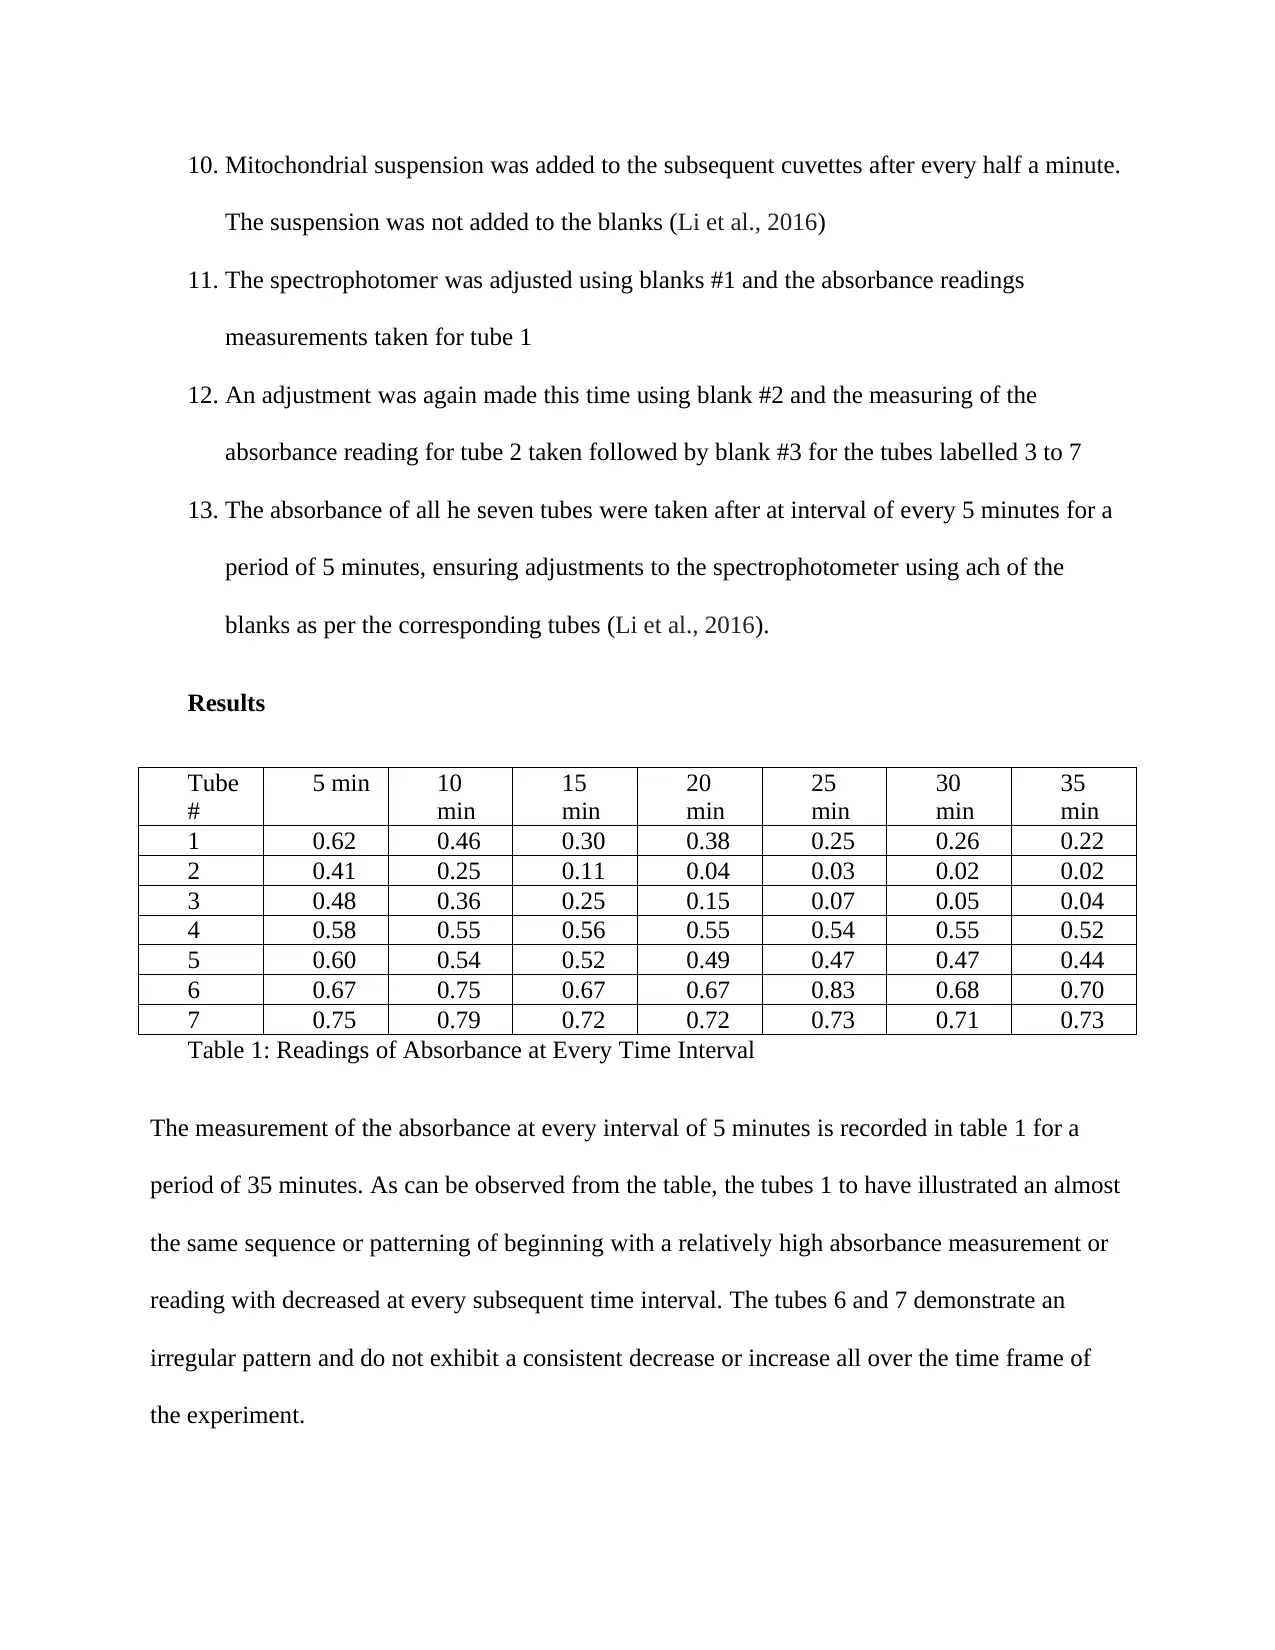
10. Mitochondrial suspension was added to the subsequent cuvettes after every half a minute.
The suspension was not added to the blanks (Li et al., 2016)
11. The spectrophotomer was adjusted using blanks #1 and the absorbance readings
measurements taken for tube 1
12. An adjustment was again made this time using blank #2 and the measuring of the
absorbance reading for tube 2 taken followed by blank #3 for the tubes labelled 3 to 7
13. The absorbance of all he seven tubes were taken after at interval of every 5 minutes for a
period of 5 minutes, ensuring adjustments to the spectrophotometer using ach of the
blanks as per the corresponding tubes (Li et al., 2016).
Results
Tube
#
5 min 10
min
15
min
20
min
25
min
30
min
35
min
1 0.62 0.46 0.30 0.38 0.25 0.26 0.22
2 0.41 0.25 0.11 0.04 0.03 0.02 0.02
3 0.48 0.36 0.25 0.15 0.07 0.05 0.04
4 0.58 0.55 0.56 0.55 0.54 0.55 0.52
5 0.60 0.54 0.52 0.49 0.47 0.47 0.44
6 0.67 0.75 0.67 0.67 0.83 0.68 0.70
7 0.75 0.79 0.72 0.72 0.73 0.71 0.73
Table 1: Readings of Absorbance at Every Time Interval
The measurement of the absorbance at every interval of 5 minutes is recorded in table 1 for a
period of 35 minutes. As can be observed from the table, the tubes 1 to have illustrated an almost
the same sequence or patterning of beginning with a relatively high absorbance measurement or
reading with decreased at every subsequent time interval. The tubes 6 and 7 demonstrate an
irregular pattern and do not exhibit a consistent decrease or increase all over the time frame of
the experiment.
Paraphrase This Document
Need a fresh take? Get an instant paraphrase of this document with our AI Paraphraser
Tube
#
5 min 10
min
15
min
20
min
25
min
30
min
35
min
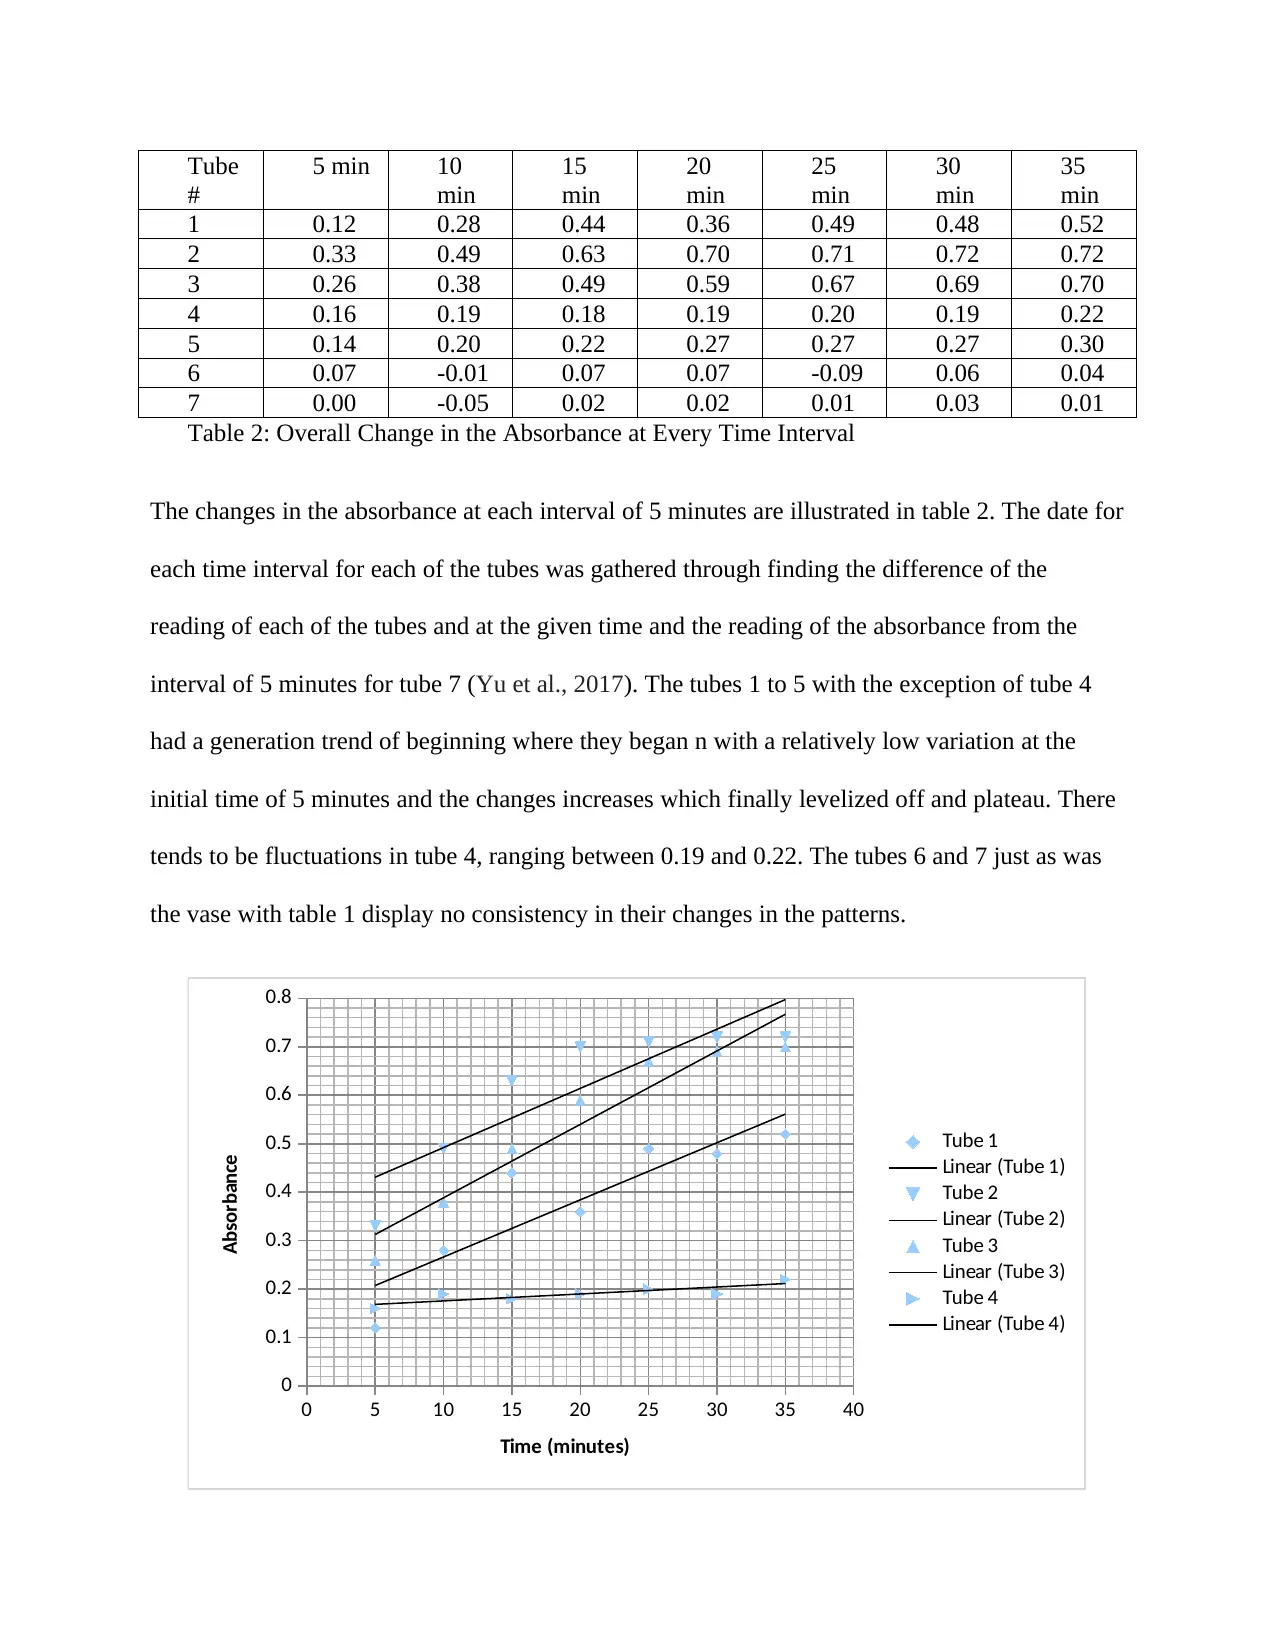
1 0.12 0.28 0.44 0.36 0.49 0.48 0.52
2 0.33 0.49 0.63 0.70 0.71 0.72 0.72
3 0.26 0.38 0.49 0.59 0.67 0.69 0.70
4 0.16 0.19 0.18 0.19 0.20 0.19 0.22
5 0.14 0.20 0.22 0.27 0.27 0.27 0.30
6 0.07 -0.01 0.07 0.07 -0.09 0.06 0.04
7 0.00 -0.05 0.02 0.02 0.01 0.03 0.01
Table 2: Overall Change in the Absorbance at Every Time Interval
The changes in the absorbance at each interval of 5 minutes are illustrated in table 2. The date for
each time interval for each of the tubes was gathered through finding the difference of the
reading of each of the tubes and at the given time and the reading of the absorbance from the
interval of 5 minutes for tube 7 (Yu et al., 2017). The tubes 1 to 5 with the exception of tube 4
had a generation trend of beginning where they began n with a relatively low variation at the
initial time of 5 minutes and the changes increases which finally levelized off and plateau. There
tends to be fluctuations in tube 4, ranging between 0.19 and 0.22. The tubes 6 and 7 just as was
the vase with table 1 display no consistency in their changes in the patterns.
0 5 10 15 20 25 30 35 40
0
0.1
0.2
0.3
0.4
0.5
0.6
0.7
0.8
Tube 1
Linear (Tube 1)
Tube 2
Linear (Tube 2)
Tube 3
Linear (Tube 3)
Tube 4
Linear (Tube 4)
Time (minutes)
Absorbance
#
5 min 10
min
15
min
20
min
25
min
30
min
35
min
1 0.12 0.28 0.44 0.36 0.49 0.48 0.52
2 0.33 0.49 0.63 0.70 0.71 0.72 0.72
3 0.26 0.38 0.49 0.59 0.67 0.69 0.70
4 0.16 0.19 0.18 0.19 0.20 0.19 0.22
5 0.14 0.20 0.22 0.27 0.27 0.27 0.30
6 0.07 -0.01 0.07 0.07 -0.09 0.06 0.04
7 0.00 -0.05 0.02 0.02 0.01 0.03 0.01
Table 2: Overall Change in the Absorbance at Every Time Interval
The changes in the absorbance at each interval of 5 minutes are illustrated in table 2. The date for
each time interval for each of the tubes was gathered through finding the difference of the
reading of each of the tubes and at the given time and the reading of the absorbance from the
interval of 5 minutes for tube 7 (Yu et al., 2017). The tubes 1 to 5 with the exception of tube 4
had a generation trend of beginning where they began n with a relatively low variation at the
initial time of 5 minutes and the changes increases which finally levelized off and plateau. There
tends to be fluctuations in tube 4, ranging between 0.19 and 0.22. The tubes 6 and 7 just as was
the vase with table 1 display no consistency in their changes in the patterns.
0 5 10 15 20 25 30 35 40
0
0.1
0.2
0.3
0.4
0.5
0.6
0.7
0.8
Tube 1
Linear (Tube 1)
Tube 2
Linear (Tube 2)
Tube 3
Linear (Tube 3)
Tube 4
Linear (Tube 4)
Time (minutes)
Absorbance
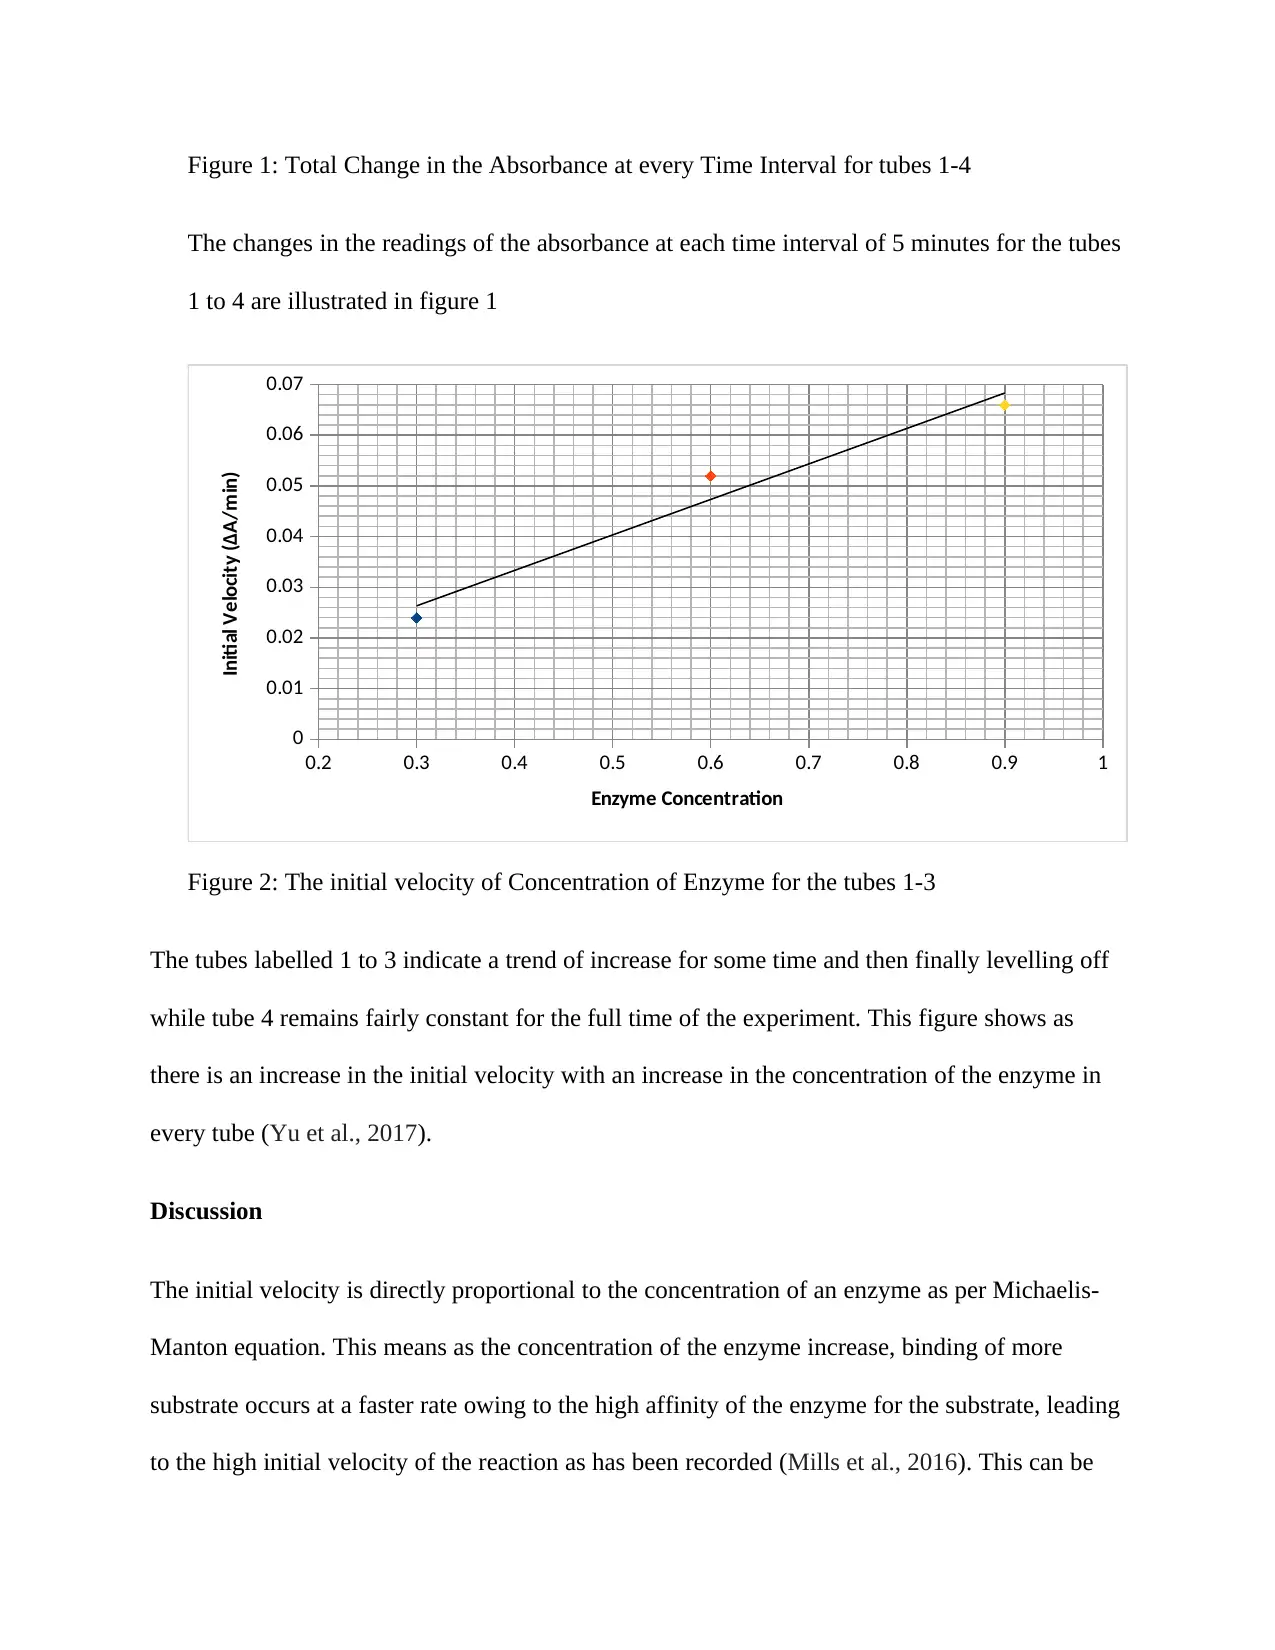
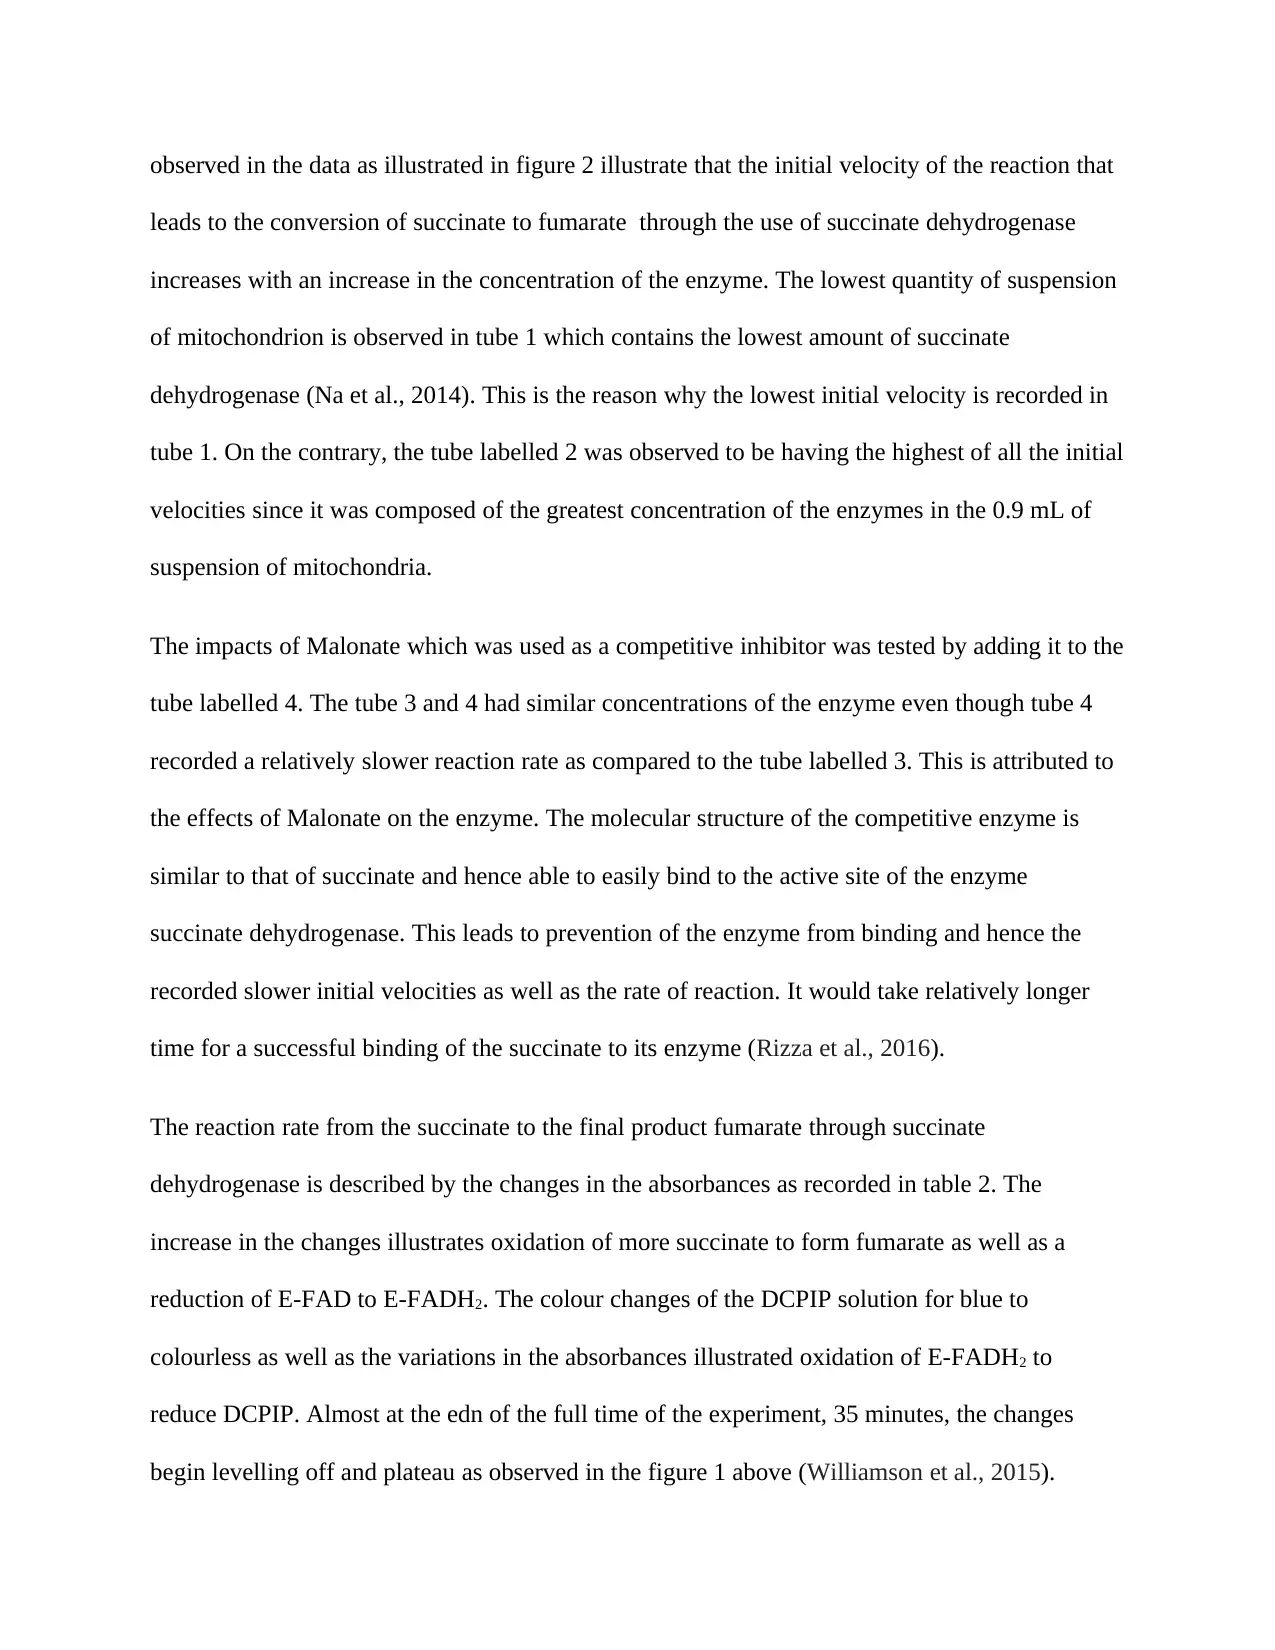
Figure 1: Total Change in the Absorbance at every Time Interval for tubes 1-4
The changes in the readings of the absorbance at each time interval of 5 minutes for the tubes
1 to 4 are illustrated in figure 1
0.2 0.3 0.4 0.5 0.6 0.7 0.8 0.9 1
0
0.01
0.02
0.03
0.04
0.05
0.06
0.07
Enzyme Concentration
Initial Velocity (∆A/min)
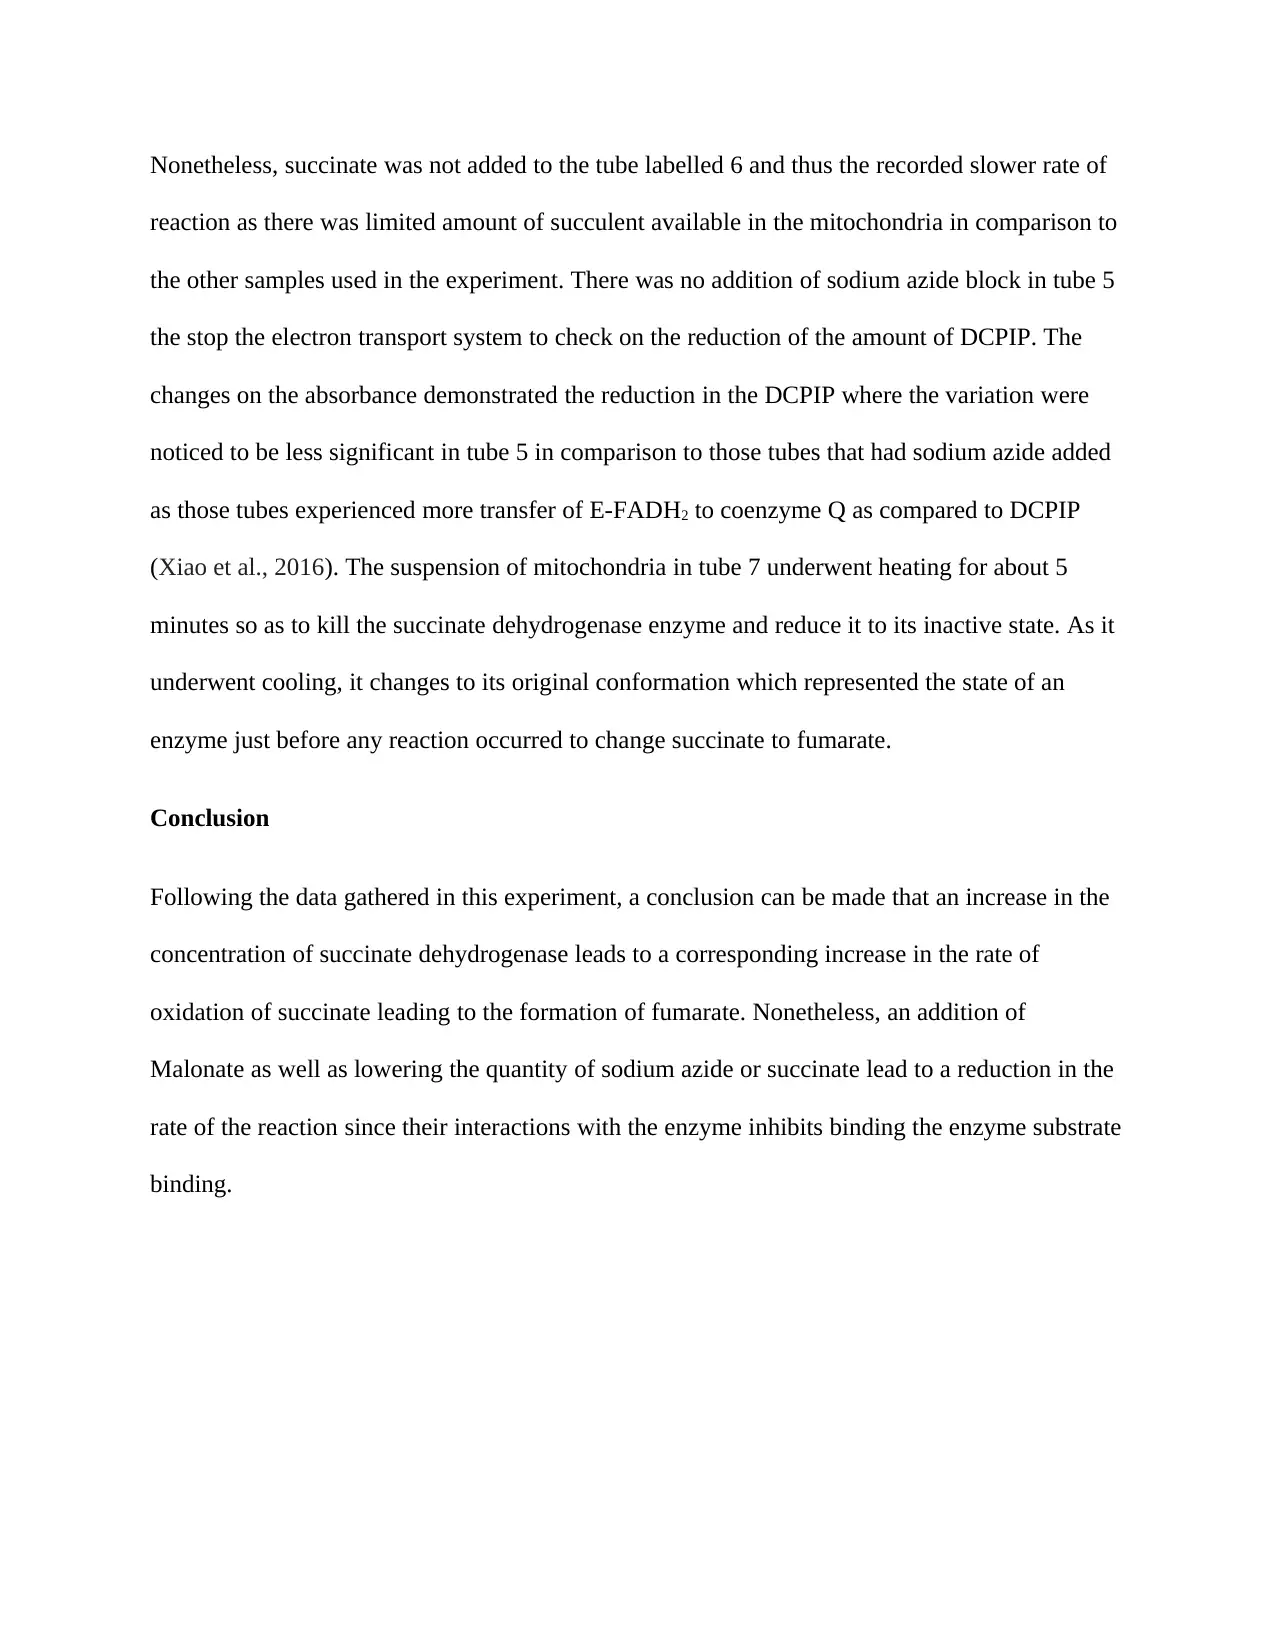
Figure 2: The initial velocity of Concentration of Enzyme for the tubes 1-3
The tubes labelled 1 to 3 indicate a trend of increase for some time and then finally levelling off
while tube 4 remains fairly constant for the full time of the experiment. This figure shows as
there is an increase in the initial velocity with an increase in the concentration of the enzyme in
every tube (Yu et al., 2017).
Discussion
The initial velocity is directly proportional to the concentration of an enzyme as per Michaelis-
Manton equation. This means as the concentration of the enzyme increase, binding of more
substrate occurs at a faster rate owing to the high affinity of the enzyme for the substrate, leading
to the high initial velocity of the reaction as has been recorded (Mills et al., 2016). This can be
The changes in the readings of the absorbance at each time interval of 5 minutes for the tubes
1 to 4 are illustrated in figure 1
0.2 0.3 0.4 0.5 0.6 0.7 0.8 0.9 1
0
0.01
0.02
0.03
0.04
0.05
0.06
0.07
Enzyme Concentration
Initial Velocity (∆A/min)
Figure 2: The initial velocity of Concentration of Enzyme for the tubes 1-3
The tubes labelled 1 to 3 indicate a trend of increase for some time and then finally levelling off
while tube 4 remains fairly constant for the full time of the experiment. This figure shows as
there is an increase in the initial velocity with an increase in the concentration of the enzyme in
every tube (Yu et al., 2017).
Discussion
The initial velocity is directly proportional to the concentration of an enzyme as per Michaelis-
Manton equation. This means as the concentration of the enzyme increase, binding of more
substrate occurs at a faster rate owing to the high affinity of the enzyme for the substrate, leading
to the high initial velocity of the reaction as has been recorded (Mills et al., 2016). This can be
⊘ This is a preview!⊘
Do you want full access?
Subscribe today to unlock all pages.
Trusted by 1+ million students worldwide
observed in the data as illustrated in figure 2 illustrate that the initial velocity of the reaction that
leads to the conversion of succinate to fumarate through the use of succinate dehydrogenase
increases with an increase in the concentration of the enzyme. The lowest quantity of suspension
of mitochondrion is observed in tube 1 which contains the lowest amount of succinate
dehydrogenase (Na et al., 2014). This is the reason why the lowest initial velocity is recorded in
tube 1. On the contrary, the tube labelled 2 was observed to be having the highest of all the initial
velocities since it was composed of the greatest concentration of the enzymes in the 0.9 mL of
suspension of mitochondria.
The impacts of Malonate which was used as a competitive inhibitor was tested by adding it to the
tube labelled 4. The tube 3 and 4 had similar concentrations of the enzyme even though tube 4
recorded a relatively slower reaction rate as compared to the tube labelled 3. This is attributed to
the effects of Malonate on the enzyme. The molecular structure of the competitive enzyme is
similar to that of succinate and hence able to easily bind to the active site of the enzyme
succinate dehydrogenase. This leads to prevention of the enzyme from binding and hence the
recorded slower initial velocities as well as the rate of reaction. It would take relatively longer
time for a successful binding of the succinate to its enzyme (Rizza et al., 2016).
The reaction rate from the succinate to the final product fumarate through succinate
dehydrogenase is described by the changes in the absorbances as recorded in table 2. The
increase in the changes illustrates oxidation of more succinate to form fumarate as well as a
reduction of E-FAD to E-FADH2. The colour changes of the DCPIP solution for blue to
colourless as well as the variations in the absorbances illustrated oxidation of E-FADH2 to
reduce DCPIP. Almost at the edn of the full time of the experiment, 35 minutes, the changes
begin levelling off and plateau as observed in the figure 1 above (Williamson et al., 2015).
Paraphrase This Document
Need a fresh take? Get an instant paraphrase of this document with our AI Paraphraser
Nonetheless, succinate was not added to the tube labelled 6 and thus the recorded slower rate of
reaction as there was limited amount of succulent available in the mitochondria in comparison to
the other samples used in the experiment. There was no addition of sodium azide block in tube 5
the stop the electron transport system to check on the reduction of the amount of DCPIP. The
changes on the absorbance demonstrated the reduction in the DCPIP where the variation were
noticed to be less significant in tube 5 in comparison to those tubes that had sodium azide added
as those tubes experienced more transfer of E-FADH2 to coenzyme Q as compared to DCPIP
(Xiao et al., 2016). The suspension of mitochondria in tube 7 underwent heating for about 5
minutes so as to kill the succinate dehydrogenase enzyme and reduce it to its inactive state. As it
underwent cooling, it changes to its original conformation which represented the state of an
enzyme just before any reaction occurred to change succinate to fumarate.
Conclusion
Following the data gathered in this experiment, a conclusion can be made that an increase in the
concentration of succinate dehydrogenase leads to a corresponding increase in the rate of
oxidation of succinate leading to the formation of fumarate. Nonetheless, an addition of
Malonate as well as lowering the quantity of sodium azide or succinate lead to a reduction in the
rate of the reaction since their interactions with the enzyme inhibits binding the enzyme substrate
binding.
References
Aspuria, P.J.P., Lunt, S.Y., Väremo, L., Vergnes, L., Gozo, M., Beach, J.A., Salumbides, B.,
Reue, K., Wiedemeyer, W.R., Nielsen, J. and Karlan, B.Y., 2014. Succinate dehydrogenase
inhibition leads to epithelial-mesenchymal transition and reprogrammed carbon
metabolism. Cancer & metabolism, 2(1), p.21
Calió, A., Grignon, D.J., Stohr, B.A., Williamson, S.R., Eble, J.N. and Cheng, L., 2017. Renal
cell carcinoma with TFE3 translocation and succinate dehydrogenase B mutation. Modern
Pathology, 30(3), p.407
Dudek, J., Cheng, I.F., Chowdhury, A., Wozny, K., Balleininger, M., Reinhold, R., Grunau, S.,
Callegari, S., Toischer, K., Wanders, R.J. and Hasenfuß, G., 2015. Cardiac‐specific succinate
dehydrogenase deficiency in Barth syndrome. EMBO molecular medicine, p.e201505644
Guzzo, G., Sciacovelli, M., Bernardi, P. and Rasola, A., 2014. Inhibition of succinate
dehydrogenase by the mitochondrial chaperone TRAP1 has anti-oxidant and anti-apoptotic
effects on tumor cells. Oncotarget, 5(23), p.11897
Kim, E., Rath, E.M., Tsang, V.H.M., Duff, A.P., Robinson, B.G., Church, W.B., Benn, D.E.,
Dwight, T. and Clifton-Bligh, R.J., 2015. Structural and functional consequences of succinate
dehydrogenase subunit B mutations. Endocrine-related cancer, 22(3), pp.387-397
Kitazawa, S., Ebara, S., Ando, A., Baba, Y., Satomi, Y., Soga, T. and Hara, T., 2017. Succinate
dehydrogenase B-deficient cancer cells are highly sensitive to bromodomain and extra-terminal
inhibitors. Oncotarget, 8(17), p.28922
⊘ This is a preview!⊘
Do you want full access?
Subscribe today to unlock all pages.
Trusted by 1+ million students worldwide
1 out of 14
Related Documents


Your All-in-One AI-Powered Toolkit for Academic Success.
+13062052269
info@desklib.com
Available 24*7 on WhatsApp / Email
![[object Object]](/_next/static/media/star-bottom.7253800d.svg)
Unlock your academic potential
Copyright © 2020–2026 A2Z Services. All Rights Reserved. Developed and managed by ZUCOL.