Detailed Analysis of Sugar Tax: Demand, Costs, and Policy Implications
VerifiedAdded on 2021/06/14
|10
|2275
|41
Report
AI Summary
This report provides an in-depth analysis of sugar tax policies, examining their impact on demand and supply, cost structures, and macroeconomic implications. The report begins with an analysis of water demand and supply, then moves on to a cost analysis of pizza production, covering fixed, variable, and marginal costs. The core of the report focuses on the economics of sugar taxes, evaluating their role in addressing negative externalities associated with sugary drinks, and the effectiveness of these taxes in reducing consumption and improving public health. It assesses the elasticity of demand for soft drinks, presents arguments for and against sugar taxes, and examines the real-world impact of sugar taxes, including case studies from Berkeley, California, and Chile. The report also reviews the impact of these taxes on consumer behavior and the generation of government revenue, and discusses the limitations and potential unintended consequences of sugar tax policies.
Running Head: Sugar Tax
Demand and Supply, Costs and Macroeconomic Policy Analysis
By (Name)
(Tutor)
(University)
(Date)
Demand and Supply, Costs and Macroeconomic Policy Analysis
By (Name)
(Tutor)
(University)
(Date)
Paraphrase This Document
Need a fresh take? Get an instant paraphrase of this document with our AI Paraphraser
Sugar Tax 2
Demand and Supply, Costs and Macroeconomic Policy Analysis
Question 1
16 17 18 19 20 21 22 23 24 25
0
0.1
0.2
0.3
0.4
0.5
0.6
0.7
0.8
0.9
Demand and Supply of water in Australia
Quantity (Million liters per day)
Price (per 1000 liters)
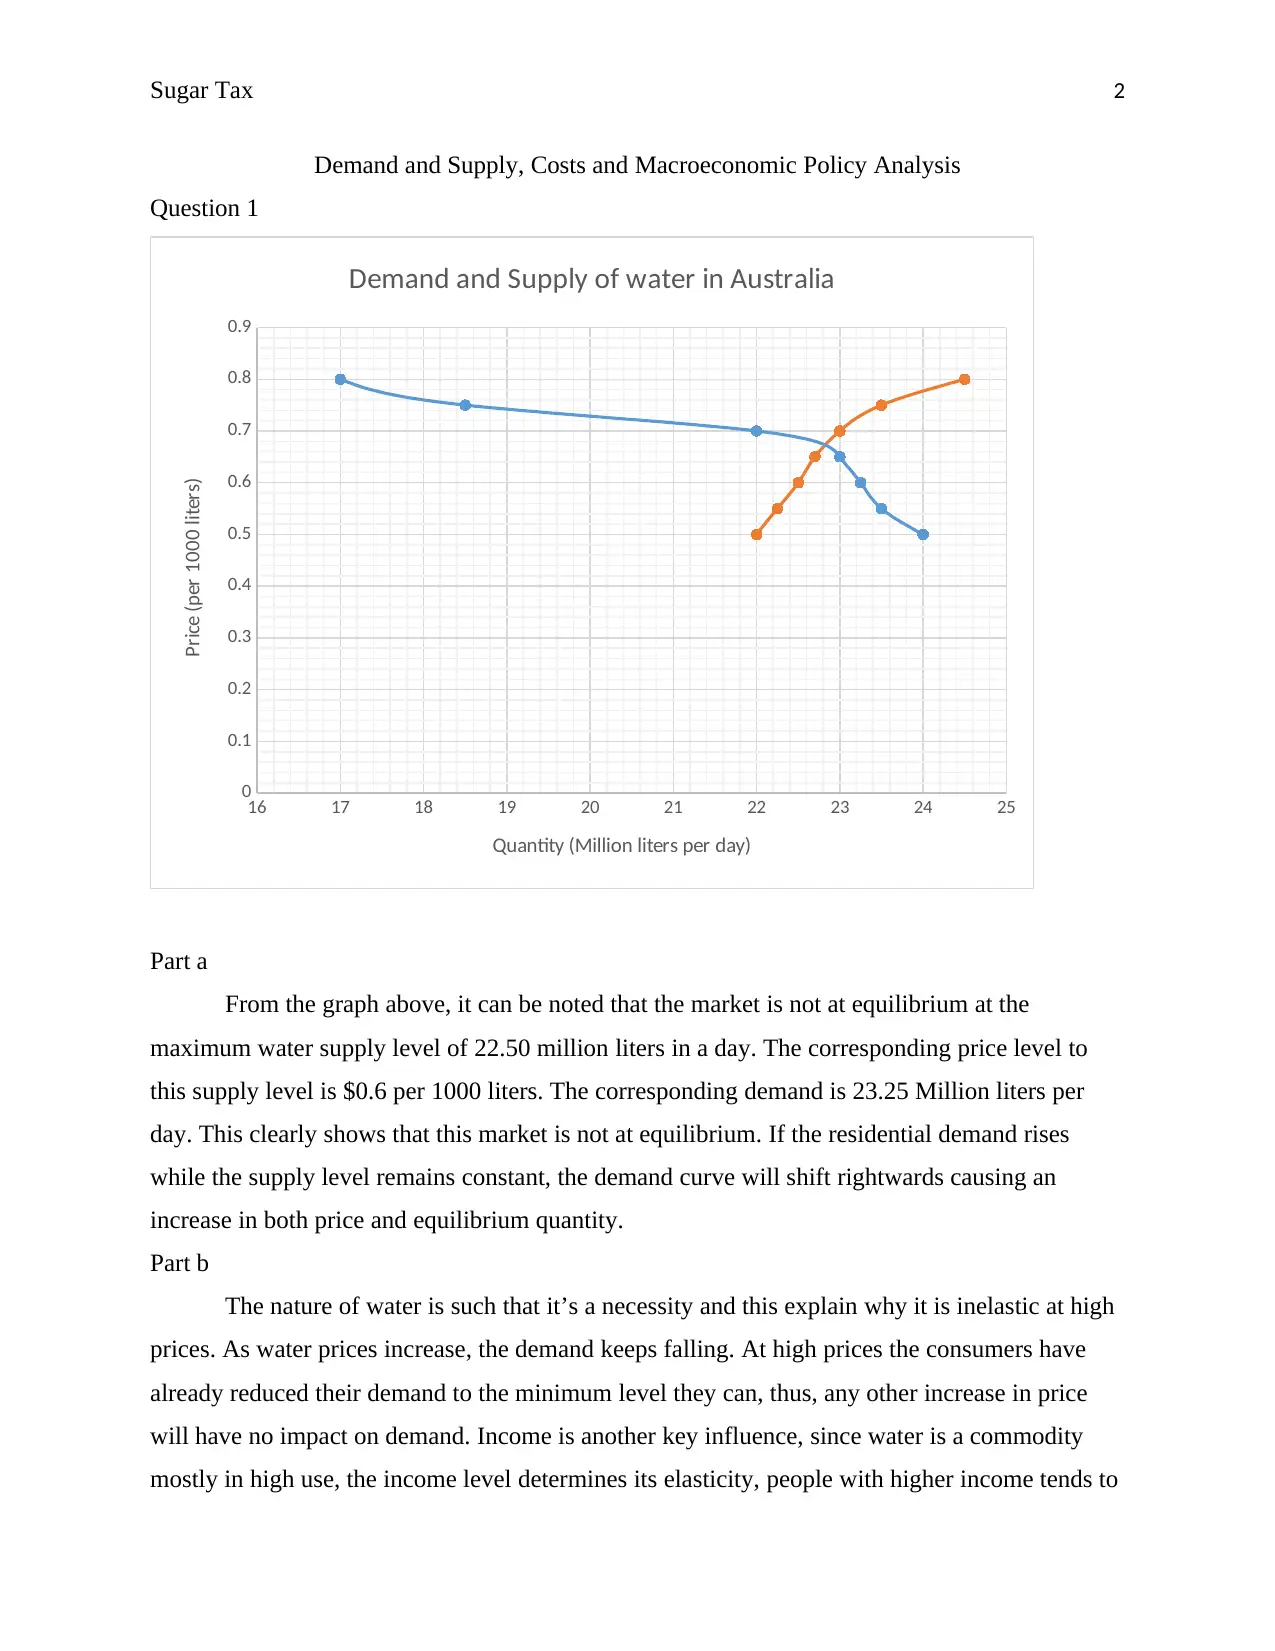
Part a
From the graph above, it can be noted that the market is not at equilibrium at the
maximum water supply level of 22.50 million liters in a day. The corresponding price level to
this supply level is $0.6 per 1000 liters. The corresponding demand is 23.25 Million liters per
day. This clearly shows that this market is not at equilibrium. If the residential demand rises
while the supply level remains constant, the demand curve will shift rightwards causing an
increase in both price and equilibrium quantity.
Part b
The nature of water is such that it’s a necessity and this explain why it is inelastic at high
prices. As water prices increase, the demand keeps falling. At high prices the consumers have
already reduced their demand to the minimum level they can, thus, any other increase in price
will have no impact on demand. Income is another key influence, since water is a commodity
mostly in high use, the income level determines its elasticity, people with higher income tends to
Demand and Supply, Costs and Macroeconomic Policy Analysis
Question 1
16 17 18 19 20 21 22 23 24 25
0
0.1
0.2
0.3
0.4
0.5
0.6
0.7
0.8
0.9
Demand and Supply of water in Australia
Quantity (Million liters per day)
Price (per 1000 liters)
Part a
From the graph above, it can be noted that the market is not at equilibrium at the
maximum water supply level of 22.50 million liters in a day. The corresponding price level to
this supply level is $0.6 per 1000 liters. The corresponding demand is 23.25 Million liters per
day. This clearly shows that this market is not at equilibrium. If the residential demand rises
while the supply level remains constant, the demand curve will shift rightwards causing an
increase in both price and equilibrium quantity.
Part b
The nature of water is such that it’s a necessity and this explain why it is inelastic at high
prices. As water prices increase, the demand keeps falling. At high prices the consumers have
already reduced their demand to the minimum level they can, thus, any other increase in price
will have no impact on demand. Income is another key influence, since water is a commodity
mostly in high use, the income level determines its elasticity, people with higher income tends to
Sugar Tax 3
spend more water regardless of the price level. Thus, their demand for residential water is
inelastic. For those with low income, their demand is inelastic only when the price charged are
too low, when price rise to some greater extent, their demand becomes relatively elastic. Water is
subject to habitual consumption and thus inelastic at most price levels.
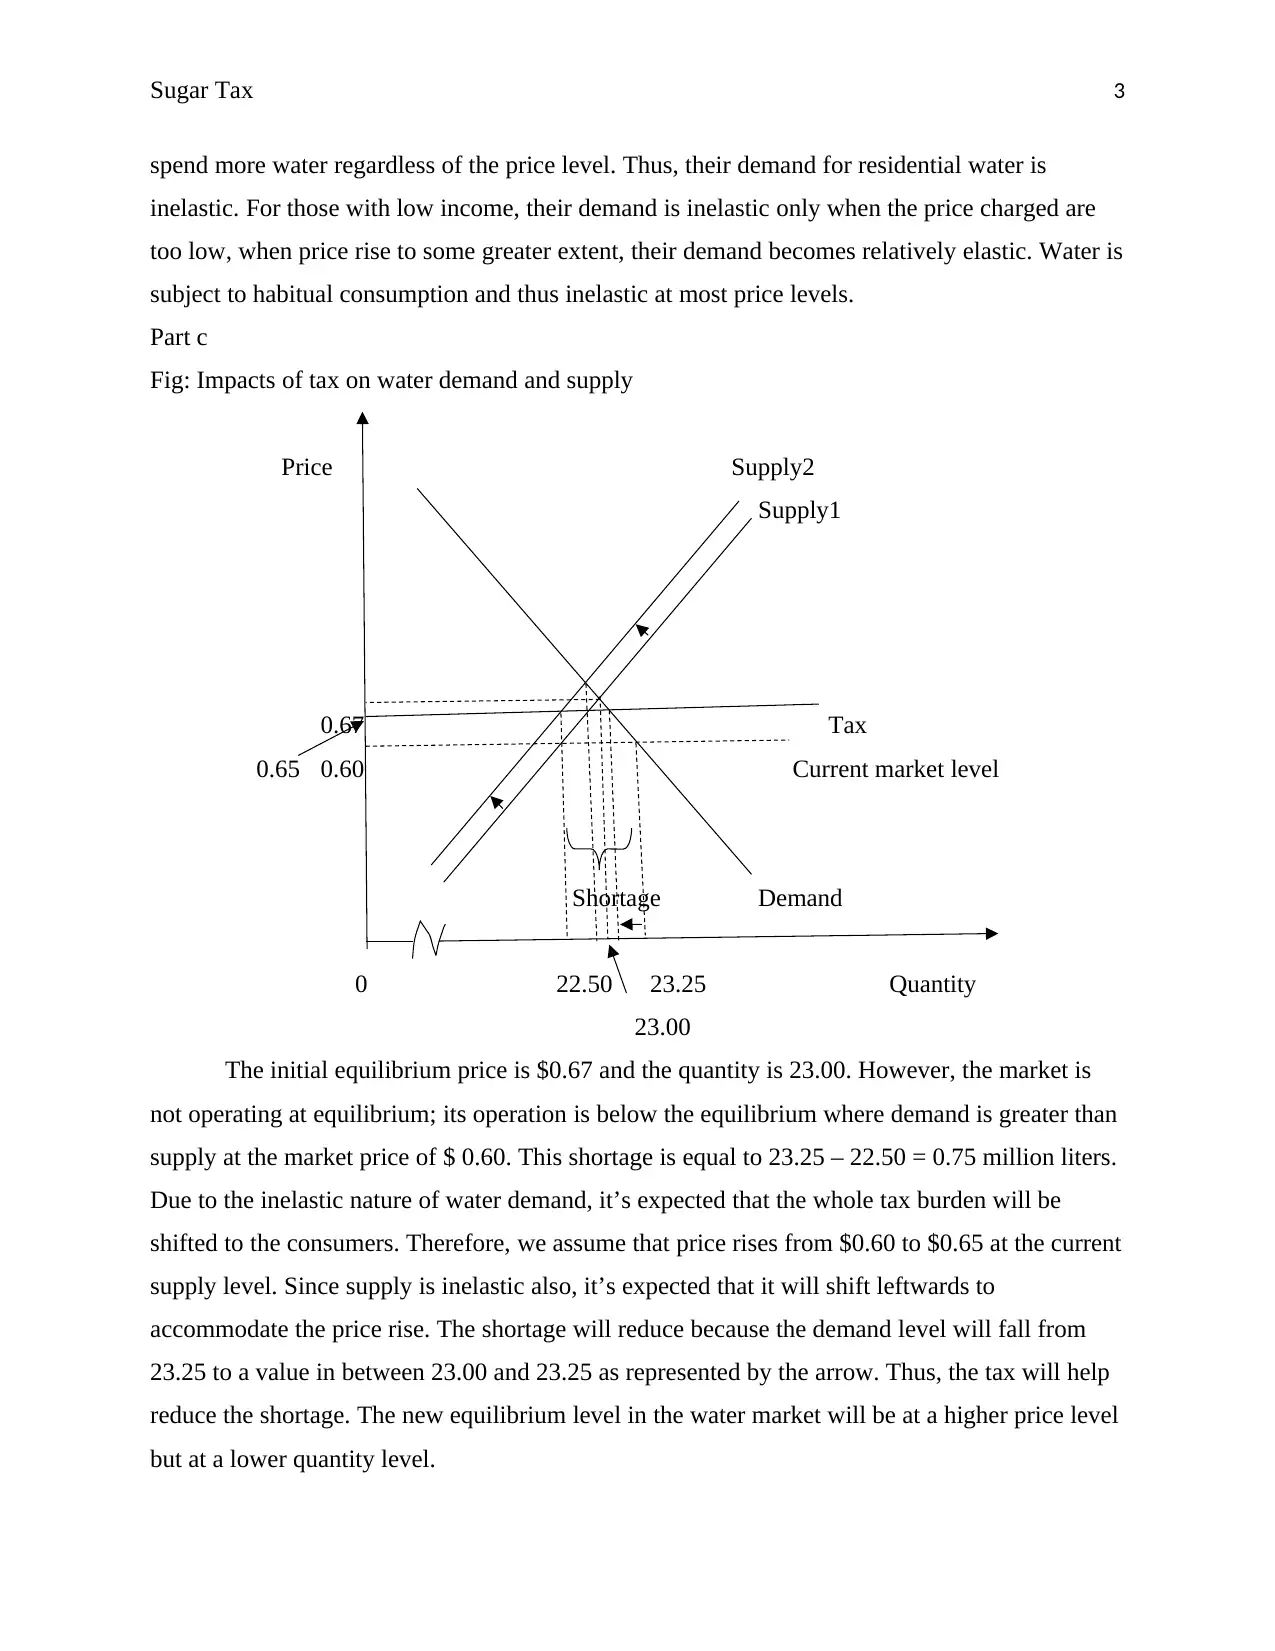
Part c
Fig: Impacts of tax on water demand and supply
Price Supply2
Supply1
0.67 Tax
0.65 0.60 Current market level
Shortage Demand
0 22.50 23.25 Quantity
23.00
The initial equilibrium price is $0.67 and the quantity is 23.00. However, the market is
not operating at equilibrium; its operation is below the equilibrium where demand is greater than
supply at the market price of $ 0.60. This shortage is equal to 23.25 – 22.50 = 0.75 million liters.
Due to the inelastic nature of water demand, it’s expected that the whole tax burden will be
shifted to the consumers. Therefore, we assume that price rises from $0.60 to $0.65 at the current
supply level. Since supply is inelastic also, it’s expected that it will shift leftwards to
accommodate the price rise. The shortage will reduce because the demand level will fall from
23.25 to a value in between 23.00 and 23.25 as represented by the arrow. Thus, the tax will help
reduce the shortage. The new equilibrium level in the water market will be at a higher price level
but at a lower quantity level.
spend more water regardless of the price level. Thus, their demand for residential water is
inelastic. For those with low income, their demand is inelastic only when the price charged are
too low, when price rise to some greater extent, their demand becomes relatively elastic. Water is
subject to habitual consumption and thus inelastic at most price levels.
Part c
Fig: Impacts of tax on water demand and supply
Price Supply2
Supply1
0.67 Tax
0.65 0.60 Current market level
Shortage Demand
0 22.50 23.25 Quantity
23.00
The initial equilibrium price is $0.67 and the quantity is 23.00. However, the market is
not operating at equilibrium; its operation is below the equilibrium where demand is greater than
supply at the market price of $ 0.60. This shortage is equal to 23.25 – 22.50 = 0.75 million liters.
Due to the inelastic nature of water demand, it’s expected that the whole tax burden will be
shifted to the consumers. Therefore, we assume that price rises from $0.60 to $0.65 at the current
supply level. Since supply is inelastic also, it’s expected that it will shift leftwards to
accommodate the price rise. The shortage will reduce because the demand level will fall from
23.25 to a value in between 23.00 and 23.25 as represented by the arrow. Thus, the tax will help
reduce the shortage. The new equilibrium level in the water market will be at a higher price level
but at a lower quantity level.
⊘ This is a preview!⊘
Do you want full access?
Subscribe today to unlock all pages.
Trusted by 1+ million students worldwide
Sugar Tax 4
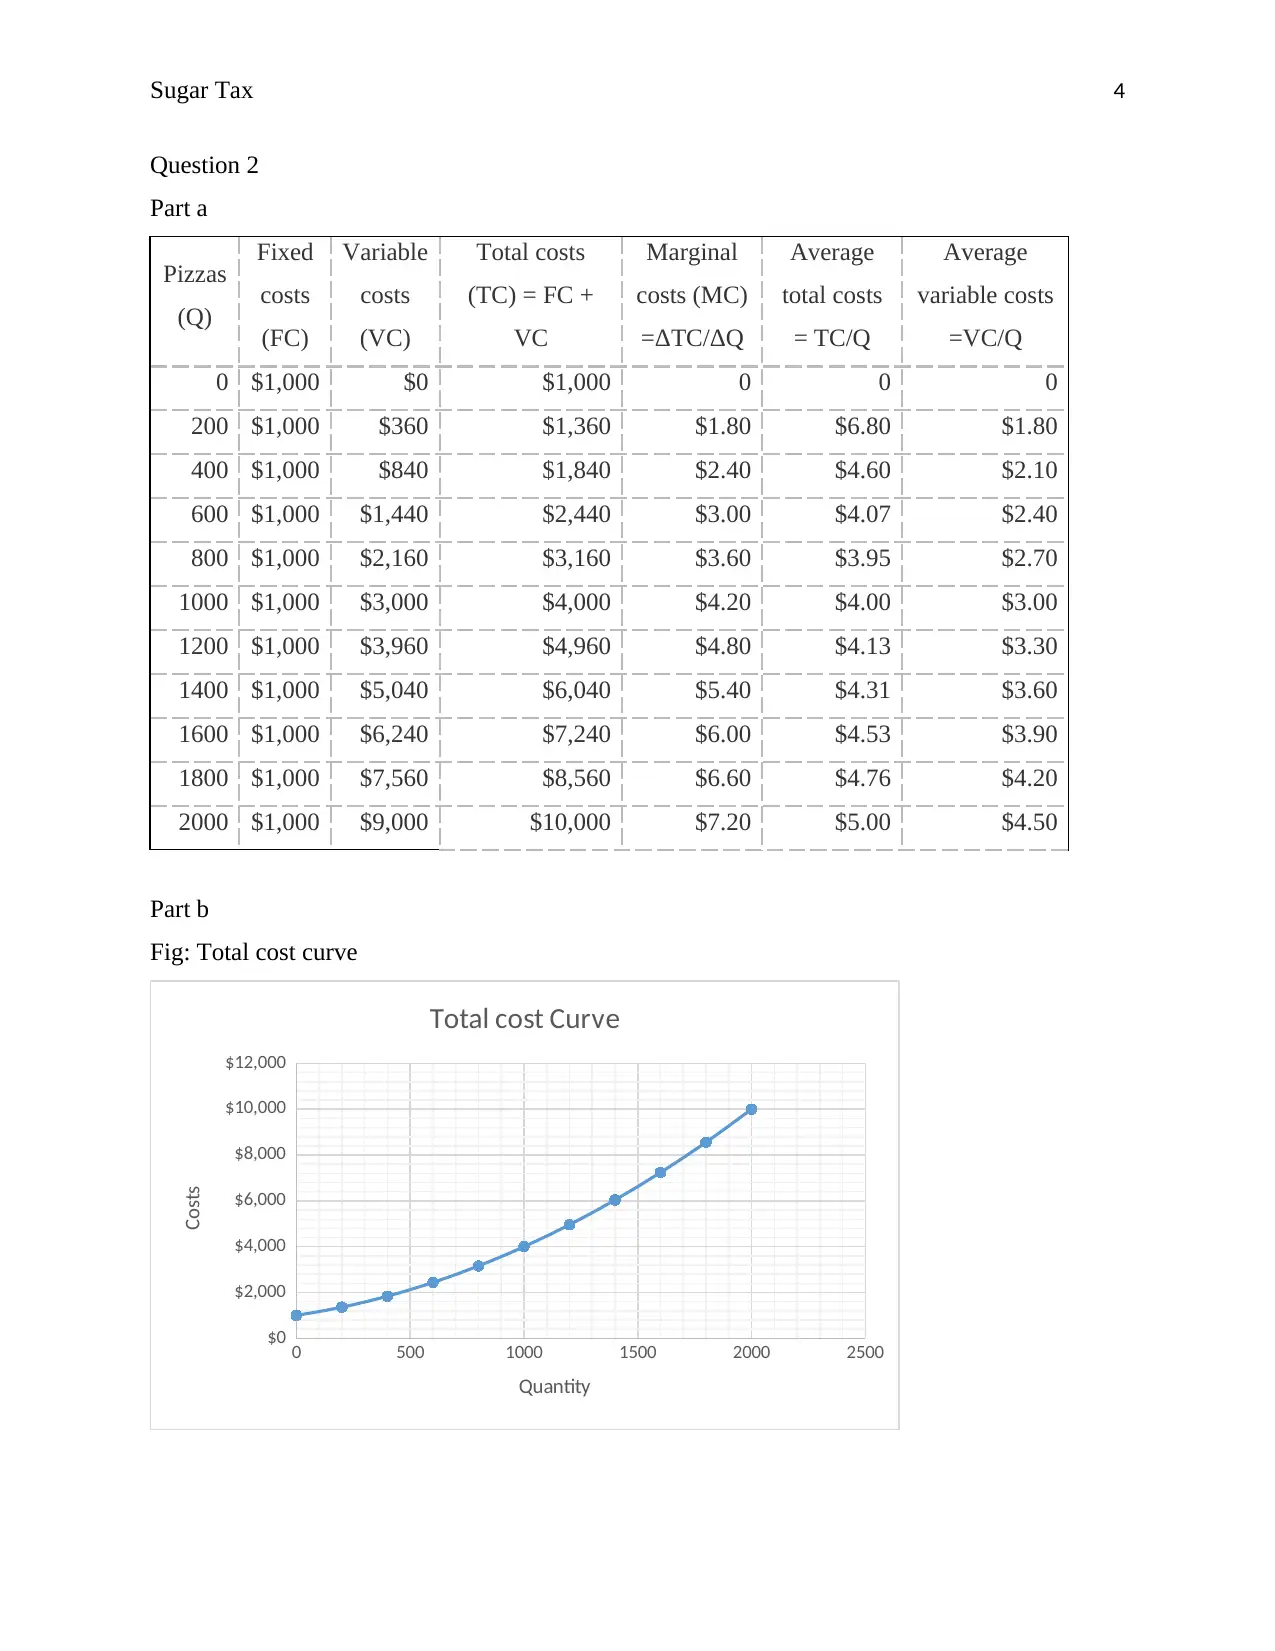
Question 2
Part a
Pizzas
(Q)
Fixed
costs
(FC)
Variable
costs
(VC)
Total costs
(TC) = FC +
VC
Marginal
costs (MC)
=ΔTC/ΔQ
Average
total costs
= TC/Q
Average
variable costs
=VC/Q
0 $1,000 $0 $1,000 0 0 0
200 $1,000 $360 $1,360 $1.80 $6.80 $1.80
400 $1,000 $840 $1,840 $2.40 $4.60 $2.10
600 $1,000 $1,440 $2,440 $3.00 $4.07 $2.40
800 $1,000 $2,160 $3,160 $3.60 $3.95 $2.70
1000 $1,000 $3,000 $4,000 $4.20 $4.00 $3.00
1200 $1,000 $3,960 $4,960 $4.80 $4.13 $3.30
1400 $1,000 $5,040 $6,040 $5.40 $4.31 $3.60
1600 $1,000 $6,240 $7,240 $6.00 $4.53 $3.90
1800 $1,000 $7,560 $8,560 $6.60 $4.76 $4.20
2000 $1,000 $9,000 $10,000 $7.20 $5.00 $4.50
Part b
Fig: Total cost curve
0 500 1000 1500 2000 2500
$0
$2,000
$4,000
$6,000
$8,000
$10,000
$12,000
Total cost Curve
Quantity
Costs
Paraphrase This Document
Need a fresh take? Get an instant paraphrase of this document with our AI Paraphraser
Sugar Tax 5
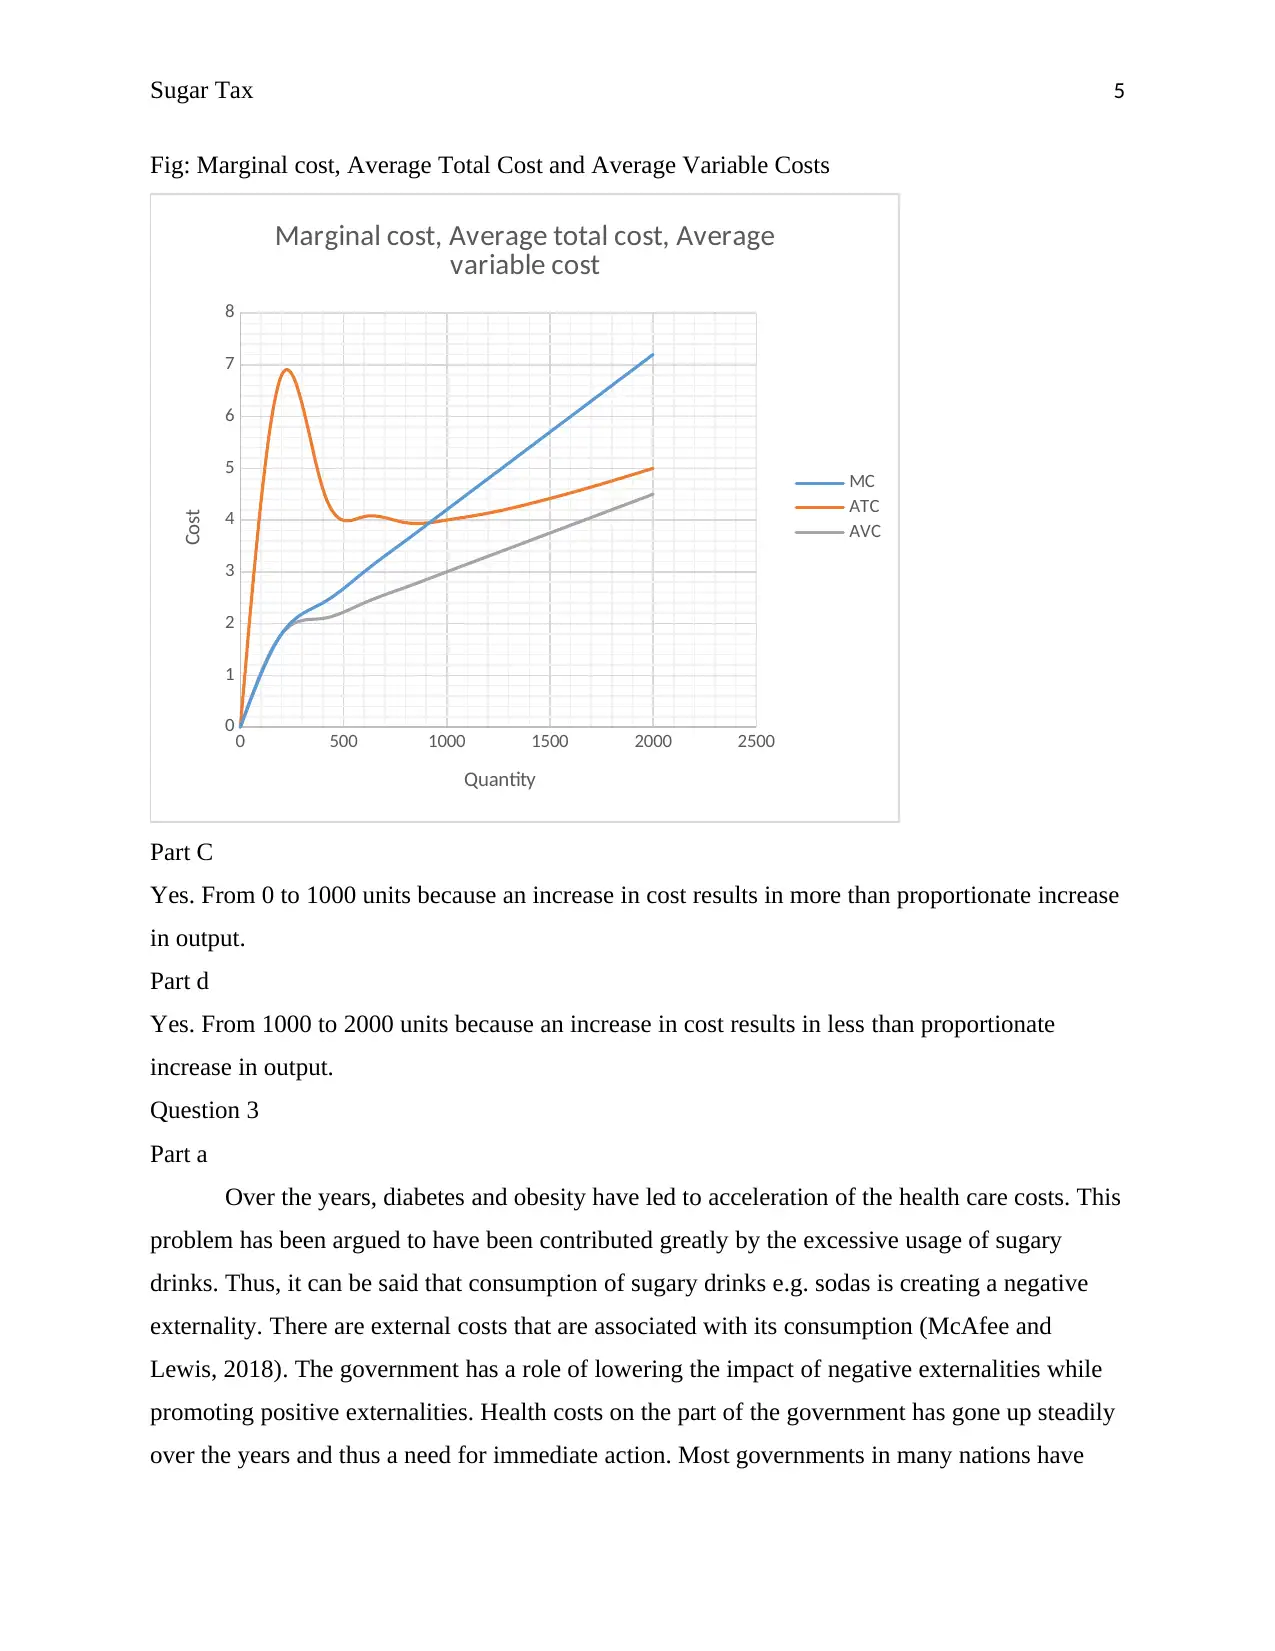
Fig: Marginal cost, Average Total Cost and Average Variable Costs
0 500 1000 1500 2000 2500
0
1
2
3
4
5
6
7
8
Marginal cost, Average total cost, Average
variable cost
MC
ATC
AVC
Quantity
Cost
Part C
Yes. From 0 to 1000 units because an increase in cost results in more than proportionate increase
in output.
Part d
Yes. From 1000 to 2000 units because an increase in cost results in less than proportionate
increase in output.
Question 3
Part a
Over the years, diabetes and obesity have led to acceleration of the health care costs. This
problem has been argued to have been contributed greatly by the excessive usage of sugary
drinks. Thus, it can be said that consumption of sugary drinks e.g. sodas is creating a negative
externality. There are external costs that are associated with its consumption (McAfee and
Lewis, 2018). The government has a role of lowering the impact of negative externalities while
promoting positive externalities. Health costs on the part of the government has gone up steadily
over the years and thus a need for immediate action. Most governments in many nations have
Sugar Tax 6
voted for imposition of tax on sugary drinks. While many have already implemented the strategy,
other are planning to do so in the future. Other nations like the US have voted against its
effectiveness.
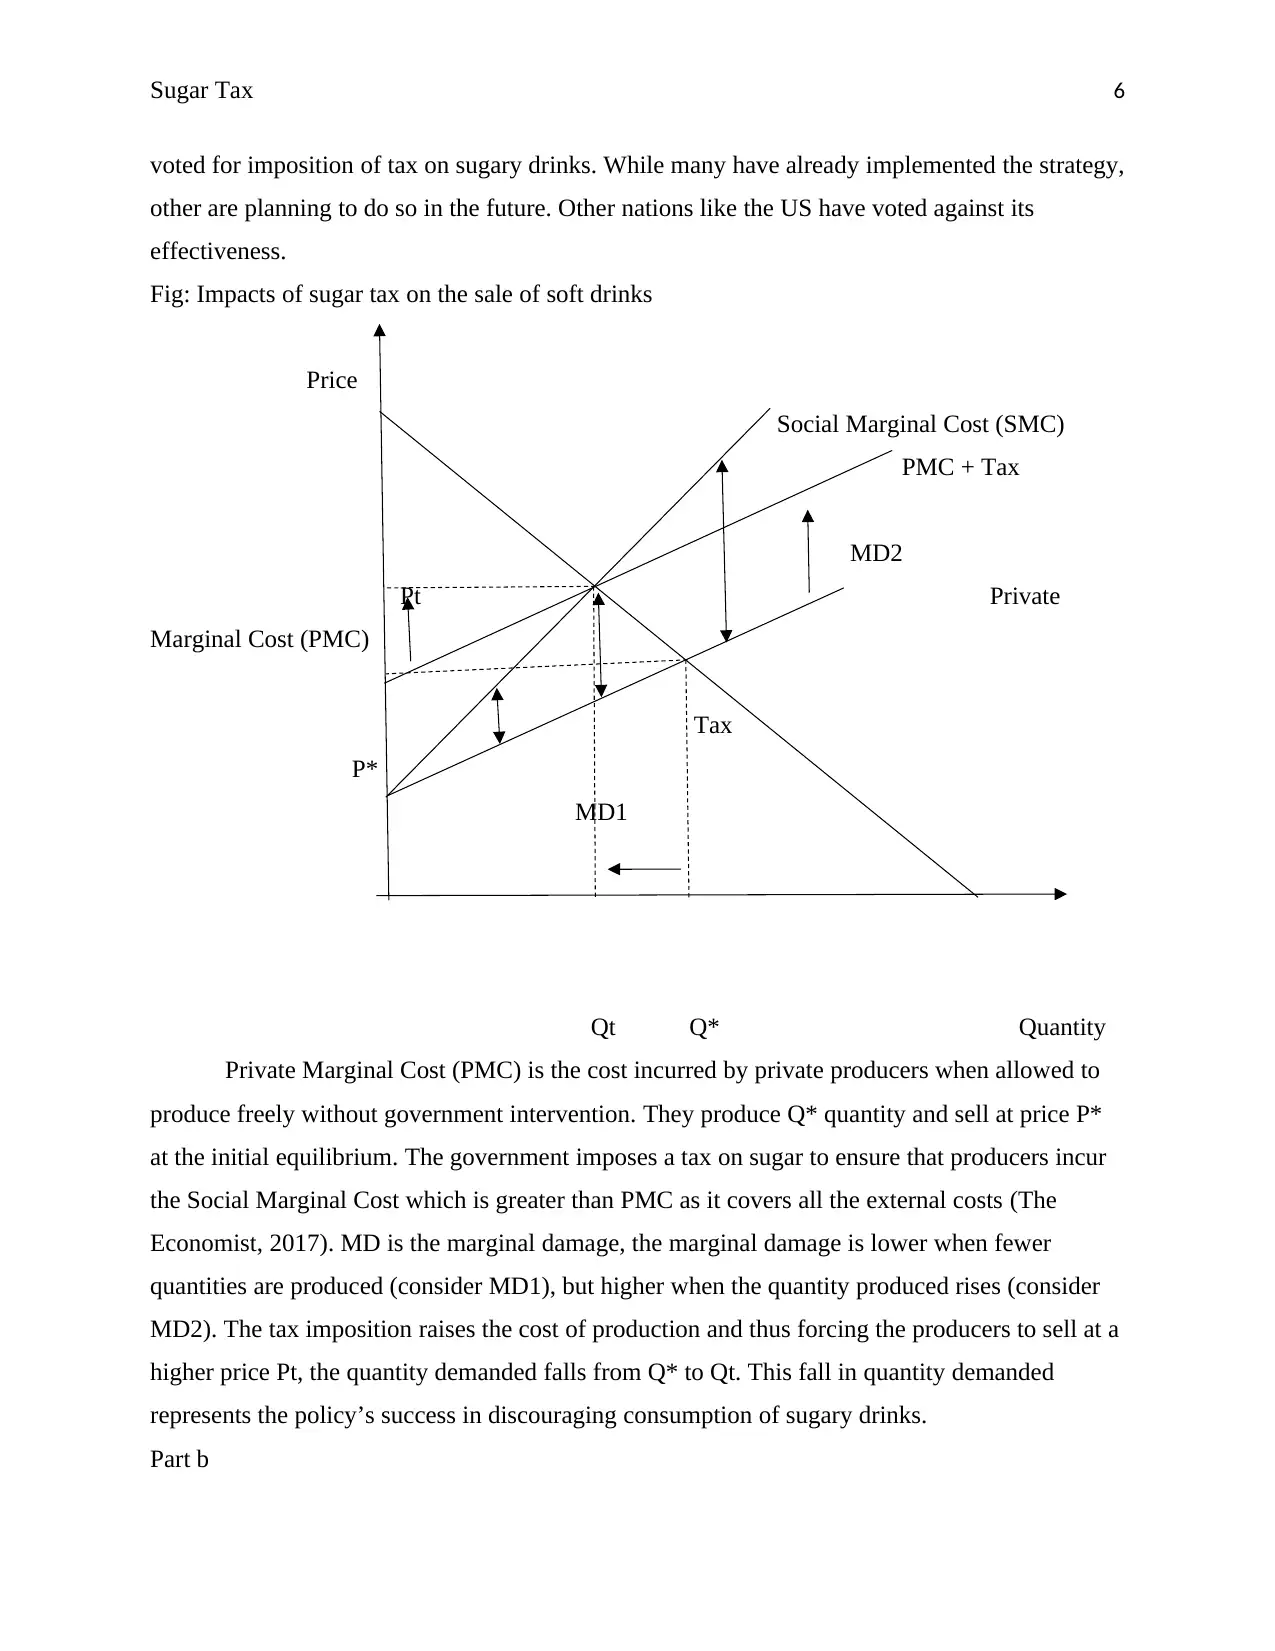
Fig: Impacts of sugar tax on the sale of soft drinks
Price
Social Marginal Cost (SMC)
PMC + Tax
MD2
Pt Private
Marginal Cost (PMC)
Tax
P*
MD1
Qt Q* Quantity
Private Marginal Cost (PMC) is the cost incurred by private producers when allowed to
produce freely without government intervention. They produce Q* quantity and sell at price P*
at the initial equilibrium. The government imposes a tax on sugar to ensure that producers incur
the Social Marginal Cost which is greater than PMC as it covers all the external costs (The
Economist, 2017). MD is the marginal damage, the marginal damage is lower when fewer
quantities are produced (consider MD1), but higher when the quantity produced rises (consider
MD2). The tax imposition raises the cost of production and thus forcing the producers to sell at a
higher price Pt, the quantity demanded falls from Q* to Qt. This fall in quantity demanded
represents the policy’s success in discouraging consumption of sugary drinks.
Part b
voted for imposition of tax on sugary drinks. While many have already implemented the strategy,
other are planning to do so in the future. Other nations like the US have voted against its
effectiveness.
Fig: Impacts of sugar tax on the sale of soft drinks
Price
Social Marginal Cost (SMC)
PMC + Tax
MD2
Pt Private
Marginal Cost (PMC)
Tax
P*
MD1
Qt Q* Quantity
Private Marginal Cost (PMC) is the cost incurred by private producers when allowed to
produce freely without government intervention. They produce Q* quantity and sell at price P*
at the initial equilibrium. The government imposes a tax on sugar to ensure that producers incur
the Social Marginal Cost which is greater than PMC as it covers all the external costs (The
Economist, 2017). MD is the marginal damage, the marginal damage is lower when fewer
quantities are produced (consider MD1), but higher when the quantity produced rises (consider
MD2). The tax imposition raises the cost of production and thus forcing the producers to sell at a
higher price Pt, the quantity demanded falls from Q* to Qt. This fall in quantity demanded
represents the policy’s success in discouraging consumption of sugary drinks.
Part b
⊘ This is a preview!⊘
Do you want full access?
Subscribe today to unlock all pages.
Trusted by 1+ million students worldwide
Sugar Tax 7
Soft drink’s demand is elastic. This is because the quantity consumed change much
whenever there is an increase in price. The change is only by a greater proportion. According to
a study carried out by Guerrero-López, Unar-Munguía and Colchero (2017) on the consumption
of soft drinks in Chile, the elasticity of demand was found to be -1.3. This means that a 10%
price rise resulted in demand cut by 13.7%. Another study by Colchero ET. Al. (2015) on the
Mexicans’ consumption of soft drinks found the elasticity of demand to be -1.06 meaning that a
10% price rise would cause demand for soft drinks to fall by 10.6%. However, there are many
factors that determines the elasticity of soft drinks. For instance, in the rural areas where people
have lower income, demand tends to be more elastic than in the urban areas where consumers’
income is higher. Health awareness programs also tend to increase the demand elasticity for soft
drinks.
Part c
Using the argument of Schwartz (2014), tax can be considered to be less effective
compared to other awareness programs. He argued that even if taxes are raised, most of the
consumers do not get awareness of the tax they are paying. Most people are ignorant of the tax
payable, their interest is always on the price level. His argument was that the tax imposition is
significantly smaller to create some impact on the desirable effects. A study carried out gave the
following results; for the middle income quantiles, only one household was noted to respond to
the sugar tax. Lower income earners were argued to continue consuming the same level at the
opportunity cost of other spending.
Based on this argument, and the fact that the tax imposition cannot be very high enough
to induce the desirable effect, one would vote against the sugary tax and for the awareness
programs. Consumers will know of the harmful effects of consuming sugary drinks and make
their own decision to lower their consumption. On the other side, Roache and Gostin (2017)
argued for the tax on the basis that it leads to generation of more revenue for the government, it
discourages consumption and that the increase in cost of production creates an incentive for the
producers to reformulate their products to reduce the sugar component. This again sounds better
to achieve the best results for improving health. Taxation is therefore the most effective choice.
Part d
The study by Basu and Madsen (2017) confirmed of the effectiveness of sugar tax. The
study was done in Berkeley, California, United States. There was an imposition of a penny-per-
Paraphrase This Document
Need a fresh take? Get an instant paraphrase of this document with our AI Paraphraser
Sugar Tax 8
ounce tax which led to a greater impact on the price level. It’s noted that the tax was
substantially transferred from the producers to the consumers. This led to a decline in the
quantity demanded and also the supply. The other impact was on untaxed beverages (teas, water,
and milk). The demand for this untaxed beverages rose during this period. This clearly
demonstrates the effectiveness of this policy. Consumers after suffering from price increments
decided to shift their consumption from sugary drinks to healthy untaxed beverages. On the other
hand, MacGuill (2017), argued that even if the tax was effective in consumption of soft drinks,
it’s not evident of lowering overweight, obesity and other related diseases.
He argued that the effect of the decrease in consumption fades very quickly and thus
desirable impacts are not achieved. He also noted that sugar taxes have not yet proven to cut
body mass index (BMI), diabetes, obesity or even heart diseases. Bascuñán and Cuadrado (2017)
also noted that the sugar taxes imposed are insufficient to have impact on obesity. From this
argument, it can be confirmed that the decrease in consumption of soft drinks does not have
major influence on improving health. Thus, sugar tax cannot be concluded to be that effective.
Since the tax is cripplingly employed by many nations, subsequent research might yield better
results that will lead to increased efficiency.
Sugar Tax 9
Bibliography
Bascuñán, J. and Cuadrado, C. (2017). Effectiveness of sugar-sweetened beverages taxes to
reduce obesity: evidence brief for policy. Medwave, [online] 17(08), pp.e7054-e7054. Available
at: https://www.medwave.cl/link.cgi/English/Features/HealthPolicy/7055 [Accessed 5 May
2018].
Basu, S. and Madsen, K. (2017) Effectiveness and equity of sugar-sweetened beverage taxation.
PLoS Med 14(6): e1002327. https://doi.org/10.1371/journal.pmed.1002327
Colchero, M., Salgado, J., Unar-Munguía, M., Hernández-Ávila, M. and Rivera-Dommarco, J.
(2015). Price elasticity of the demand for sugar sweetened beverages and soft drinks in Mexico.
Sciencedirect, [online] 17(1). Available at:
https://www.sciencedirect.com/science/article/pii/S1570677X15000611.
Guerrero-López, C., Unar-Munguía, M. and Colchero, M. (2017). Price elasticity of the demand
for soft drinks, other sugar-sweetened beverages and energy dense food in Chile. BMC Public
Health, [online] 17(1). Available at: https://www.ncbi.nlm.nih.gov/pmc/articles/PMC5301435/
[Accessed 4 May 2018].
MacGuill, S. (2017). FactCheck: Do taxes on sugary drinks actually work? [Online]
TheJournal.ie. Available at: http://www.thejournal.ie/sugar-soft-drinks-tax-does-it-work-health-
benefits-facts-2918363-Oct2017/ [Accessed 5 May 2018].
McAfee, R. and Lewis, T. (2018). Try our new reader! Click here Introduction to Economic
Analysis, v. 1.0. [Online] FlatWorld. Available at:
https://catalog.flatworldknowledge.com/bookhub/13?e=mcafee-ch07_s02 [Accessed 4 May
2018].
Mnmecon (2011). The Pigouvian tax. [Online] mnmeconomics. Available at:
https://mnmeconomics.wordpress.com/2011/10/16/the-pigouvian-tax/ [Accessed 4 May 2018].
Roache, S. and Gostin, L. (2017). The Untapped Power of Soda Taxes: Incentivizing Consumers,
Generating Revenue, and Altering Corporate Behavior. International Journal of Health Policy
and Management, 6(9), pp.489-493.
Schwartz, E. (2014). The Impact of Inelastic Demand on a Sugary Drink Tax. [Online] Econlife.
Available at: https://econlife.com/2014/10/inelastic-demand-and-the-soda-tax-debate/ [Accessed
4 May 2018].
⊘ This is a preview!⊘
Do you want full access?
Subscribe today to unlock all pages.
Trusted by 1+ million students worldwide
Sugar Tax 10
The Economist. (2017). Pigouvian taxes. [Online] Available at:
https://www.economist.com/news/economics-brief/21726709-what-do-when-interests-
individuals-and-society-do-not-coincide-fourth [Accessed 4 May 2018].
The Economist. (2017). Pigouvian taxes. [Online] Available at:
https://www.economist.com/news/economics-brief/21726709-what-do-when-interests-
individuals-and-society-do-not-coincide-fourth [Accessed 4 May 2018].
1 out of 10
Related Documents


Your All-in-One AI-Powered Toolkit for Academic Success.
+13062052269
info@desklib.com
Available 24*7 on WhatsApp / Email
![[object Object]](/_next/static/media/star-bottom.7253800d.svg)
Unlock your academic potential
Copyright © 2020–2026 A2Z Services. All Rights Reserved. Developed and managed by ZUCOL.