Jaipuria Institute of Management Summer Training Report: Voltas Ltd.
VerifiedAdded on 2021/07/20
|37
|6413
|927
Report
AI Summary
This summer training report, submitted by a student from Jaipuria Institute of Management, presents a comprehensive study on the working capital management of Voltas Ltd. The report begins with an introduction to working capital and its importance, followed by an overview of factors affecting it. It includes a detailed company profile of Voltas Ltd., covering its business divisions and operations. The core of the report focuses on the student's job description, analysis, and data interpretation, using financial data from Voltas Ltd. to analyze key ratios and trends. The report also includes findings, suggestions, and conclusions regarding Voltas Ltd.'s financial performance, drawing on both primary and secondary sources. The student's experience at Voltas Ltd. provided practical insights into the finance and commercial departments of the company. The report concludes with a bibliography and tables of figures.
SUMMER TRAINING REPORT
For the Proposed Summer Internship Project
A STUDY ON WORKING CAPITAL MANAGEMENT OF VOLTAS LTD.
JAIPURIA INSTITUTE OF MANAGEMENT
A-32, Sector 62, Institutional Area, Noida- 201309 (U.P.)
Under the Supervision of
Prof. Ajay Bansal
Submitted by
Agrima Shrivastava
JN170006
AGRIMA SHRIVASTAVA | JN170006 1
Paraphrase This Document
Need a fresh take? Get an instant paraphrase of this document with our AI Paraphraser
DECLARATION
I, Agrima Shrivastava,of Jaipuria Institute of Management, NOIDA, hereby affirm that this
report on Summer Internship Project titled “A Study on Working Capital Management of
Voltas Ltd.” at Voltas corporate office, Delhi,is solely my work and is prepared by me only.
I also declare that I have not revealed any sort of critical information of the organization.
I also declare that all the information collected from numerous secondary sources has been duly
acknowledged in this project report.
Place: New Delhi
Date: 5 July 2018 (Agrima Shrivastava)
AGRIMA SHRIVASTAVA | JN170006 2
AGRIMA SHRIVASTAVA | JN170006 3
⊘ This is a preview!⊘
Do you want full access?
Subscribe today to unlock all pages.
Trusted by 1+ million students worldwide
AGRIMA SHRIVASTAVA | JN170006 4
Paraphrase This Document
Need a fresh take? Get an instant paraphrase of this document with our AI Paraphraser

ACKNOWLEDGEMENT
I would like to extend my heartfelt thankfulness towards the Management of Voltas Ltd for
providing me an opportunity to experience my Summer Internship Project in their respected
organization. I am extremely grateful to my guide Mr. Gurudev Singh for his guidance and
supportive nature that helped me in completing this project report. I have learned severalnew
things about the organizational finance system while working at Voltas Ltd.
I would also like to thank Mohd. Kalimuzzama Siddiqui and Mr. Amol Bhise forallowing me to
work on my project and for their timely support and guidance that helped me in preparation of
this report.
Last but not the least I would like to thank my faculty mentor Mr. Ajay Bansal for his continuous
support and guidance.
(Agrima Shrivastava)
AGRIMA SHRIVASTAVA | JN170006 5
ABSTRACT
This project is on working capital management of VOLTAS Ltd. This study has been
done to take a glance atfunctioning of finance and commercial department of the company and
take an overview of working capital management and analyse it toevaluate the performance of
the company financially. For major part of the project, I have used my understanding of the job
in the F&C department but for the study of last part that is working capital management I have
used the annual reports of Voltas Ltd for five years. In the end of the report, I speak about my
results, conclusions, recommendations and learning outcomes.
AGRIMA SHRIVASTAVA | JN170006 6
⊘ This is a preview!⊘
Do you want full access?
Subscribe today to unlock all pages.
Trusted by 1+ million students worldwide
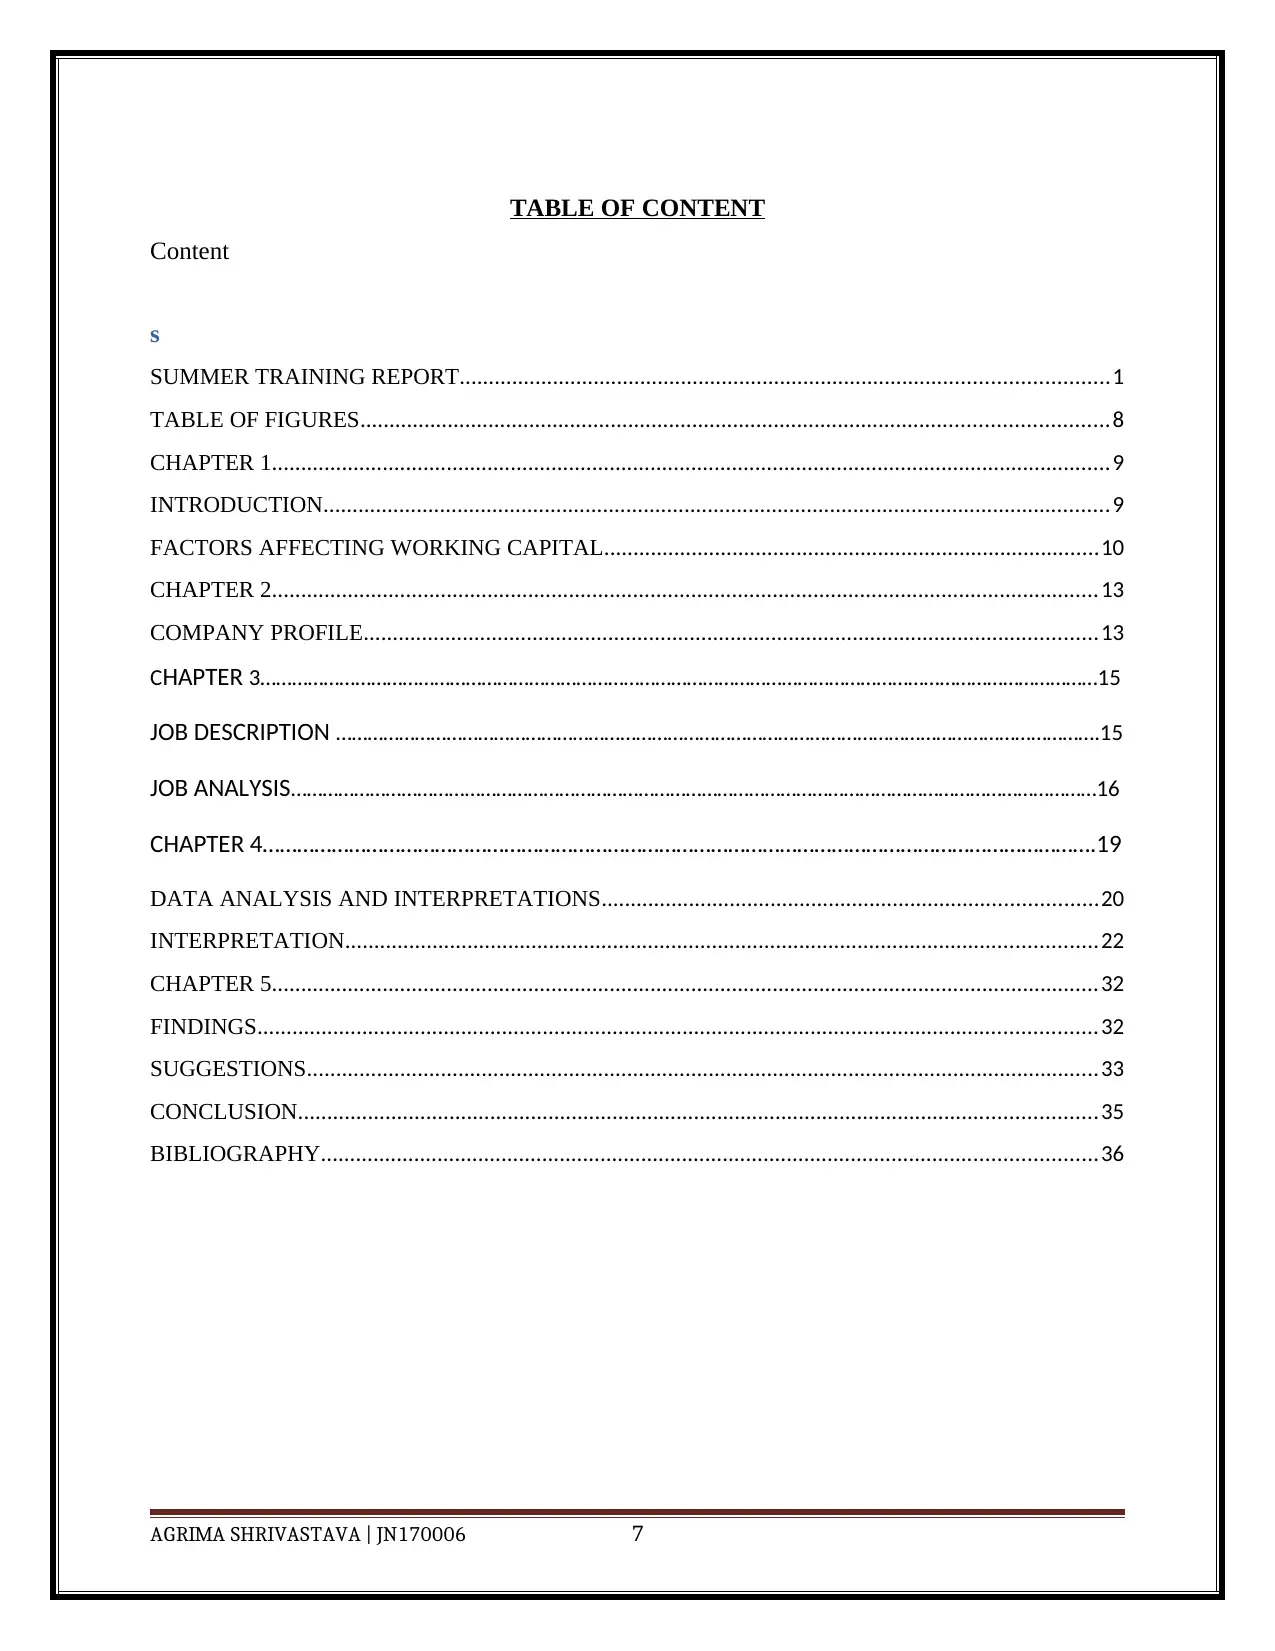
TABLE OF CONTENT
Content
s
SUMMER TRAINING REPORT...............................................................................................................1
TABLE OF FIGURES................................................................................................................................8
CHAPTER 1................................................................................................................................................9
INTRODUCTION.......................................................................................................................................9
FACTORS AFFECTING WORKING CAPITAL.....................................................................................10
CHAPTER 2..............................................................................................................................................13
COMPANY PROFILE..............................................................................................................................13
CHAPTER 3……………………………………………………………………………………………………………………………………………15
JOB DESCRIPTION ……………………………………………………………………………………………………………………………….15
JOB ANALYSIS………………………………………………………………………………………………………………………………………16
CHAPTER 4……………………………………………………………………………………………………………………………….19
DATA ANALYSIS AND INTERPRETATIONS.....................................................................................20
INTERPRETATION.................................................................................................................................22
CHAPTER 5..............................................................................................................................................32
FINDINGS................................................................................................................................................32
SUGGESTIONS........................................................................................................................................33
CONCLUSION.........................................................................................................................................35
BIBLIOGRAPHY.....................................................................................................................................36
AGRIMA SHRIVASTAVA | JN170006 7
Paraphrase This Document
Need a fresh take? Get an instant paraphrase of this document with our AI Paraphraser
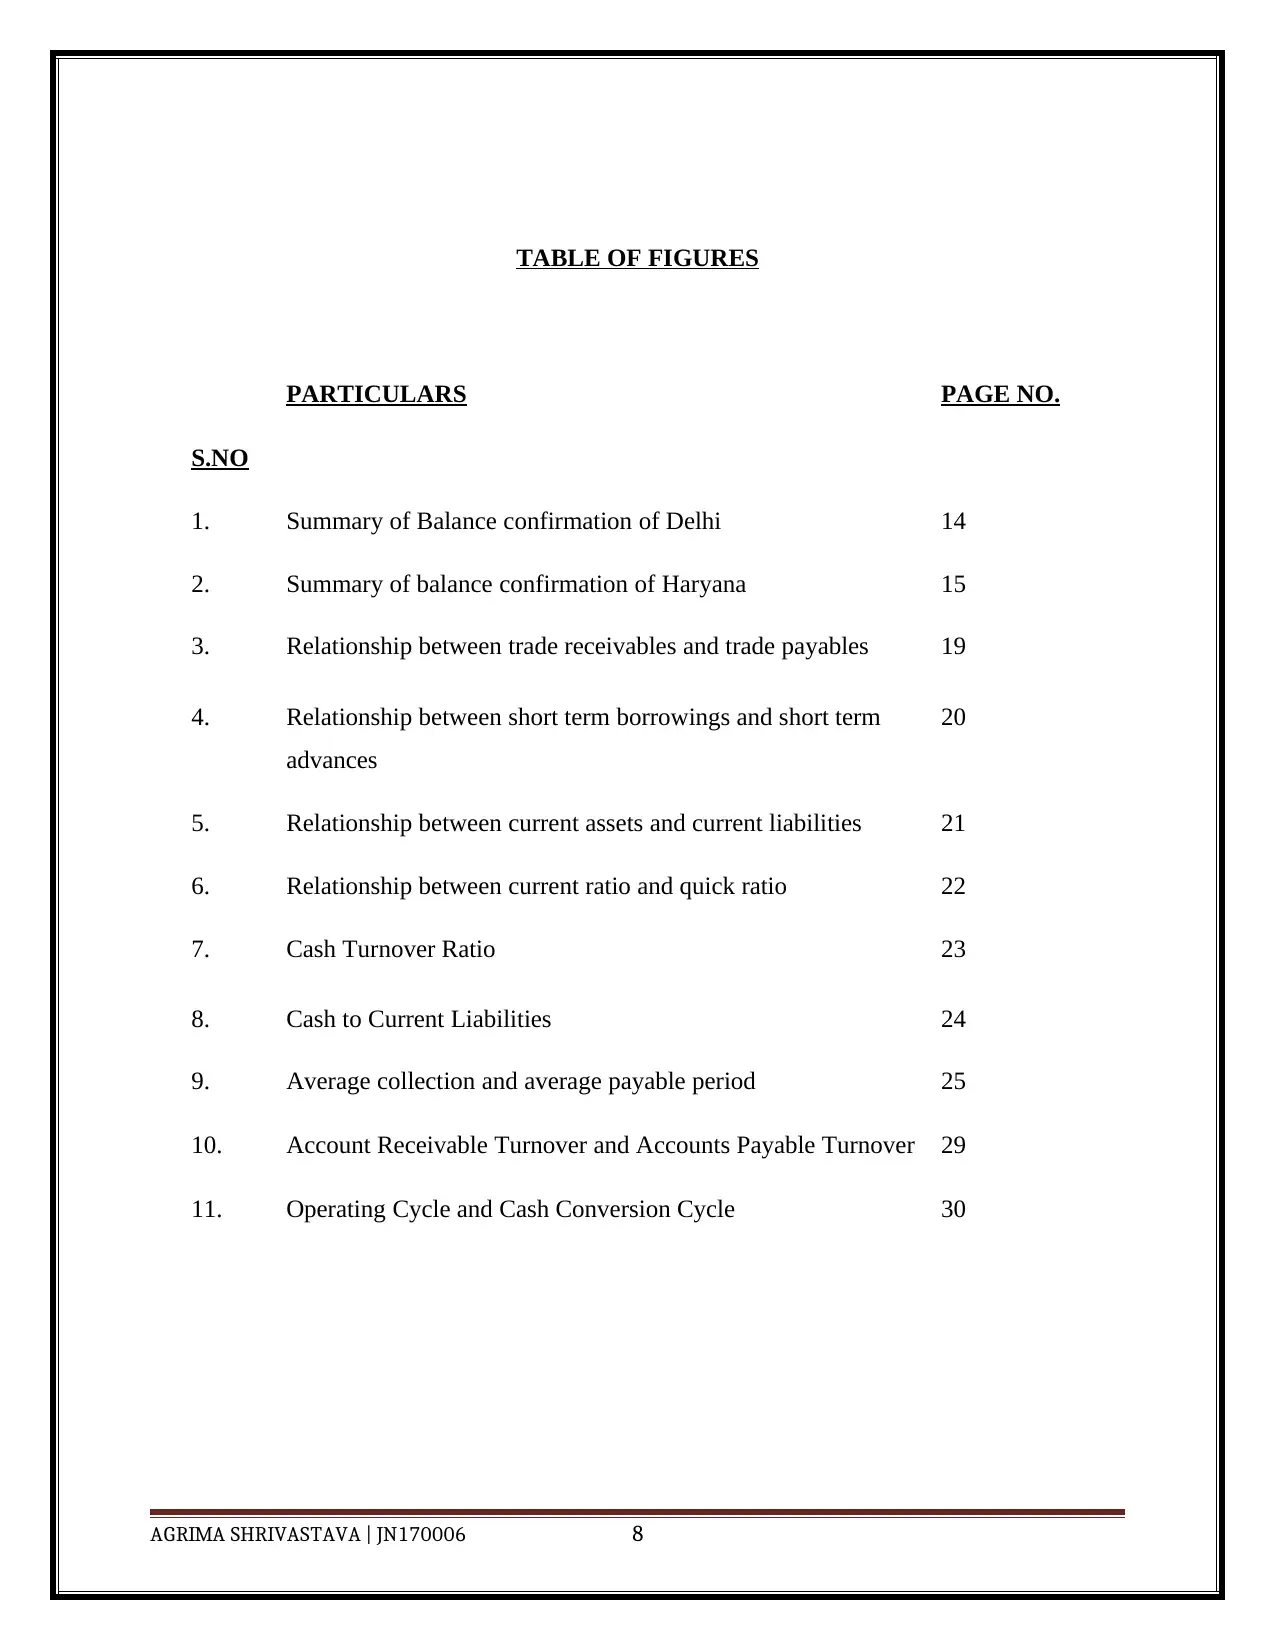
TABLE OF FIGURES
S.NO
PARTICULARS PAGE NO.
1. Summary of Balance confirmation of Delhi 14
2. Summary of balance confirmation of Haryana 15
3. Relationship between trade receivables and trade payables 19
4. Relationship between short term borrowings and short term
advances
20
5. Relationship between current assets and current liabilities 21
6. Relationship between current ratio and quick ratio 22
7. Cash Turnover Ratio 23
8. Cash to Current Liabilities 24
9.
10.
11.
Average collection and average payable period
Account Receivable Turnover and Accounts Payable Turnover
Operating Cycle and Cash Conversion Cycle
25
29
30
AGRIMA SHRIVASTAVA | JN170006 8
CHAPTER 1
INTRODUCTION
A business no matter how small or big it is in terms of revenues and profits requires
money to carry out its activities and operations to achieve its goals. In fact, finance has become
so necessary in the business today that it can be termed as the essence of an enterprise. Without
adequate amount of finances in the business, almost no enterprise can accomplish its objectives
completely. So this chapter deals with studying various aspects of working capital management
which are necessary to carry out the daily operations. The term working capital refers to the part
of business’s capital which is required for financing short term or current assets such as
marketable securities,cash,inventories and debtors etc. Since the funds invested in current assets
keep revolving fast and are being constantly converted in to cash, that is the reason it is known
asr circulating or revolving capital. In a nutshell, Working Capital Management performs a very
important key role and is at topmost priority for every finance manager. But all managers,
however, must keep in mind that in their pursuit to attain high liquidity, they must never lose the
sight of their basic goal which is profitability. A judicious mix of liquidity and profitability must
be achieved while managing the working capital requirement of firm.
The decisions relating to short term financing and working capital are referred to as
working capital management. These involve managing the relationship between a firm's short-
term assets and its short-term liabilities. The goal of working capital management is to ensure
that the firm is able to continue its day to dayoperations and that it has sufficient cash flow to
satisfy both short-term debt and future operational expenses.
Working Capital management is the management of assets that are current or short term in
nature.Current assets, by definition are the assets normally converted in to cash in a period of one
year. Therefore, working capital management can be considered as themanagement of market
securities receivable, cash, inventories and current liabilities. The management of current assets
AGRIMA SHRIVASTAVA | JN170006 9
⊘ This is a preview!⊘
Do you want full access?
Subscribe today to unlock all pages.
Trusted by 1+ million students worldwide
is almost similar to fixed assets (only depreciation is not applied on current assets),in the sense
that in both the cases the firm analyses their effect on its profitability and risk factors.
It differs on three major aspects:
1. In managing fixed assets, time is an important factor as discounting andcompounding of time
plays an important role in capital budgeting and aalso a minor part in the management of current
assets.
2. The large holdings of current assets, especially cash equivalents or cash, may strengthen the
firm’sliquidity position, but is may reduce the profitability of the firm after sometime as ideal
cash yields nothing.
3. The level of fixed assets as well as current assets depends upon the expectedsales, but current
assets fluctuate in the short run of abusiness.
FACTORS AFFECTING WORKING CAPITAL
There is no mention of a specific method by which a company can determine working capital
requirement for a business. There are a lot of factors that affect the working capital requirement.
These factors might differ in importance from business to business and time to time. So a
thorough analysis of these factors must be undertaken before trying to estimate the amount of
working capital needed in the business. Some of the different factors are mentioned below:
1. Nature of business:Nature of business is an important factor in determining the working
capital requirements. There are a few businesses which require a very nominal amount to
be invested in fixed assets. But they require a large chunk of the total investment is in the
form of working capital. There businesses, for example, are of the trading and financing
type. There are businesses which require huge investment in fixed assets and a negligible
amount in the form of working capital.
AGRIMA SHRIVASTAVA | JN170006 10
Paraphrase This Document
Need a fresh take? Get an instant paraphrase of this document with our AI Paraphraser
2. Size of business: Size is usually measured in terms of scale of operations of a company.
The scale of operating cycleis directly proportional to amount of working capital needed
i.e. the larger the scale of operating cycle the large will be the amountworking capital and
vice versa.
3. Business Fluctuations:Most business experience cyclical and seasonal fluctuationsin
demand for their goods and services. These fluctuations affect the business withrespect to
working capital because during the time of boom, due to an increase in business activity
the amount of working capital requirement increases and the reverseis true in the case of
recession. Financial arrangement for seasonal working capitalrequirements are to be
made in advance.
4. Production Policy: Every business has to cope with different typesof fluctuations. Hence
it is obvious that production policy has to be planned for future wellin advance
considering the fluctuations. No two companies can have similar productionpolicy in all
respects because it depends upon the circumstances of an individualcompany.
5. Firm’s Credit Policy:The credit policy of a firm affects working capital byinfluencing
the level of book debts. Individuals also have their role in framing their credit policy. A
liberal creditpolicy will lead to more amount being committed to working capital
requirementswhereas a stern credit policy may decrease the amount of working capital
requirementappreciably but the repercussions are not simple to handle. Hence a firm
mustalways frame a rational credit policy based on the credit worthiness of the customer.
6. Availability of Credit:The terms on which a company is able to avail credit from
itssuppliers of goods and devices credit/also affects the working capital requirement. If
accompany in a position to get credit on liberal terms and in a short span of time then
Itwill be in a position to work with less amount of working capital. Hence, the amountof
working capital needed will depend upon the terms a firm is granted credit by
itscreditors.
AGRIMA SHRIVASTAVA | JN170006 11
7. Growth and Expansion activities:The working capital needs of a firm increases asit
grows in term of sale or fixed assets. There is no precise way to determine therelation
between the amount of sales and working capital requirement but one thing issure that an
increase in sales never precede, the increase in working capital but it isalways the other
way round. So in case of growth or expansion the aspect of workingcapital needs to be
planned in advance.
8. Price Level Changes:Generally increase in price level makes the commoditiesdearer.
Hence with increase in price level the working capital requirements alsoincreases. The
companies which are in a position to alter the price of thesecommodities in accordance
with the price level changes will face lesser problems ascompared to others. The changes
in price level may not affect all the firms in sameway. The reactions of all firms with
regards to price level changes will be differentfrom one other.
AGRIMA SHRIVASTAVA | JN170006 12
⊘ This is a preview!⊘
Do you want full access?
Subscribe today to unlock all pages.
Trusted by 1+ million students worldwide
1 out of 37
Related Documents


Your All-in-One AI-Powered Toolkit for Academic Success.
+13062052269
info@desklib.com
Available 24*7 on WhatsApp / Email
![[object Object]](/_next/static/media/star-bottom.7253800d.svg)
Unlock your academic potential
Copyright © 2020–2026 A2Z Services. All Rights Reserved. Developed and managed by ZUCOL.