Statistical Analysis of Sun Pharma Drug Testing: A Comprehensive Study
VerifiedAdded on 2023/04/08
|7
|1350
|251
Homework Assignment
AI Summary
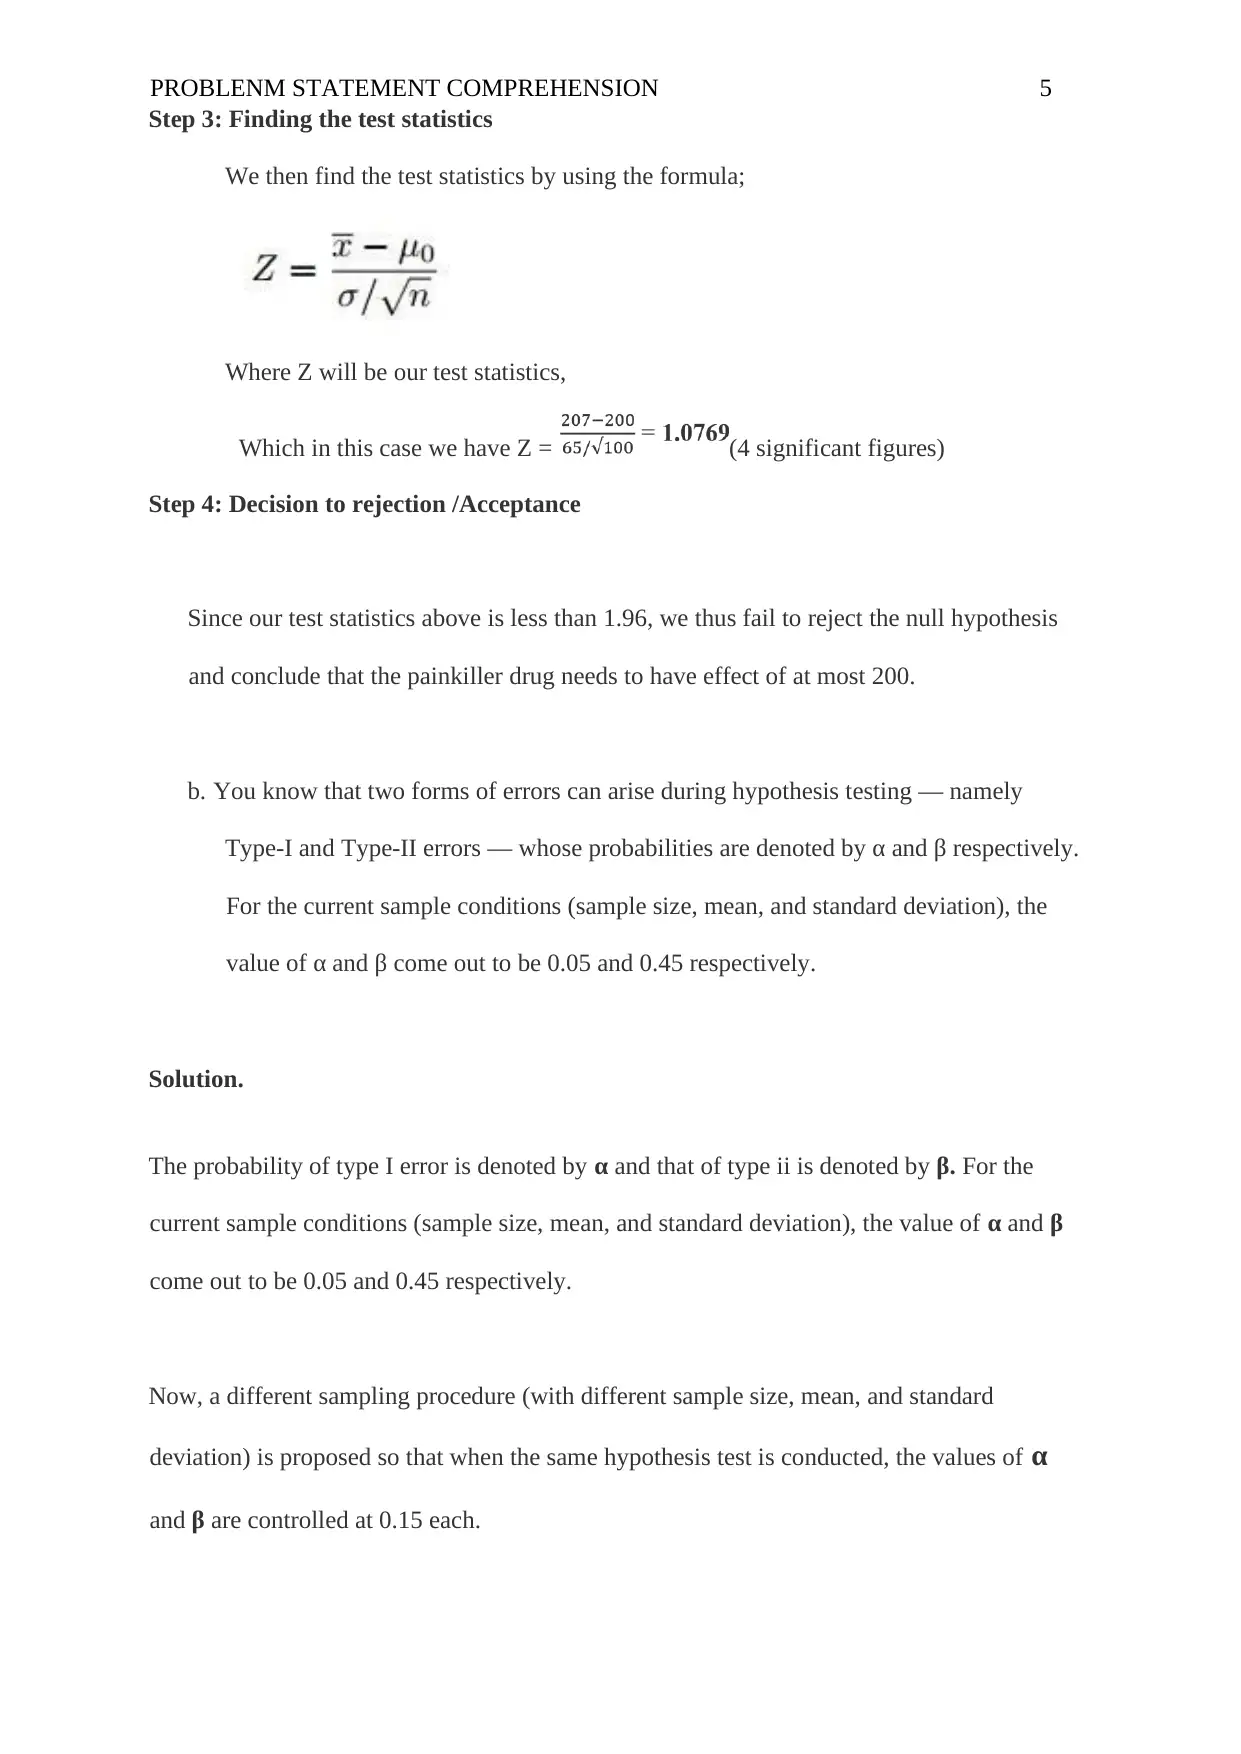
This homework assignment focuses on statistical analysis applied to a pharmaceutical company's drug testing data. The assignment begins with an analysis of a new painkiller drug batch, exploring the probability of satisfactory results using binomial distribution and calculating probabilities. It then delves into estimating population means with confidence intervals and performing hypothesis testing to assess drug effectiveness. The assignment requires students to formulate hypotheses, determine significance levels, calculate test statistics, and make decisions based on the results. Furthermore, it examines Type I and Type II errors, discussing conditions under which each would be more critical. Finally, the assignment concludes with an exploration of A/B testing as a method for optimizing marketing campaigns, providing a stepwise procedure for implementation. The assignment demonstrates the application of statistical concepts to real-world scenarios, enhancing the understanding of probability, hypothesis testing, and experimental design.
1 out of 7
Related Documents


Your All-in-One AI-Powered Toolkit for Academic Success.
+13062052269
info@desklib.com
Available 24*7 on WhatsApp / Email
![[object Object]](/_next/static/media/star-bottom.7253800d.svg)
Copyright © 2020–2026 A2Z Services. All Rights Reserved. Developed and managed by ZUCOL.