Comprehensive Financial Analysis Report: Suncor Energy and Competitors
VerifiedAdded on 2022/10/18
|24
|4180
|107
Report
AI Summary
This comprehensive report offers a detailed financial analysis of Suncor Energy, a Canadian energy company. It assesses the company's current business and financial health using financial ratios, including debt-to-equity, current ratio, earnings per share, and Altman Z-score. The analysis benchmarks Suncor Energy against competitors such as Imperial Oil, Husky Energy, and Cenovus Energy, all operating within the energy sector. The report includes a critical evaluation of the industry sector, comparing the financial strengths and weaknesses of Suncor Energy to its competitors, and evaluates the effectiveness of financial techniques like ratio analysis and Altman Z-score. Recommendations are provided based on the findings, with a reasoned conclusion summarizing the overall financial performance and position of Suncor Energy, supported by relevant financial data and analysis.
Running head: ACCOUNTING STATEMENT ANALYSIS
Accounting Statement Analysis
Name of the Student
Name of the University
Authors Note
Course ID
Accounting Statement Analysis
Name of the Student
Name of the University
Authors Note
Course ID
Paraphrase This Document
Need a fresh take? Get an instant paraphrase of this document with our AI Paraphraser
1ACCOUNTING STATEMENT ANALYSIS
Table of Contents
Introduction:...............................................................................................................................2
Analysis of current business and financial health of Suncor Energy:........................................2
Critical analysis of industry sector:............................................................................................8
Financial analysis of three other companies:.............................................................................9
Critical appraisal of financial strengths and weakness of chosen company compared to listed
competitors:..............................................................................................................................11
Critical Evaluation of Financial Techniques:...........................................................................13
Ratio and Z-Score:...............................................................................................................13
Recommendations:...................................................................................................................15
Conclusion:..............................................................................................................................15
References:...............................................................................................................................16
Appendix:.................................................................................................................................19
Computation of Financial Ratios:............................................................................................19
Suncor Energy:.....................................................................................................................19
Imperial Oil:.........................................................................................................................20
Husky Energy:......................................................................................................................21
Cenovus Energy:..................................................................................................................22
Altman Z- Score:..................................................................................................................23
2ACCOUNTING STATEMENT ANALYSIS
Introduction:
In the modern world of competitive business, analyst often make use of financial
analysis tools as the process of assessing the businesses, projects, budgets and other financial
entities to ascertain their performance and suitability (Williams & Dobelman, 2017).
Characteristically, financial analysis is employed to assess whether the company is stable,
liquid, solvent or profitable enough to warranty the financial investment. The present report is
based on analysing the financial health of Suncor Energy with the help of financial ratios and
Altman Z-Score. The report would accompany a detailed analysis of the industry sector and
also the financial analysis of other three company that are operating in the same sector. The
other three company includes the Imperial Oil, Husky Energy and Cenovus Energy. All the
aforementioned company operate in the energy sector.
To benchmark the financial performance for each company previous year data will be
considered. This would further facilitate the critical appraisal of the financial strength and
weakness of Suncor Energy being the main company against its listed competitors. The report
would also accompany the critical analysis of financial techniques employed in the analysis.
A suitable recommendations would be provided for the chosen company with reasoned
conclusion to summarize the overall findings of the analysis.
Analysis of current business and financial health of Suncor Energy:
Suncor Energy is a Canadian incorporated energy company that specializes itself in
production of synthetic crude oil from the sands. The company current ranks at 134 in the list
of Forbes Global 2000 (Suncor, 2019). The current business of Suncor Energy comprises of
marking of products and services to the retail customers in Ontario with the help of
downstream network of around 280 company owned and approximately 200 customer-
⊘ This is a preview!⊘
Do you want full access?
Subscribe today to unlock all pages.
Trusted by 1+ million students worldwide
3ACCOUNTING STATEMENT ANALYSIS
operated retail and Diesel Fuel sites which is mainly located in Ontario under the brand name
of Suncor Energy.
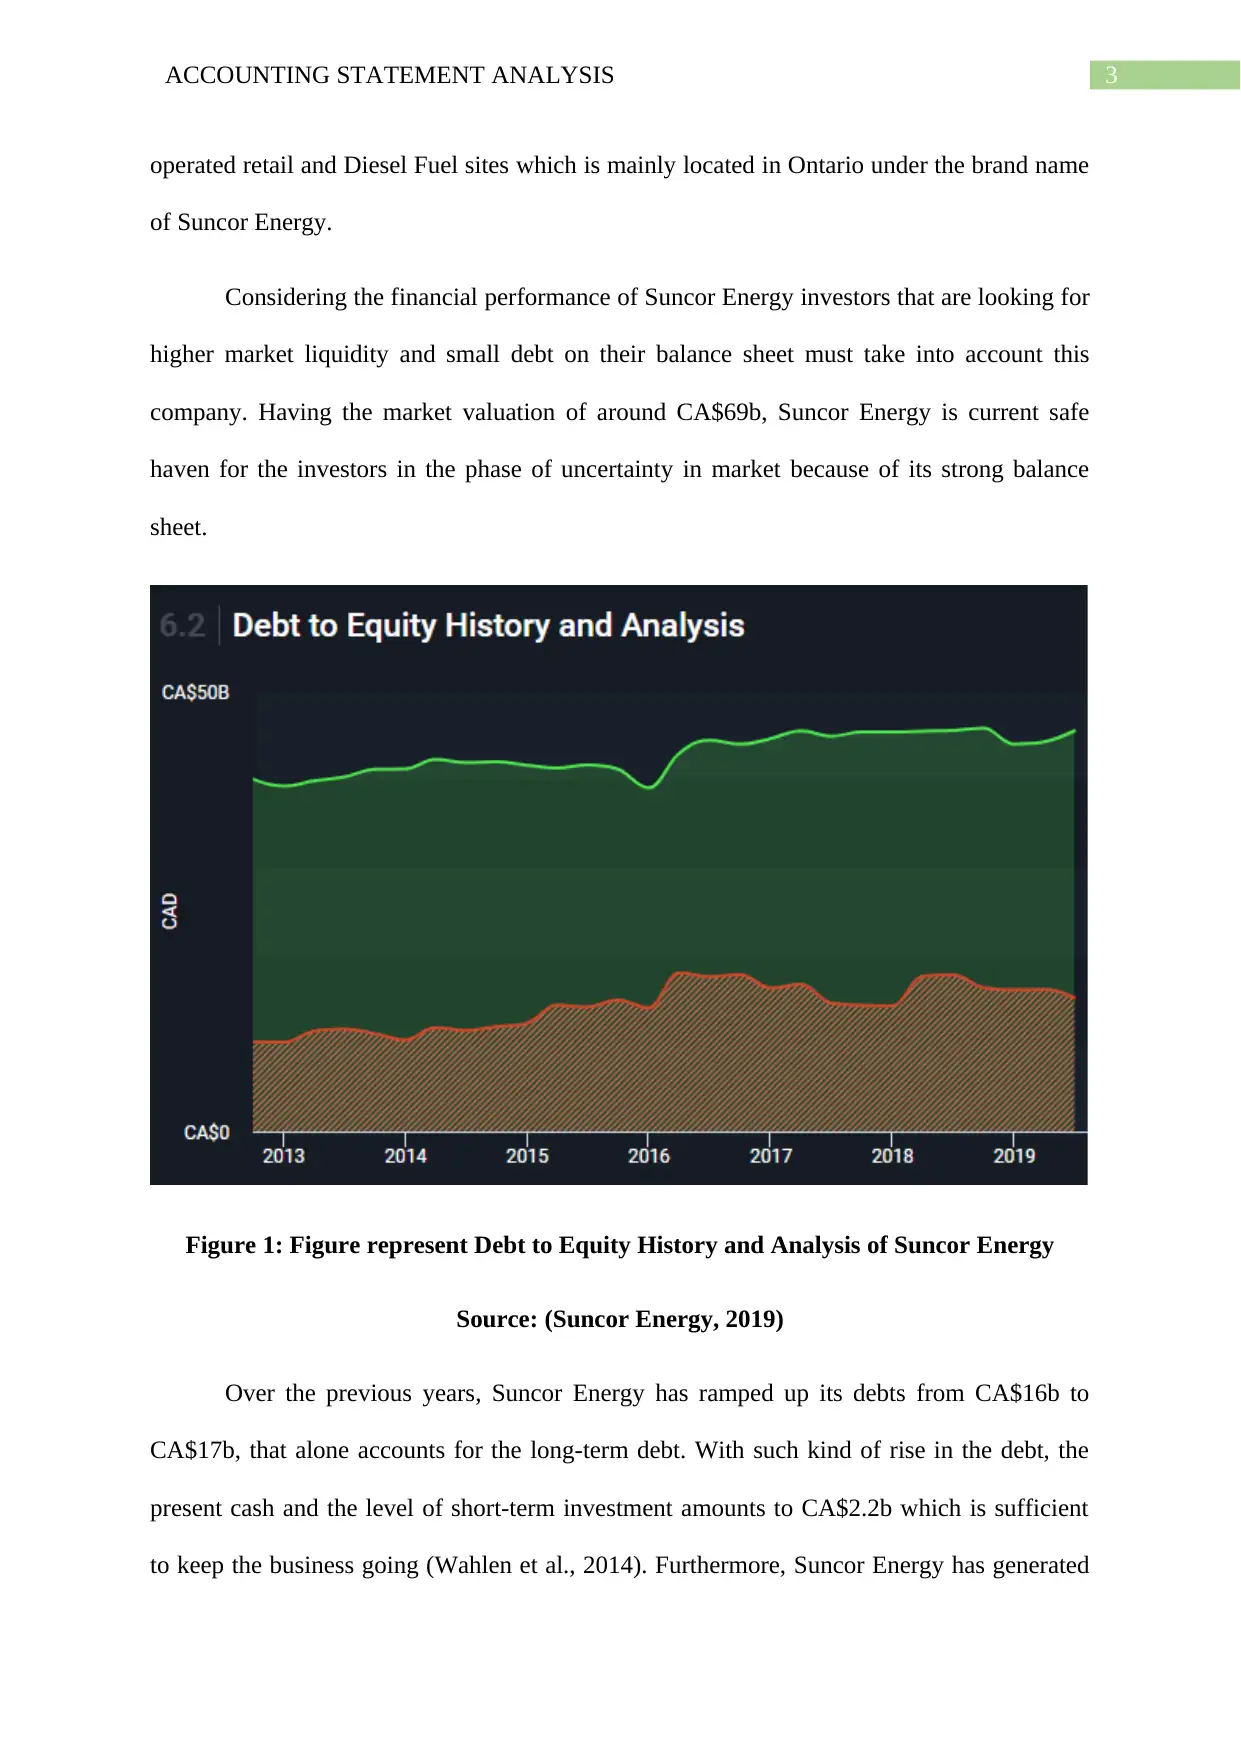
Considering the financial performance of Suncor Energy investors that are looking for
higher market liquidity and small debt on their balance sheet must take into account this
company. Having the market valuation of around CA$69b, Suncor Energy is current safe
haven for the investors in the phase of uncertainty in market because of its strong balance
sheet.
Figure 1: Figure represent Debt to Equity History and Analysis of Suncor Energy
Source: (Suncor Energy, 2019)
Over the previous years, Suncor Energy has ramped up its debts from CA$16b to
CA$17b, that alone accounts for the long-term debt. With such kind of rise in the debt, the
present cash and the level of short-term investment amounts to CA$2.2b which is sufficient
to keep the business going (Wahlen et al., 2014). Furthermore, Suncor Energy has generated
operated retail and Diesel Fuel sites which is mainly located in Ontario under the brand name
of Suncor Energy.
Considering the financial performance of Suncor Energy investors that are looking for
higher market liquidity and small debt on their balance sheet must take into account this
company. Having the market valuation of around CA$69b, Suncor Energy is current safe
haven for the investors in the phase of uncertainty in market because of its strong balance
sheet.
Figure 1: Figure represent Debt to Equity History and Analysis of Suncor Energy
Source: (Suncor Energy, 2019)
Over the previous years, Suncor Energy has ramped up its debts from CA$16b to
CA$17b, that alone accounts for the long-term debt. With such kind of rise in the debt, the
present cash and the level of short-term investment amounts to CA$2.2b which is sufficient
to keep the business going (Wahlen et al., 2014). Furthermore, Suncor Energy has generated
Paraphrase This Document
Need a fresh take? Get an instant paraphrase of this document with our AI Paraphraser
4ACCOUNTING STATEMENT ANALYSIS
a cash of $CA$11b from its operations over the last twelve months resulting to the operating
cash to total debt ratio of 61%. This signals that the amount of operating cash of Suncor
Energy is sufficient to meet its debt.
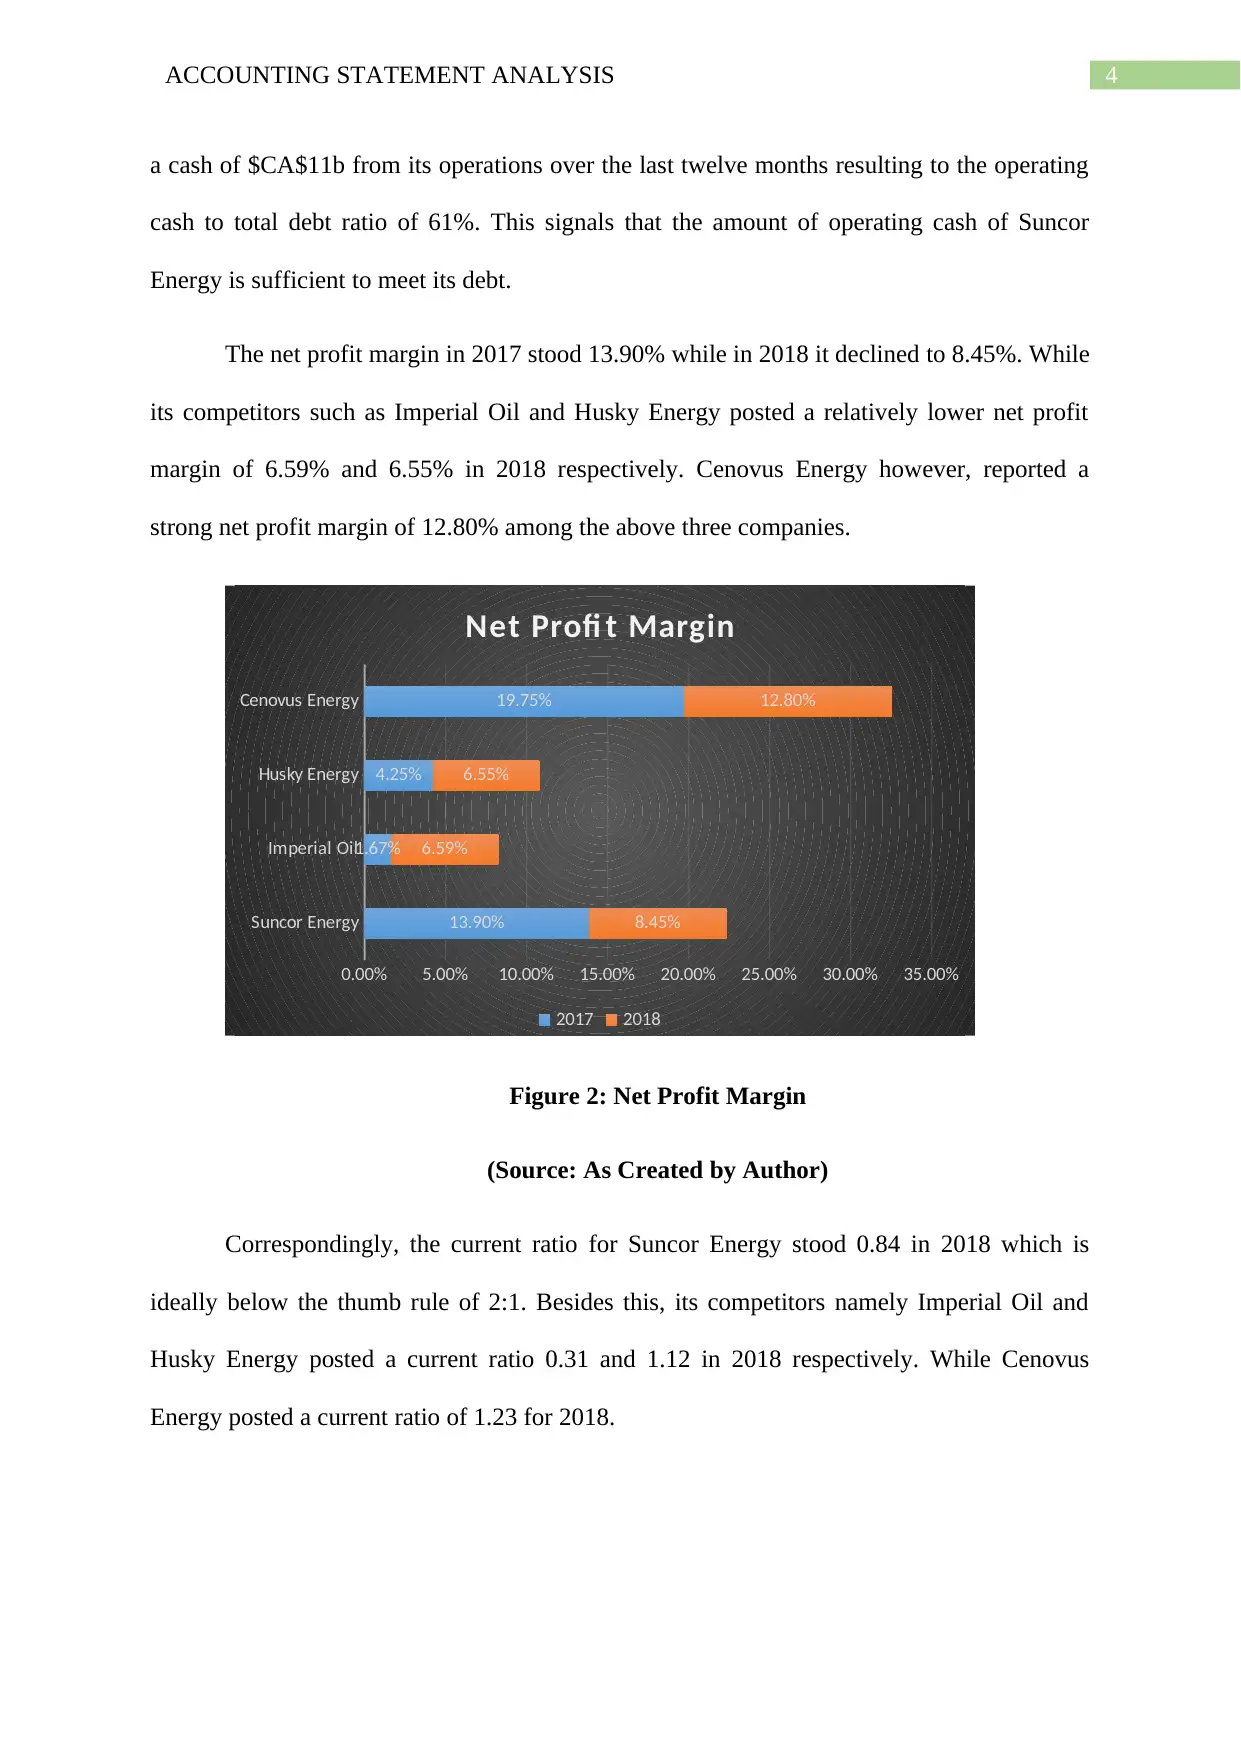
The net profit margin in 2017 stood 13.90% while in 2018 it declined to 8.45%. While
its competitors such as Imperial Oil and Husky Energy posted a relatively lower net profit
margin of 6.59% and 6.55% in 2018 respectively. Cenovus Energy however, reported a
strong net profit margin of 12.80% among the above three companies.
Suncor Energy
Imperial Oil
Husky Energy
Cenovus Energy
0.00% 5.00% 10.00% 15.00% 20.00% 25.00% 30.00% 35.00%
13.90%
1.67%
4.25%
19.75%
8.45%
6.59%
6.55%
12.80%
Net Profi t Margin
2017 2018
Figure 2: Net Profit Margin
(Source: As Created by Author)
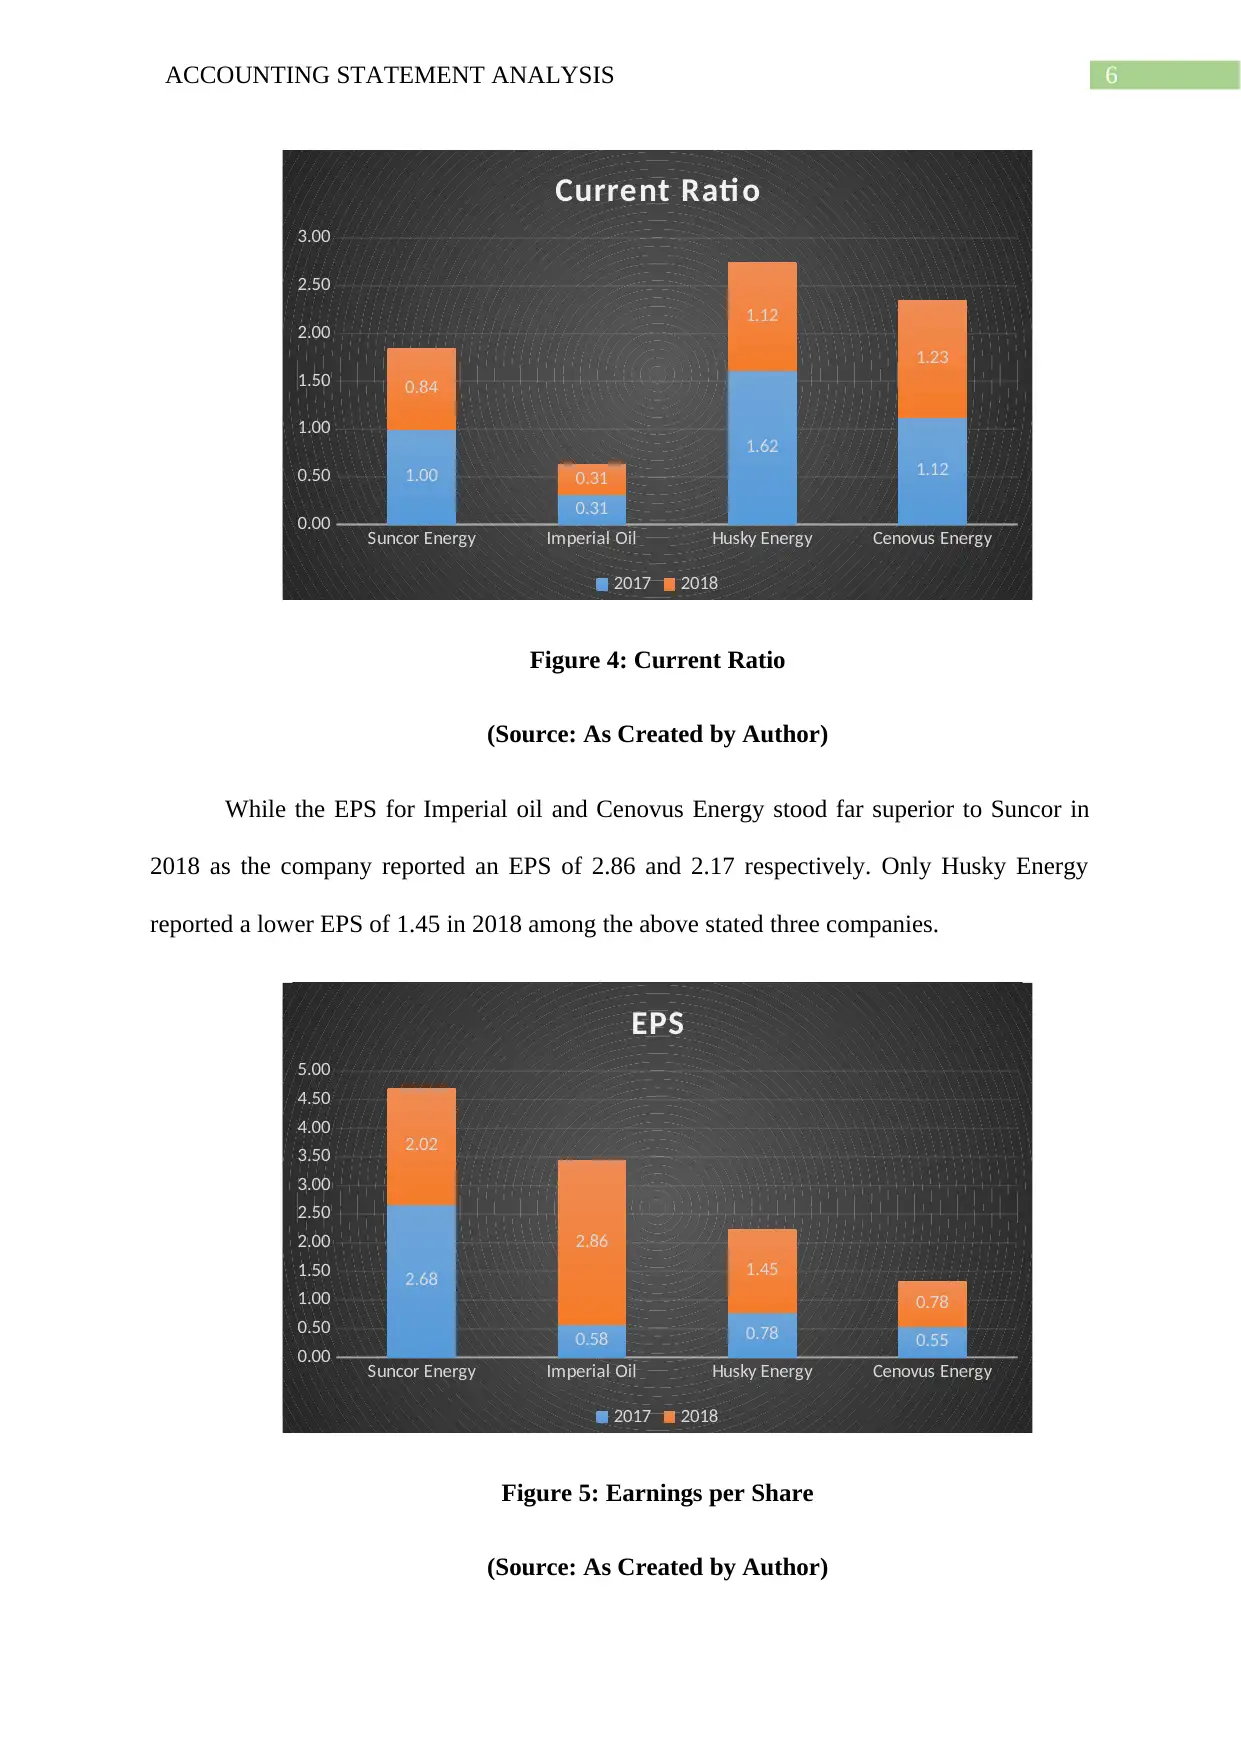
Correspondingly, the current ratio for Suncor Energy stood 0.84 in 2018 which is
ideally below the thumb rule of 2:1. Besides this, its competitors namely Imperial Oil and
Husky Energy posted a current ratio 0.31 and 1.12 in 2018 respectively. While Cenovus
Energy posted a current ratio of 1.23 for 2018.
a cash of $CA$11b from its operations over the last twelve months resulting to the operating
cash to total debt ratio of 61%. This signals that the amount of operating cash of Suncor
Energy is sufficient to meet its debt.
The net profit margin in 2017 stood 13.90% while in 2018 it declined to 8.45%. While
its competitors such as Imperial Oil and Husky Energy posted a relatively lower net profit
margin of 6.59% and 6.55% in 2018 respectively. Cenovus Energy however, reported a
strong net profit margin of 12.80% among the above three companies.
Suncor Energy
Imperial Oil
Husky Energy
Cenovus Energy
0.00% 5.00% 10.00% 15.00% 20.00% 25.00% 30.00% 35.00%
13.90%
1.67%
4.25%
19.75%
8.45%
6.59%
6.55%
12.80%
Net Profi t Margin
2017 2018
Figure 2: Net Profit Margin
(Source: As Created by Author)
Correspondingly, the current ratio for Suncor Energy stood 0.84 in 2018 which is
ideally below the thumb rule of 2:1. Besides this, its competitors namely Imperial Oil and
Husky Energy posted a current ratio 0.31 and 1.12 in 2018 respectively. While Cenovus
Energy posted a current ratio of 1.23 for 2018.
5ACCOUNTING STATEMENT ANALYSIS
Suncor Energy Imperial Oil Husky Energy Cenovus Energy
0.00
0.20
0.40
0.60
0.80
1.00
1.20
1.40
0.36
0.71
0.56
1.12
0.44
0.85
0.63
1.23
Total Asset Turnover Rati o
2017 2018
Figure 3: Total Asset Turnover Ratio
(Source: As Created by Author)
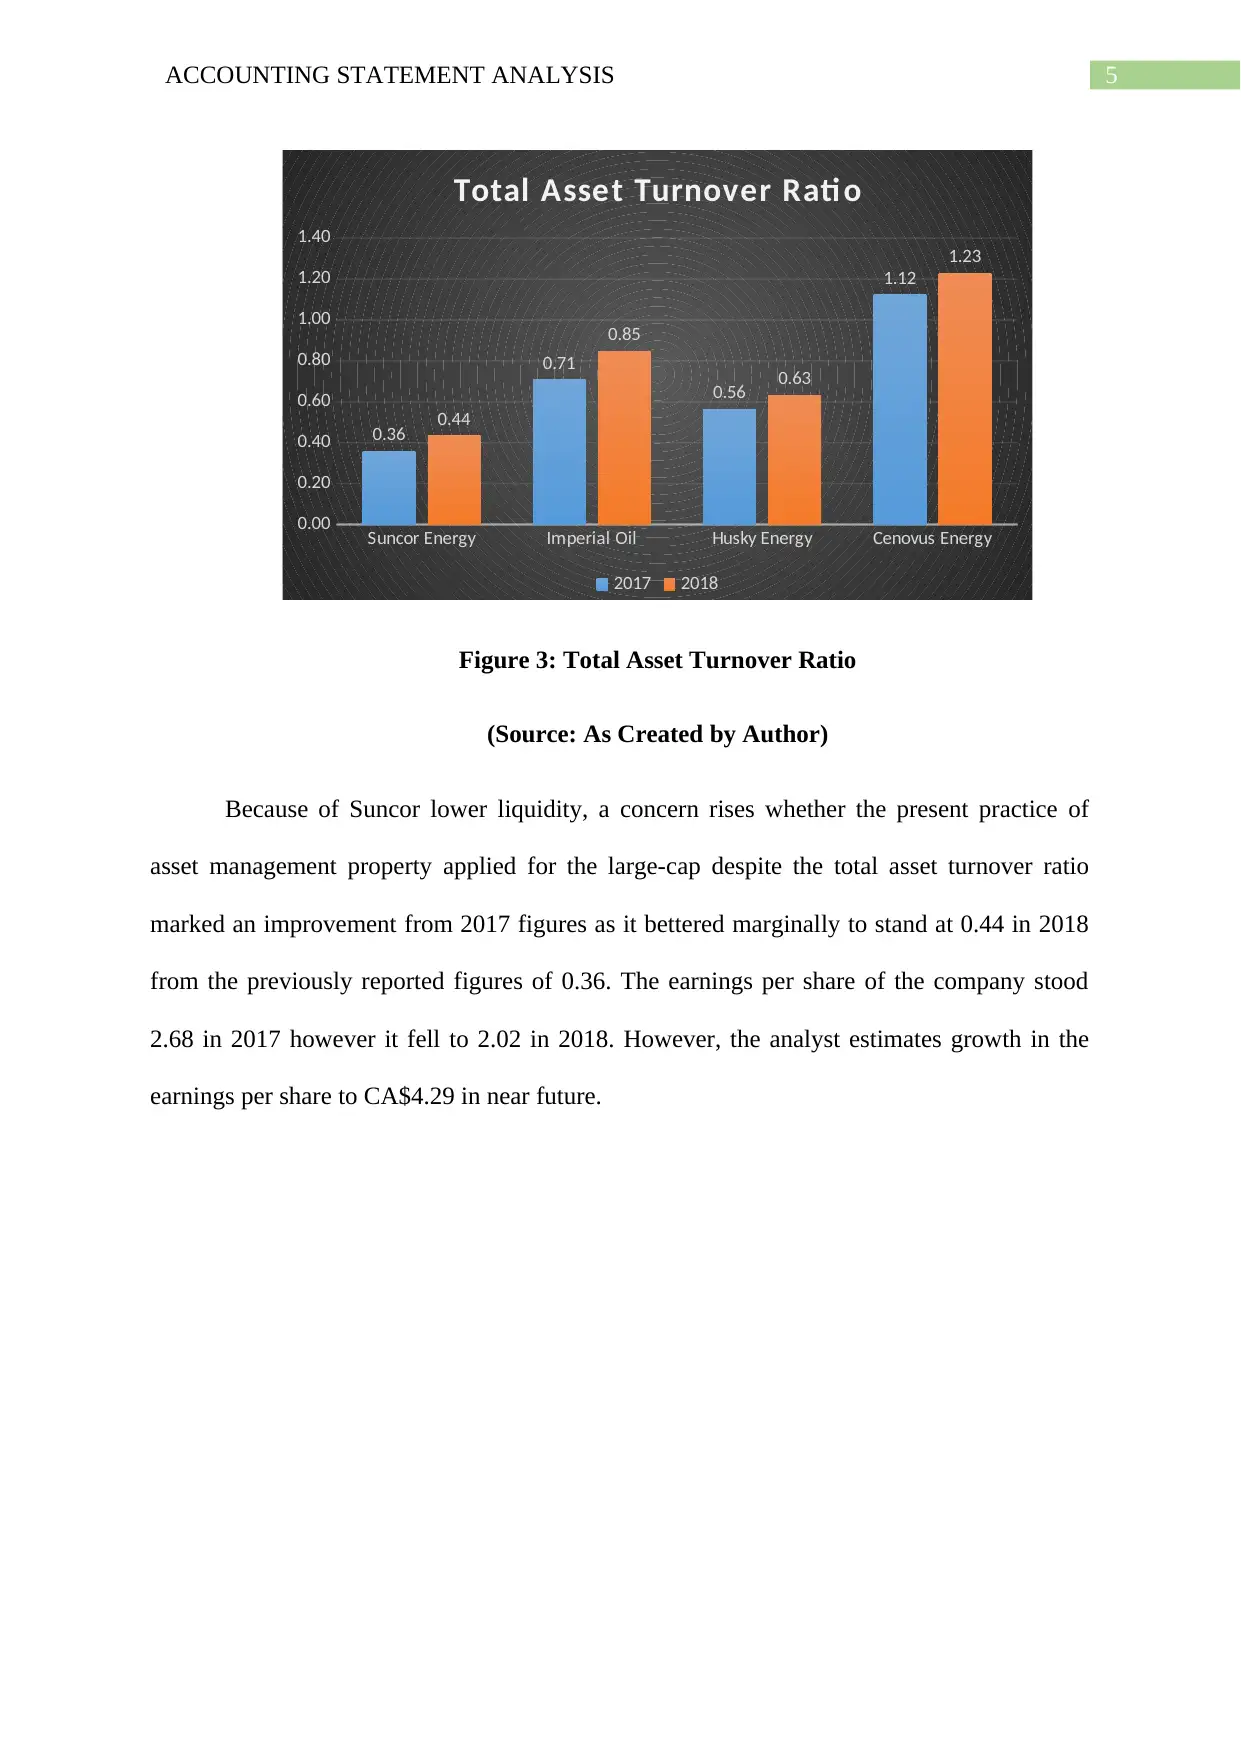
Because of Suncor lower liquidity, a concern rises whether the present practice of
asset management property applied for the large-cap despite the total asset turnover ratio
marked an improvement from 2017 figures as it bettered marginally to stand at 0.44 in 2018
from the previously reported figures of 0.36. The earnings per share of the company stood
2.68 in 2017 however it fell to 2.02 in 2018. However, the analyst estimates growth in the
earnings per share to CA$4.29 in near future.
Suncor Energy Imperial Oil Husky Energy Cenovus Energy
0.00
0.20
0.40
0.60
0.80
1.00
1.20
1.40
0.36
0.71
0.56
1.12
0.44
0.85
0.63
1.23
Total Asset Turnover Rati o
2017 2018
Figure 3: Total Asset Turnover Ratio
(Source: As Created by Author)
Because of Suncor lower liquidity, a concern rises whether the present practice of
asset management property applied for the large-cap despite the total asset turnover ratio
marked an improvement from 2017 figures as it bettered marginally to stand at 0.44 in 2018
from the previously reported figures of 0.36. The earnings per share of the company stood
2.68 in 2017 however it fell to 2.02 in 2018. However, the analyst estimates growth in the
earnings per share to CA$4.29 in near future.
⊘ This is a preview!⊘
Do you want full access?
Subscribe today to unlock all pages.
Trusted by 1+ million students worldwide
6ACCOUNTING STATEMENT ANALYSIS
Suncor Energy Imperial Oil Husky Energy Cenovus Energy
0.00
0.50
1.00
1.50
2.00
2.50
3.00
1.00
0.31
1.62
1.12
0.84
0.31
1.12
1.23
Current Rati o
2017 2018
Figure 4: Current Ratio
(Source: As Created by Author)
While the EPS for Imperial oil and Cenovus Energy stood far superior to Suncor in
2018 as the company reported an EPS of 2.86 and 2.17 respectively. Only Husky Energy
reported a lower EPS of 1.45 in 2018 among the above stated three companies.
Suncor Energy Imperial Oil Husky Energy Cenovus Energy
0.00
0.50
1.00
1.50
2.00
2.50
3.00
3.50
4.00
4.50
5.00
2.68
0.58 0.78 0.55
2.02
2.86
1.45
0.78
EPS
2017 2018
Figure 5: Earnings per Share
(Source: As Created by Author)
Suncor Energy Imperial Oil Husky Energy Cenovus Energy
0.00
0.50
1.00
1.50
2.00
2.50
3.00
1.00
0.31
1.62
1.12
0.84
0.31
1.12
1.23
Current Rati o
2017 2018
Figure 4: Current Ratio
(Source: As Created by Author)
While the EPS for Imperial oil and Cenovus Energy stood far superior to Suncor in
2018 as the company reported an EPS of 2.86 and 2.17 respectively. Only Husky Energy
reported a lower EPS of 1.45 in 2018 among the above stated three companies.
Suncor Energy Imperial Oil Husky Energy Cenovus Energy
0.00
0.50
1.00
1.50
2.00
2.50
3.00
3.50
4.00
4.50
5.00
2.68
0.58 0.78 0.55
2.02
2.86
1.45
0.78
EPS
2017 2018
Figure 5: Earnings per Share
(Source: As Created by Author)
Paraphrase This Document
Need a fresh take? Get an instant paraphrase of this document with our AI Paraphraser
7ACCOUNTING STATEMENT ANALYSIS
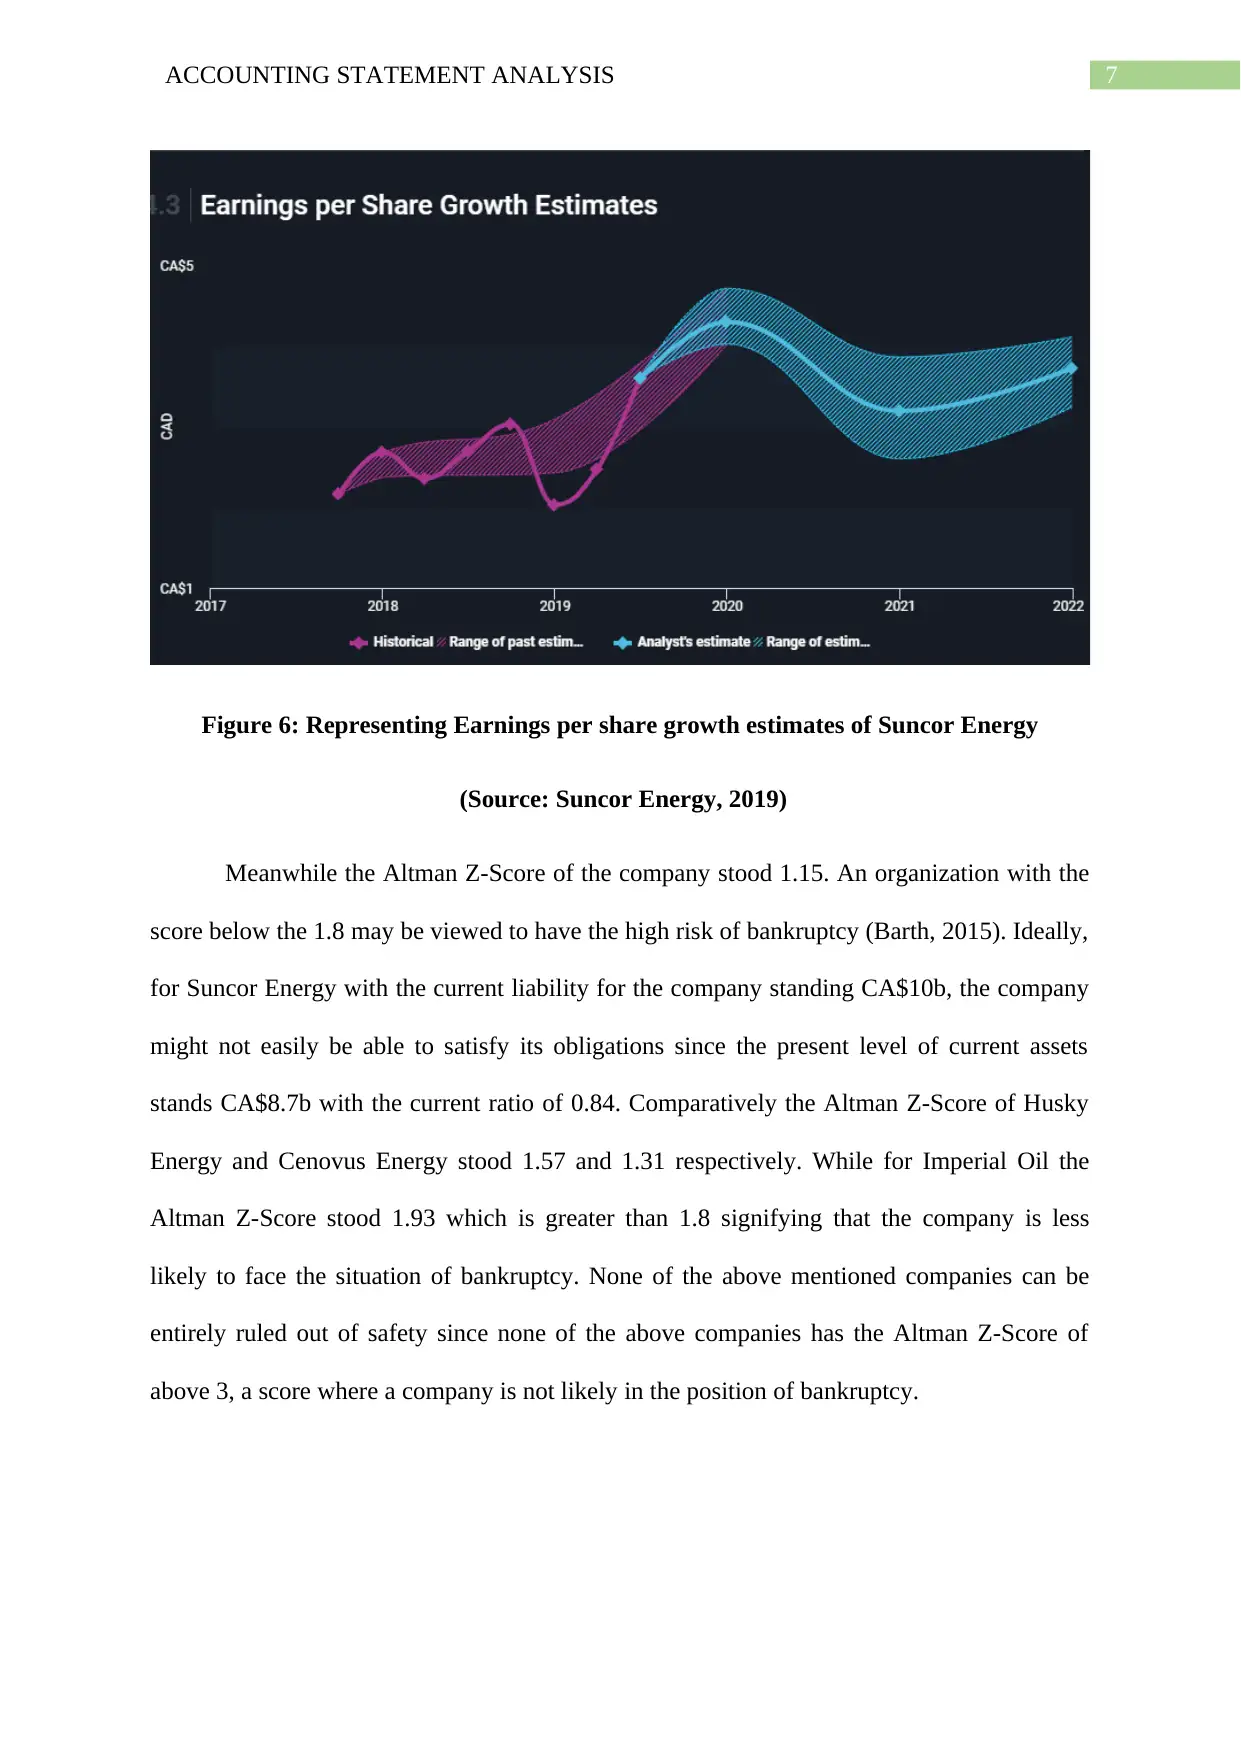
Figure 6: Representing Earnings per share growth estimates of Suncor Energy
(Source: Suncor Energy, 2019)
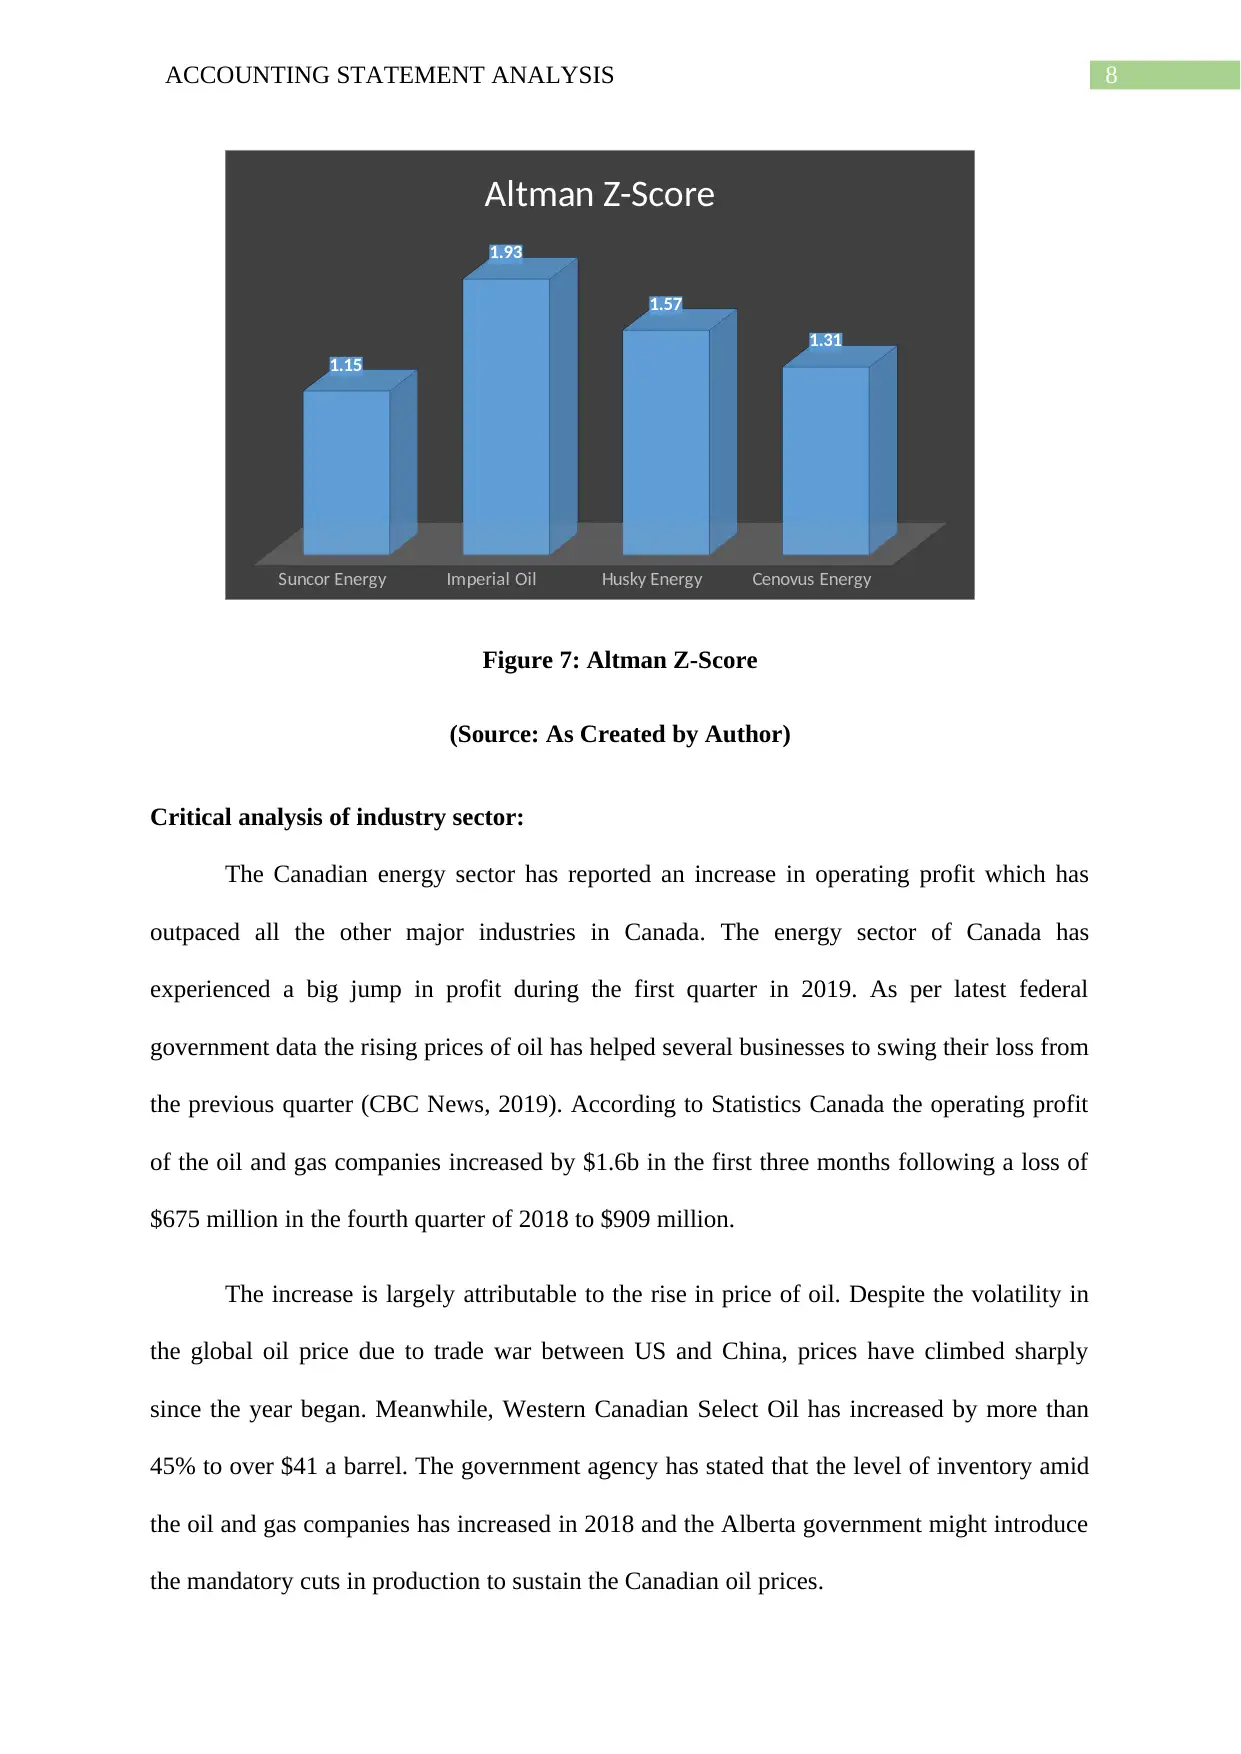
Meanwhile the Altman Z-Score of the company stood 1.15. An organization with the
score below the 1.8 may be viewed to have the high risk of bankruptcy (Barth, 2015). Ideally,
for Suncor Energy with the current liability for the company standing CA$10b, the company
might not easily be able to satisfy its obligations since the present level of current assets
stands CA$8.7b with the current ratio of 0.84. Comparatively the Altman Z-Score of Husky
Energy and Cenovus Energy stood 1.57 and 1.31 respectively. While for Imperial Oil the
Altman Z-Score stood 1.93 which is greater than 1.8 signifying that the company is less
likely to face the situation of bankruptcy. None of the above mentioned companies can be
entirely ruled out of safety since none of the above companies has the Altman Z-Score of
above 3, a score where a company is not likely in the position of bankruptcy.
Figure 6: Representing Earnings per share growth estimates of Suncor Energy
(Source: Suncor Energy, 2019)
Meanwhile the Altman Z-Score of the company stood 1.15. An organization with the
score below the 1.8 may be viewed to have the high risk of bankruptcy (Barth, 2015). Ideally,
for Suncor Energy with the current liability for the company standing CA$10b, the company
might not easily be able to satisfy its obligations since the present level of current assets
stands CA$8.7b with the current ratio of 0.84. Comparatively the Altman Z-Score of Husky
Energy and Cenovus Energy stood 1.57 and 1.31 respectively. While for Imperial Oil the
Altman Z-Score stood 1.93 which is greater than 1.8 signifying that the company is less
likely to face the situation of bankruptcy. None of the above mentioned companies can be
entirely ruled out of safety since none of the above companies has the Altman Z-Score of
above 3, a score where a company is not likely in the position of bankruptcy.
8ACCOUNTING STATEMENT ANALYSIS
Suncor Energy Imperial Oil Husky Energy Cenovus Energy
1.15
1.93
1.57
1.31
Altman Z-Score
Figure 7: Altman Z-Score
(Source: As Created by Author)
Critical analysis of industry sector:
The Canadian energy sector has reported an increase in operating profit which has
outpaced all the other major industries in Canada. The energy sector of Canada has
experienced a big jump in profit during the first quarter in 2019. As per latest federal
government data the rising prices of oil has helped several businesses to swing their loss from
the previous quarter (CBC News, 2019). According to Statistics Canada the operating profit
of the oil and gas companies increased by $1.6b in the first three months following a loss of
$675 million in the fourth quarter of 2018 to $909 million.
The increase is largely attributable to the rise in price of oil. Despite the volatility in
the global oil price due to trade war between US and China, prices have climbed sharply
since the year began. Meanwhile, Western Canadian Select Oil has increased by more than
45% to over $41 a barrel. The government agency has stated that the level of inventory amid
the oil and gas companies has increased in 2018 and the Alberta government might introduce
the mandatory cuts in production to sustain the Canadian oil prices.
⊘ This is a preview!⊘
Do you want full access?
Subscribe today to unlock all pages.
Trusted by 1+ million students worldwide
9ACCOUNTING STATEMENT ANALYSIS
Financial analysis of three other companies:
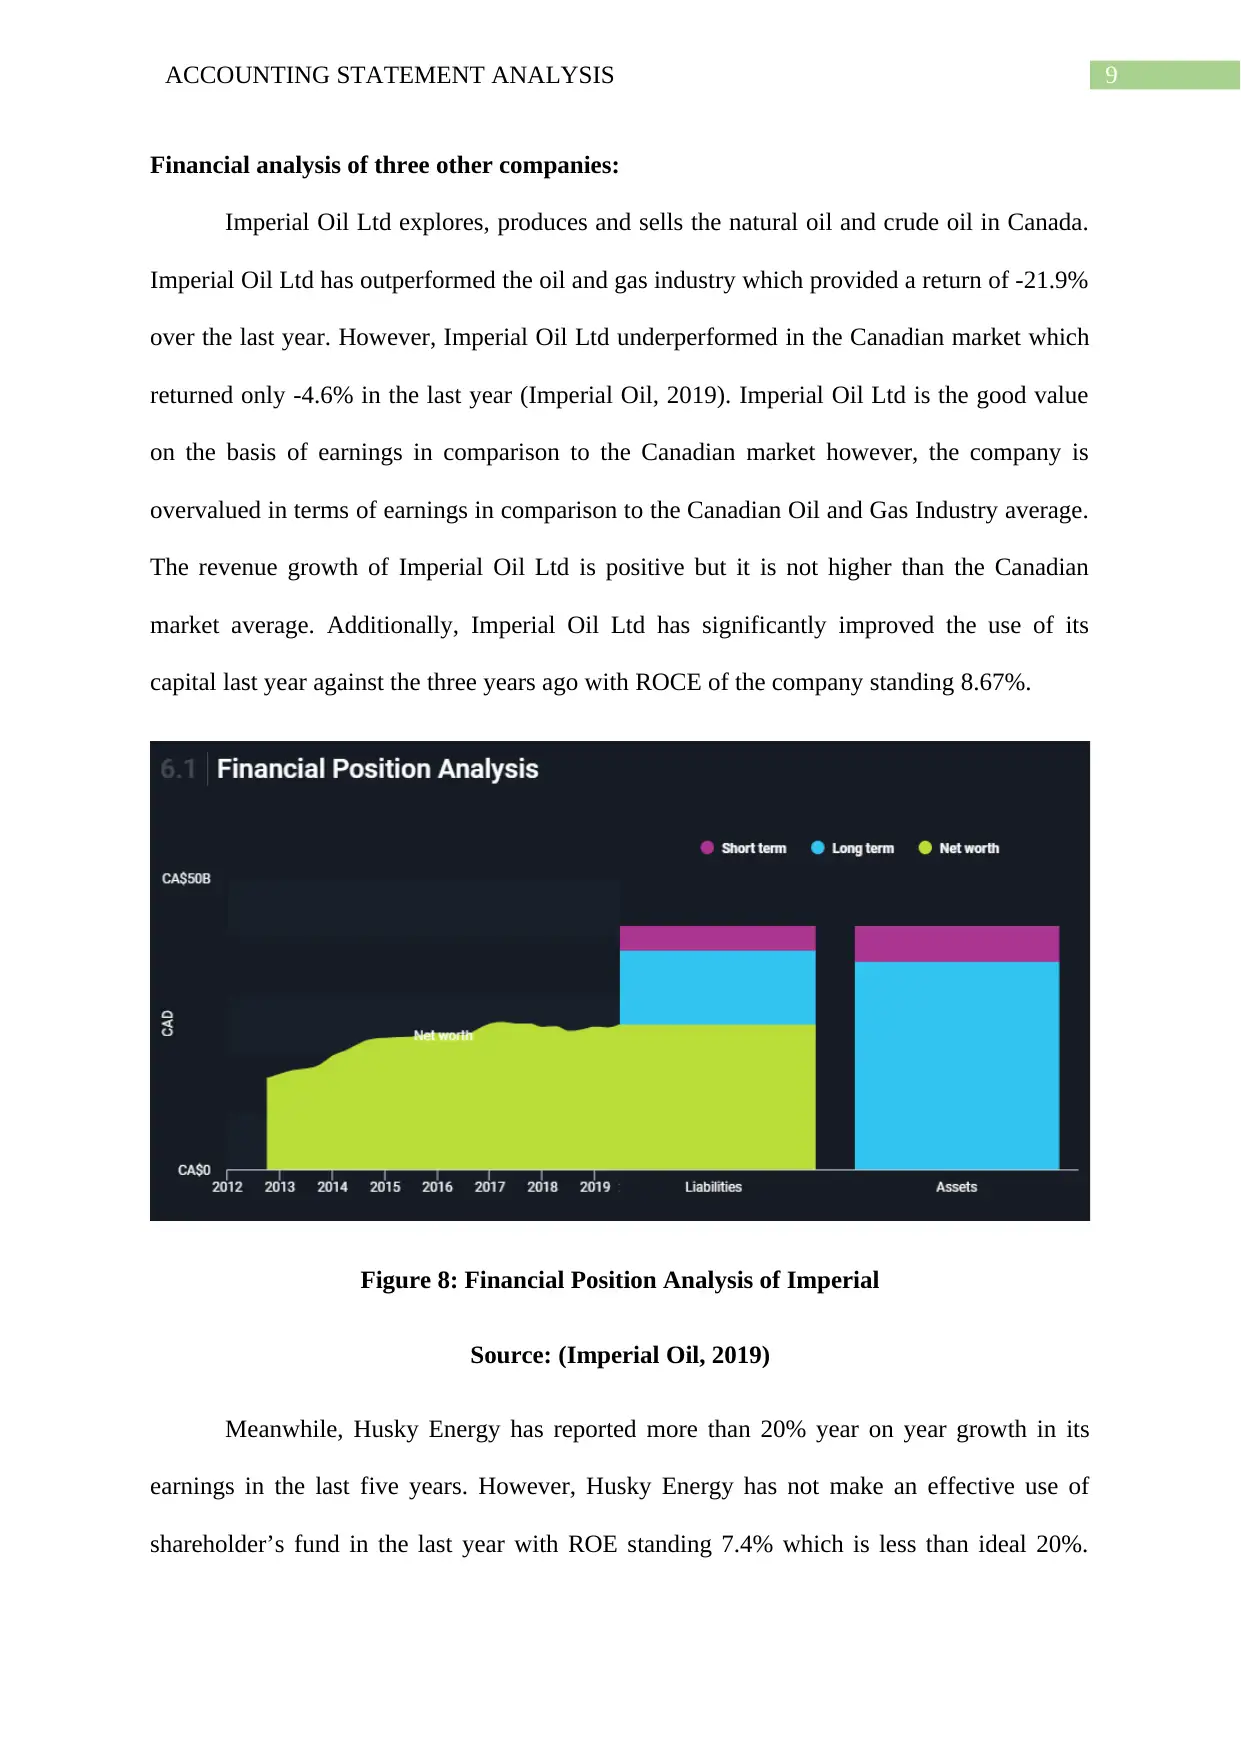
Imperial Oil Ltd explores, produces and sells the natural oil and crude oil in Canada.
Imperial Oil Ltd has outperformed the oil and gas industry which provided a return of -21.9%
over the last year. However, Imperial Oil Ltd underperformed in the Canadian market which
returned only -4.6% in the last year (Imperial Oil, 2019). Imperial Oil Ltd is the good value
on the basis of earnings in comparison to the Canadian market however, the company is
overvalued in terms of earnings in comparison to the Canadian Oil and Gas Industry average.
The revenue growth of Imperial Oil Ltd is positive but it is not higher than the Canadian
market average. Additionally, Imperial Oil Ltd has significantly improved the use of its
capital last year against the three years ago with ROCE of the company standing 8.67%.
Figure 8: Financial Position Analysis of Imperial
Source: (Imperial Oil, 2019)
Meanwhile, Husky Energy has reported more than 20% year on year growth in its
earnings in the last five years. However, Husky Energy has not make an effective use of
shareholder’s fund in the last year with ROE standing 7.4% which is less than ideal 20%.
Financial analysis of three other companies:
Imperial Oil Ltd explores, produces and sells the natural oil and crude oil in Canada.
Imperial Oil Ltd has outperformed the oil and gas industry which provided a return of -21.9%
over the last year. However, Imperial Oil Ltd underperformed in the Canadian market which
returned only -4.6% in the last year (Imperial Oil, 2019). Imperial Oil Ltd is the good value
on the basis of earnings in comparison to the Canadian market however, the company is
overvalued in terms of earnings in comparison to the Canadian Oil and Gas Industry average.
The revenue growth of Imperial Oil Ltd is positive but it is not higher than the Canadian
market average. Additionally, Imperial Oil Ltd has significantly improved the use of its
capital last year against the three years ago with ROCE of the company standing 8.67%.
Figure 8: Financial Position Analysis of Imperial
Source: (Imperial Oil, 2019)
Meanwhile, Husky Energy has reported more than 20% year on year growth in its
earnings in the last five years. However, Husky Energy has not make an effective use of
shareholder’s fund in the last year with ROE standing 7.4% which is less than ideal 20%.
Paraphrase This Document
Need a fresh take? Get an instant paraphrase of this document with our AI Paraphraser
10ACCOUNTING STATEMENT ANALYSIS
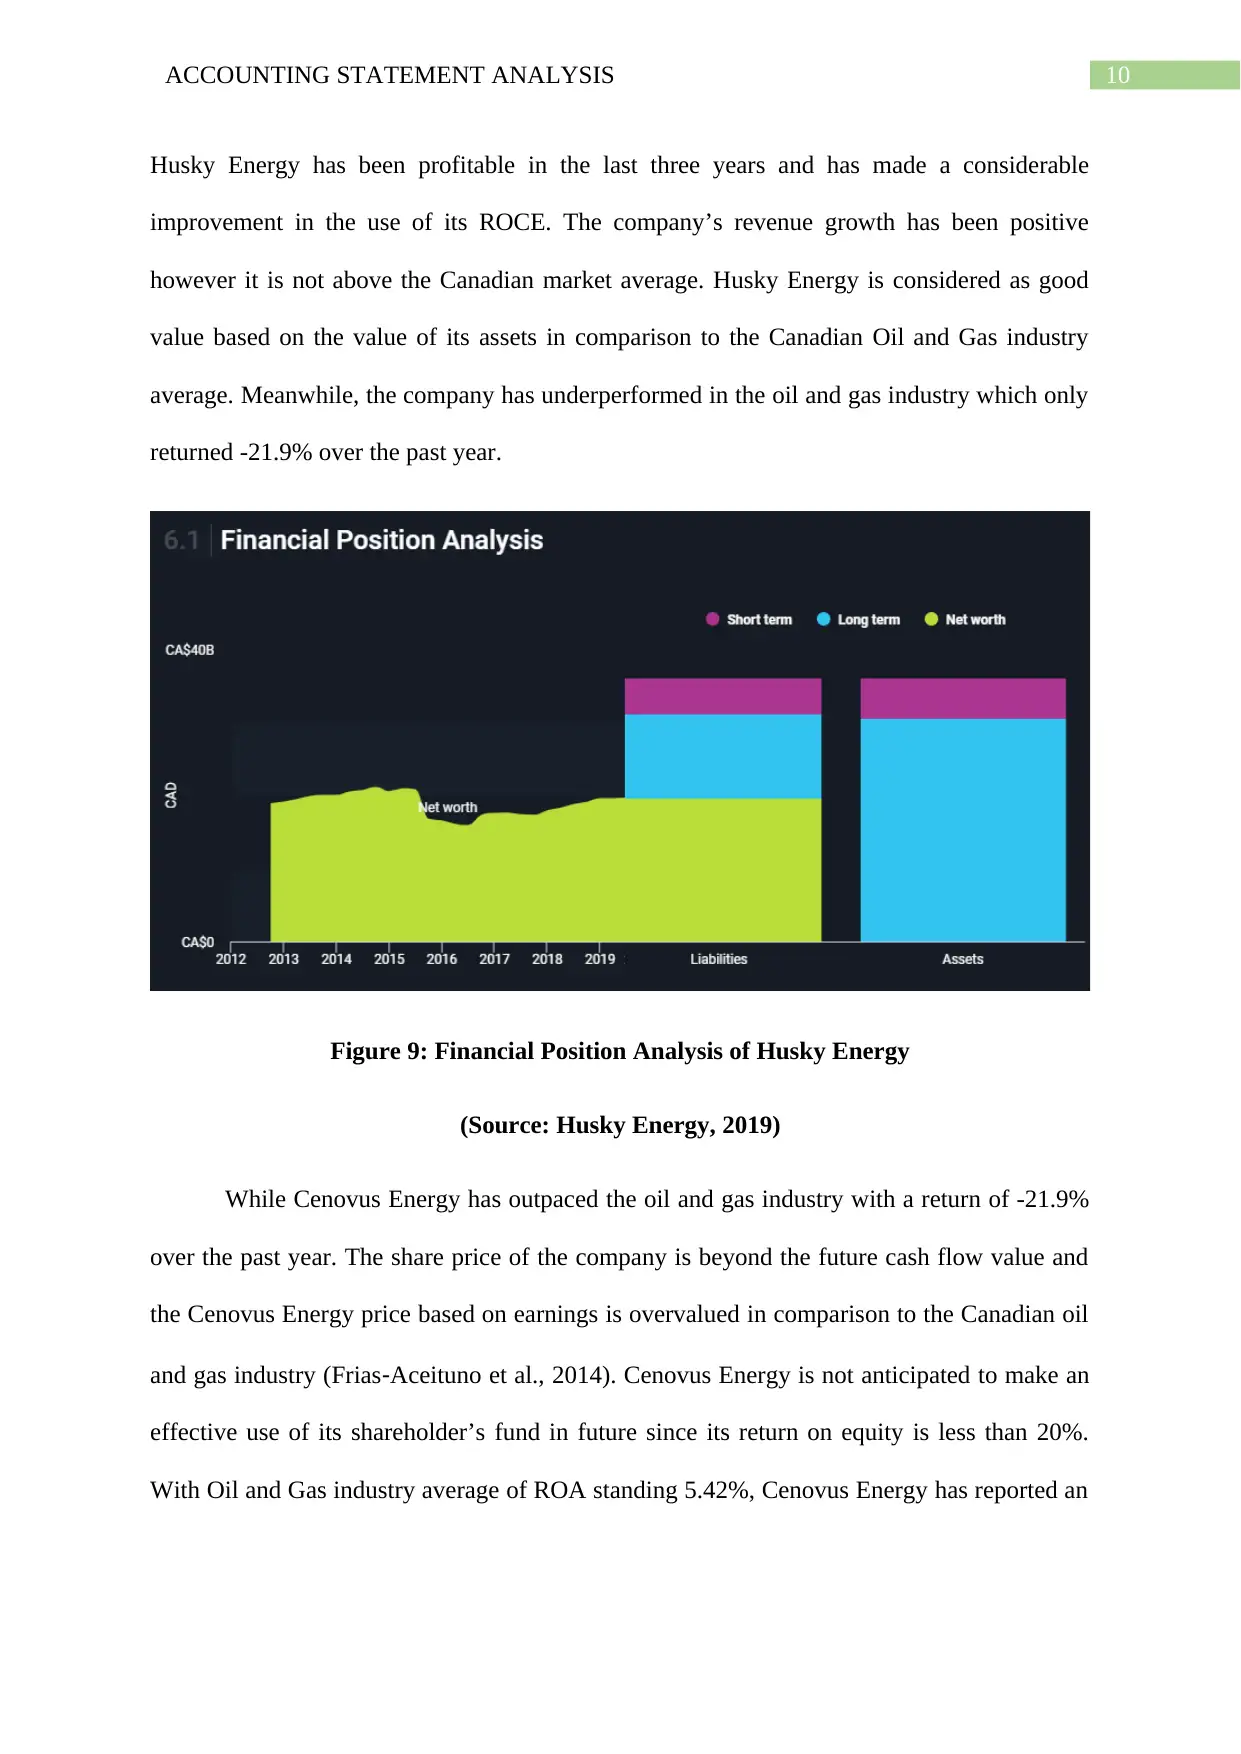
Husky Energy has been profitable in the last three years and has made a considerable
improvement in the use of its ROCE. The company’s revenue growth has been positive
however it is not above the Canadian market average. Husky Energy is considered as good
value based on the value of its assets in comparison to the Canadian Oil and Gas industry
average. Meanwhile, the company has underperformed in the oil and gas industry which only
returned -21.9% over the past year.
Figure 9: Financial Position Analysis of Husky Energy
(Source: Husky Energy, 2019)
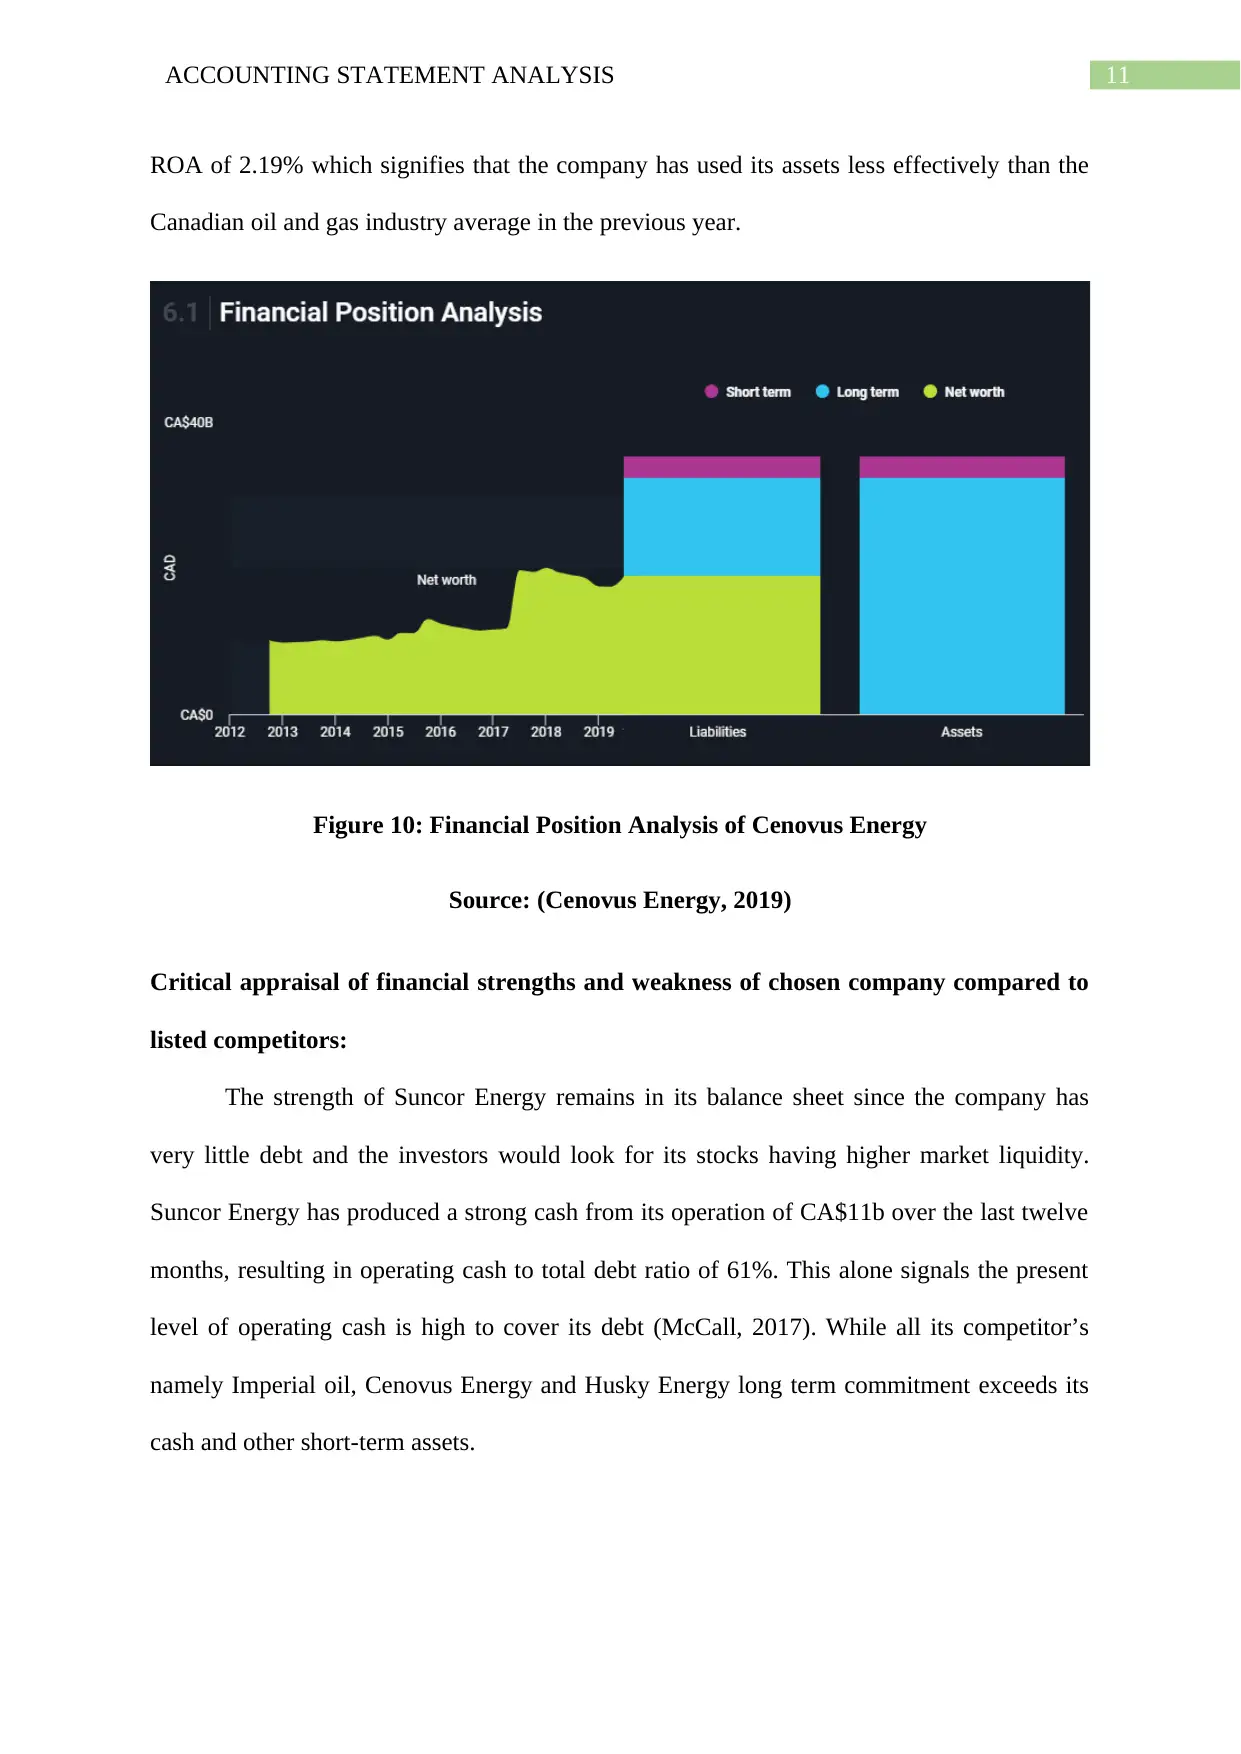
While Cenovus Energy has outpaced the oil and gas industry with a return of -21.9%
over the past year. The share price of the company is beyond the future cash flow value and
the Cenovus Energy price based on earnings is overvalued in comparison to the Canadian oil
and gas industry (Frias‐Aceituno et al., 2014). Cenovus Energy is not anticipated to make an
effective use of its shareholder’s fund in future since its return on equity is less than 20%.
With Oil and Gas industry average of ROA standing 5.42%, Cenovus Energy has reported an
Husky Energy has been profitable in the last three years and has made a considerable
improvement in the use of its ROCE. The company’s revenue growth has been positive
however it is not above the Canadian market average. Husky Energy is considered as good
value based on the value of its assets in comparison to the Canadian Oil and Gas industry
average. Meanwhile, the company has underperformed in the oil and gas industry which only
returned -21.9% over the past year.
Figure 9: Financial Position Analysis of Husky Energy
(Source: Husky Energy, 2019)
While Cenovus Energy has outpaced the oil and gas industry with a return of -21.9%
over the past year. The share price of the company is beyond the future cash flow value and
the Cenovus Energy price based on earnings is overvalued in comparison to the Canadian oil
and gas industry (Frias‐Aceituno et al., 2014). Cenovus Energy is not anticipated to make an
effective use of its shareholder’s fund in future since its return on equity is less than 20%.
With Oil and Gas industry average of ROA standing 5.42%, Cenovus Energy has reported an
11ACCOUNTING STATEMENT ANALYSIS
ROA of 2.19% which signifies that the company has used its assets less effectively than the
Canadian oil and gas industry average in the previous year.
Figure 10: Financial Position Analysis of Cenovus Energy
Source: (Cenovus Energy, 2019)
Critical appraisal of financial strengths and weakness of chosen company compared to
listed competitors:
The strength of Suncor Energy remains in its balance sheet since the company has
very little debt and the investors would look for its stocks having higher market liquidity.
Suncor Energy has produced a strong cash from its operation of CA$11b over the last twelve
months, resulting in operating cash to total debt ratio of 61%. This alone signals the present
level of operating cash is high to cover its debt (McCall, 2017). While all its competitor’s
namely Imperial oil, Cenovus Energy and Husky Energy long term commitment exceeds its
cash and other short-term assets.
⊘ This is a preview!⊘
Do you want full access?
Subscribe today to unlock all pages.
Trusted by 1+ million students worldwide
1 out of 24
Related Documents


Your All-in-One AI-Powered Toolkit for Academic Success.
+13062052269
info@desklib.com
Available 24*7 on WhatsApp / Email
![[object Object]](/_next/static/media/star-bottom.7253800d.svg)
Unlock your academic potential
Copyright © 2020–2026 A2Z Services. All Rights Reserved. Developed and managed by ZUCOL.