HI5002 Finance: Analysis of Suncorp Group's Financial Performance
VerifiedAdded on 2022/09/16
|13
|2858
|16
Report
AI Summary
This report provides a comprehensive financial analysis of Suncorp Group Limited. It examines the company's financial performance through various determinants including ratio analysis, products and services, liquidity, capital structure, non-current asset analysis, scenario analysis, share price movements, and P/E ratios. The analysis covers the company's performance over a three-year period and offers detailed recommendations based on the findings. The report highlights the company's strengths and weaknesses, particularly in terms of liquidity and capital structure, and suggests strategies for improvement. The study also includes a scenario analysis to evaluate potential outcomes and a review of the company's share price movements in relation to the ASX index. Overall, the report aims to provide insights into Suncorp Group's financial health and guide future decision-making.

Running Head: FINANCE 1
FINANCE
FINANCE
Paraphrase This Document
Need a fresh take? Get an instant paraphrase of this document with our AI Paraphraser
Running Head: FINANCE
Abstract
Suncorp Group Limited is one of the most renowned companies in terms of the financial
advisory services, however as per the analysis of the report t was found that the liquidity position
and the capital structure format of the company it becomes imperative for the company to deliver
the best services it can to bring back the identity. Further the company muts also take care of the
share price movements and the cost it has to bear. The report is segregated in detail and defines
the results of the parameters that have been measured.
Running Head: FINANCE
Contents
Abstract.......................................................................................................................................................2
Introduction.................................................................................................................................................4
Financial analysis........................................................................................................................................4
Products and Services..............................................................................................................................4
Calculation..............................................................................................................................................5
Liquidity..................................................................................................................................................5
Capital structure......................................................................................................................................5
Non-current asset analysis...........................................................................................................................6
Scenario analysis.........................................................................................................................................7
Latest share or bond issuance......................................................................................................................8
P/E ratios and Share price movements.........................................................................................................8
Recommendation letter..............................................................................................................................11
Conclusion.................................................................................................................................................11
References.................................................................................................................................................13
⊘ This is a preview!⊘
Do you want full access?
Subscribe today to unlock all pages.
Trusted by 1+ million students worldwide
Running Head: FINANCE
Introduction
Financial analysis is the analysis that has been undertaken by the company in order to have an in-
depth analysis through various determinants such as ratio analysis, the products and the services
the company operates in, the analysis of the non-current assets, the scenario analysis, and
issuance of bonds and movement of share price. In this report the analysis of Suncorp Group
limited has been undertaken and the recommendations have been provided in detail so that the
company can make the necessary changes if required. These techniques and the tools are
implemented in order to have a detailed analysis of the Suncorp Group limited (Smith,
Henderson and Ginger, 2015).
Financial analysis
Products and Services
Suncorp Group limited is one of the finest companies in Australia engaged in the business of
providing the financial services enabling more than 9 million customers to better protect and
accelerate their overall well-being. Suncorp Group Limited is an Australian company and
banking partnership situated in Brisbane, Queensland, Australia (Suncorp Group, 2018). It is one
of Australia's moderate size banks (by consolidated loaning and stores) and its biggest general
protection group, framed on 1 December 1996 by the merger of Suncorp, Metway Bank and the
Queensland Industry Development Corporation (QIDC). The products and the services that are
majorly provided by Suncorp group Limited is providing the services like banking, wealth
management and the insurance products and services through the well-recognized services like
Suncorp, AAMI, GIO, Apia, Shannons and Vero. Apart from that the services of general
Paraphrase This Document
Need a fresh take? Get an instant paraphrase of this document with our AI Paraphraser
Running Head: FINANCE
insurance, life insurance, superannuation and finance have been provided by Suncrop Limited
(Suncorp Group, 2019).
Calculation
The financial analysis has been carried out in the form of the ratio analysis. It is a technique
which is used by the management to evaluate the monetary performance of the company over the
period of last three years. The different parameters or the metrics that have been used by the
company are in case of the liquidity and the capital structure feasibility of the company. On the
top of it the ratio analysis has been discussed in detail for the three years to get a relevant idea of
the changes that have taken place (Linnenluecke, Birt, Lyon and Sidhu, 2015).
Liquidity
The liquidity scenario is the condition which depicts the ability of the company to pay back the
contractual obligation with the use of the current assets so that the cash is utilized in the potential
areas. The liquidity of the company can be judged on the basis of two major phases such as
current assets and the quick ratio (Kafka, 2017). The current ratio of Suncorp is floating between
0.25 to 0.20 times and in case of the quick ratio the ratio is floating in the range of 0.20 to 0.15.
The current ratio as well as the quick ratio is basically the determinants of how well the company
can realize the cash and pay back the liabilities on time. As can be observed from the figures the
ratio is very poor and there it is nowhere near to the benchmark. Further the immediate measures
are required to be taken in order to have a balance between the assets. There could be few of the
strategies that Suncorp can use in order to keep a balanced current ratio and quick ratio. At first
the obsolete assets shall be taken out so that the productivity of the company increases, secondly
the company shall focus on the long term liabilities instead of short terms so that not much of the
cash is required to be circulated (Schroeder, Clark and Cathey, 2019).
Running Head: FINANCE
Capital structure
The capital structure of Suncor Group is bifurcated in terms of debt and equity. The debt
component of the company is 0.95 whereas the equity component is 0.5 times in terms of the
ratio in the year 2017. Further, in the year 2018 the ratio increased and the long term liabilities
have seen a hike whereas the equity remained almost same in comparison to the previous year.
The situation turned out to be worse in the year 2019. The ratio was 1.04 in the financial year
2019 and hence, in this area also the steps are required to be taken so that the financial burden
does not toggle up the position of the company. Apart from this the times interest coverage ratio
is also one of the metric that is used by Suncorp to find out how much capable the company is in
clearing the finance costs as the. As per the year 2017, the times interest ratio is 2.12 whereas it
reduced to 1.98 in the year 2018 (Vezér and Morrow, 2019). Further, the year 2019 reflected
2.05 and this clearly explains that slowly and gradually the ability of the company is hampering
and it is a big question mark. The last parameter that has been used by the company is debt to
total assets in order to find out how much of the assets are financed with the help of the debt and
the results depicts that the total number of the assets that are financed through debt are minimal.
Hence, from the overall analysis it can be ascertained that the position of Suncorp Growth in
terms of capital assessment is not solid and the immediate strategies are required to be followed
(Corbet,Lucey, Urquhart, and Yarovaya, 2019).
Non-current asset analysis
The analysis of the non-current assets demonstrates the amount of the plant, property and
equipment as it can be observed from the readings of the annual report such as $211 in the
financial year 2018 and $208 in the current year. The non-current asset performance analysis is
carried out to evaluate the fixed assets of the company. The fixed assets generally contribute to
⊘ This is a preview!⊘
Do you want full access?
Subscribe today to unlock all pages.
Trusted by 1+ million students worldwide
Running Head: FINANCE
the sales of the organization by efficient utilization. The non-current assets are also referred to as
long term assets and the same are capitalized and the rather than treated as an expense. Under the
annual report of Suncorp the interest expense on lease is amortized over the period of the lease
and the methods are prescribed under AASB 116, Property, Plant and Equipment. The
depreciation and amortization is based on their utilization. The depreciation is recorded on the
basis of the straight line method. While buying a long term asset the salvage value of the
depreciation is deducted and then the amount of the depreciation is calculated. Further the
depreciation is deducted while calculating the annual operating cash flows and then added back
again as the depreciation is a non-cash expense. It is calculated only for the adjustment of
deduction of cash (Suncorp Group, 2019).
Scenario analysis
Scenario analysis is a tool that is used analyzes or evaluates the upcoming possible events that
could be considered for the feasibility of the possible outcomes. In the process of the financial
modeling this process is majorly used to deal with the cash flow of the business especially when
they are favorable potentially and some of the non-favorable events that could create a downfall
in case of the company. When performing the analysis the managers and the executives typically
focuses on 3 major scenarios such as base scenario, worst case scenario and the best case
scenario (Altman, et al 2017).
Base scenario: Under this scenario the project has been evaluated at the discounting rate of 12%,
whereas and it is based on the assumptions made by the management. The net present value of
the company under the base case is $9945 (Suncorp Group, 2018).
Paraphrase This Document
Need a fresh take? Get an instant paraphrase of this document with our AI Paraphraser
Running Head: FINANCE
Worst case scenario: Under the worst case scenario the net present value of the proposal is
$3418, the value of the annual cash flows have been decreased by double and this indicates that
the worst case scenario is not feasible for the company. The net present value under the worst
case scenario $3418
Best case scenario: Under the best case scenario, the net present value of the net present value
of the proposal is $18836 and this indicates that the best opportunities are available when the
cost of capital is 12%. The best case scenario describes the potential effects of the changes in the
variable costs and the fixed costs (Uechi, et al 2015).
Hence from the overall analysis it can be concluded that the net present sensitivity of the
proposal lies within the range of the worst case scenario to best case scenario (Williams, and
Dobelman, 2017).
Latest share or bond issuance
P/E ratios and Share price movements
Running Head: FINANCE
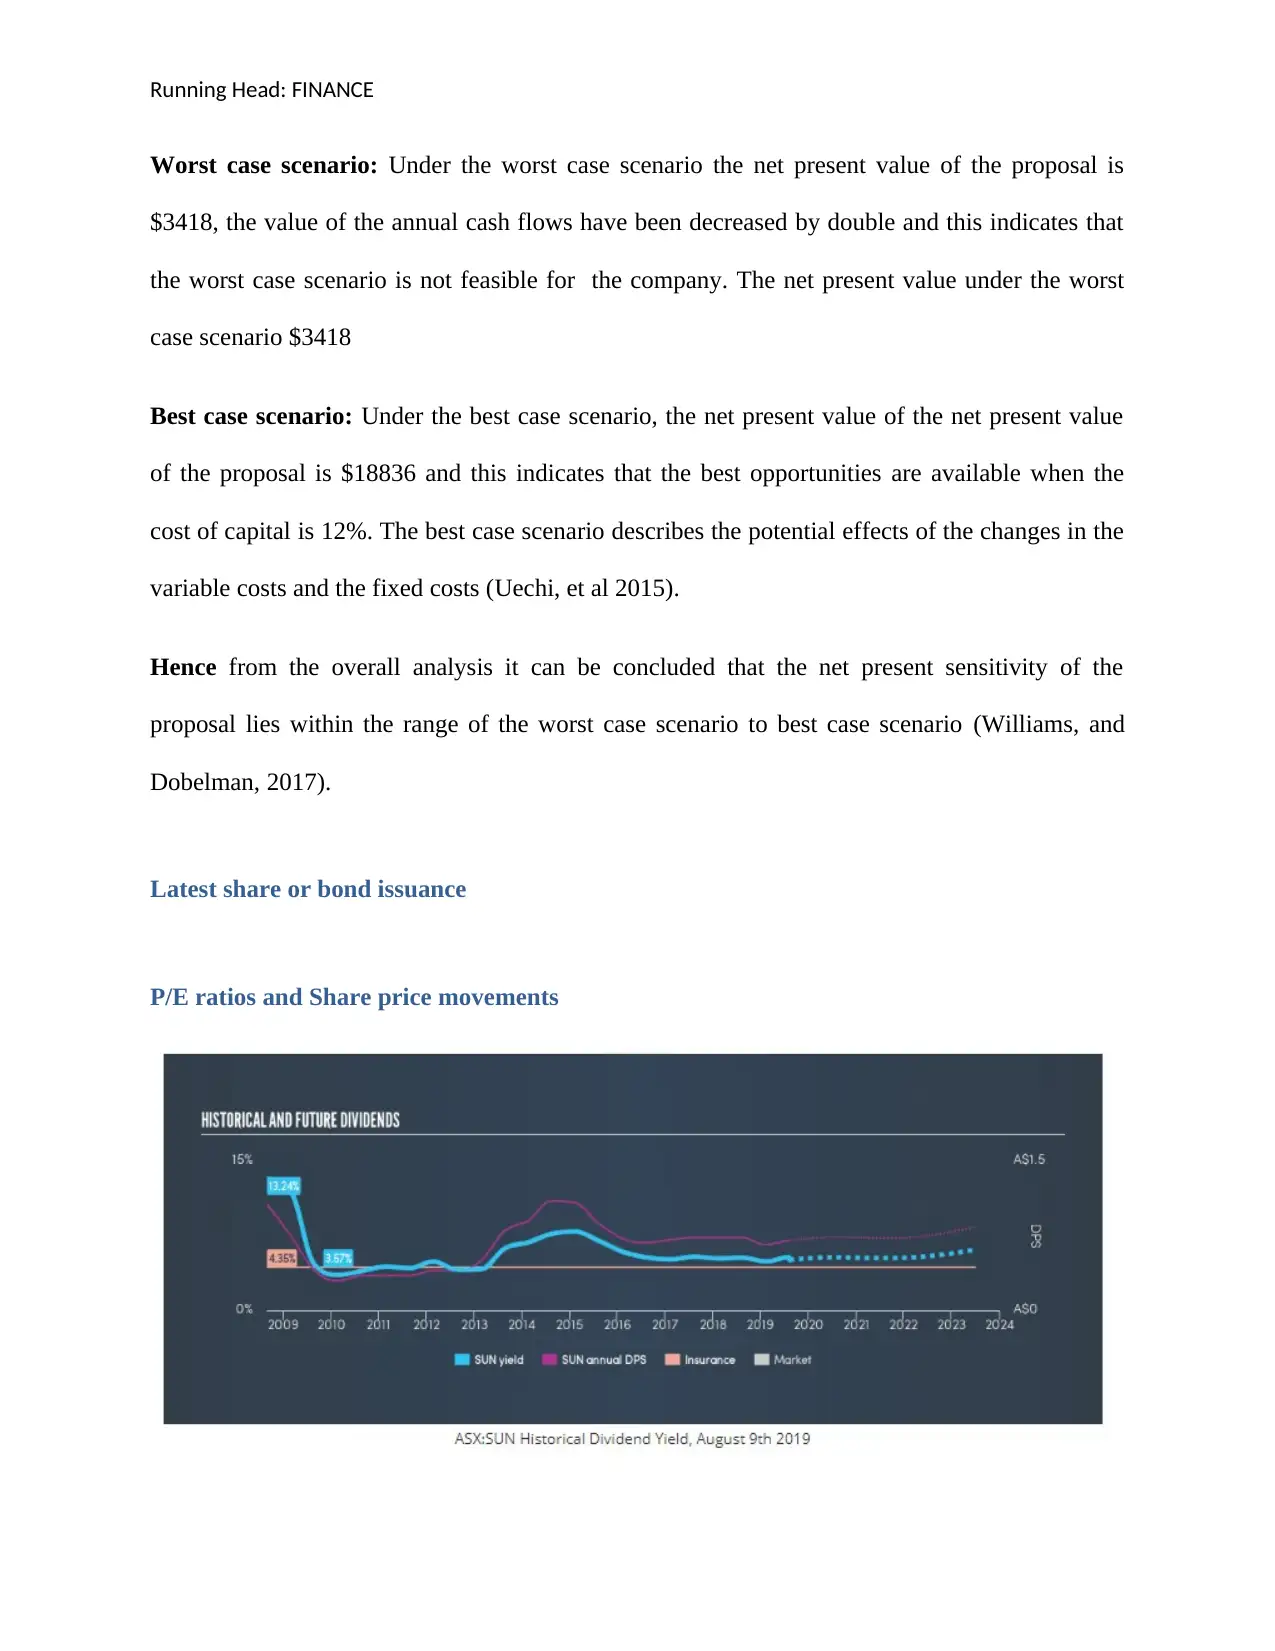
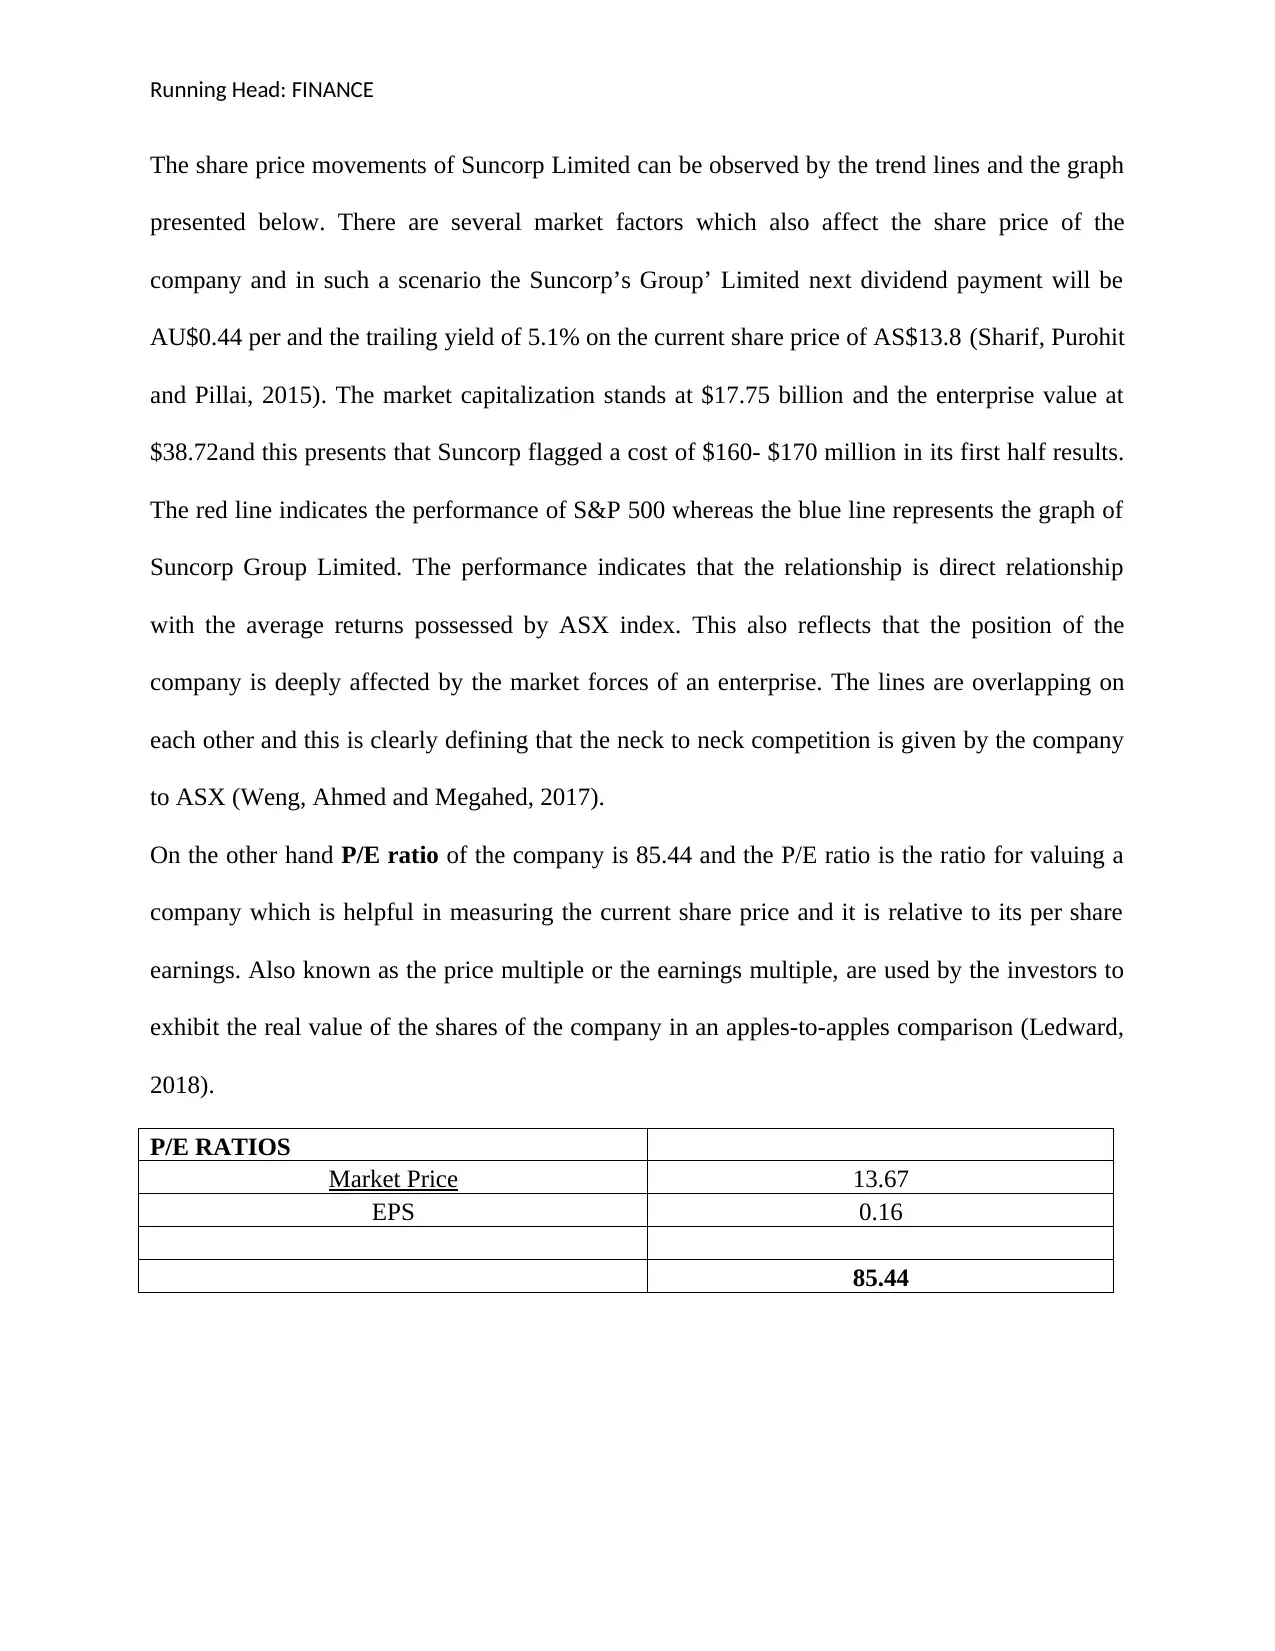
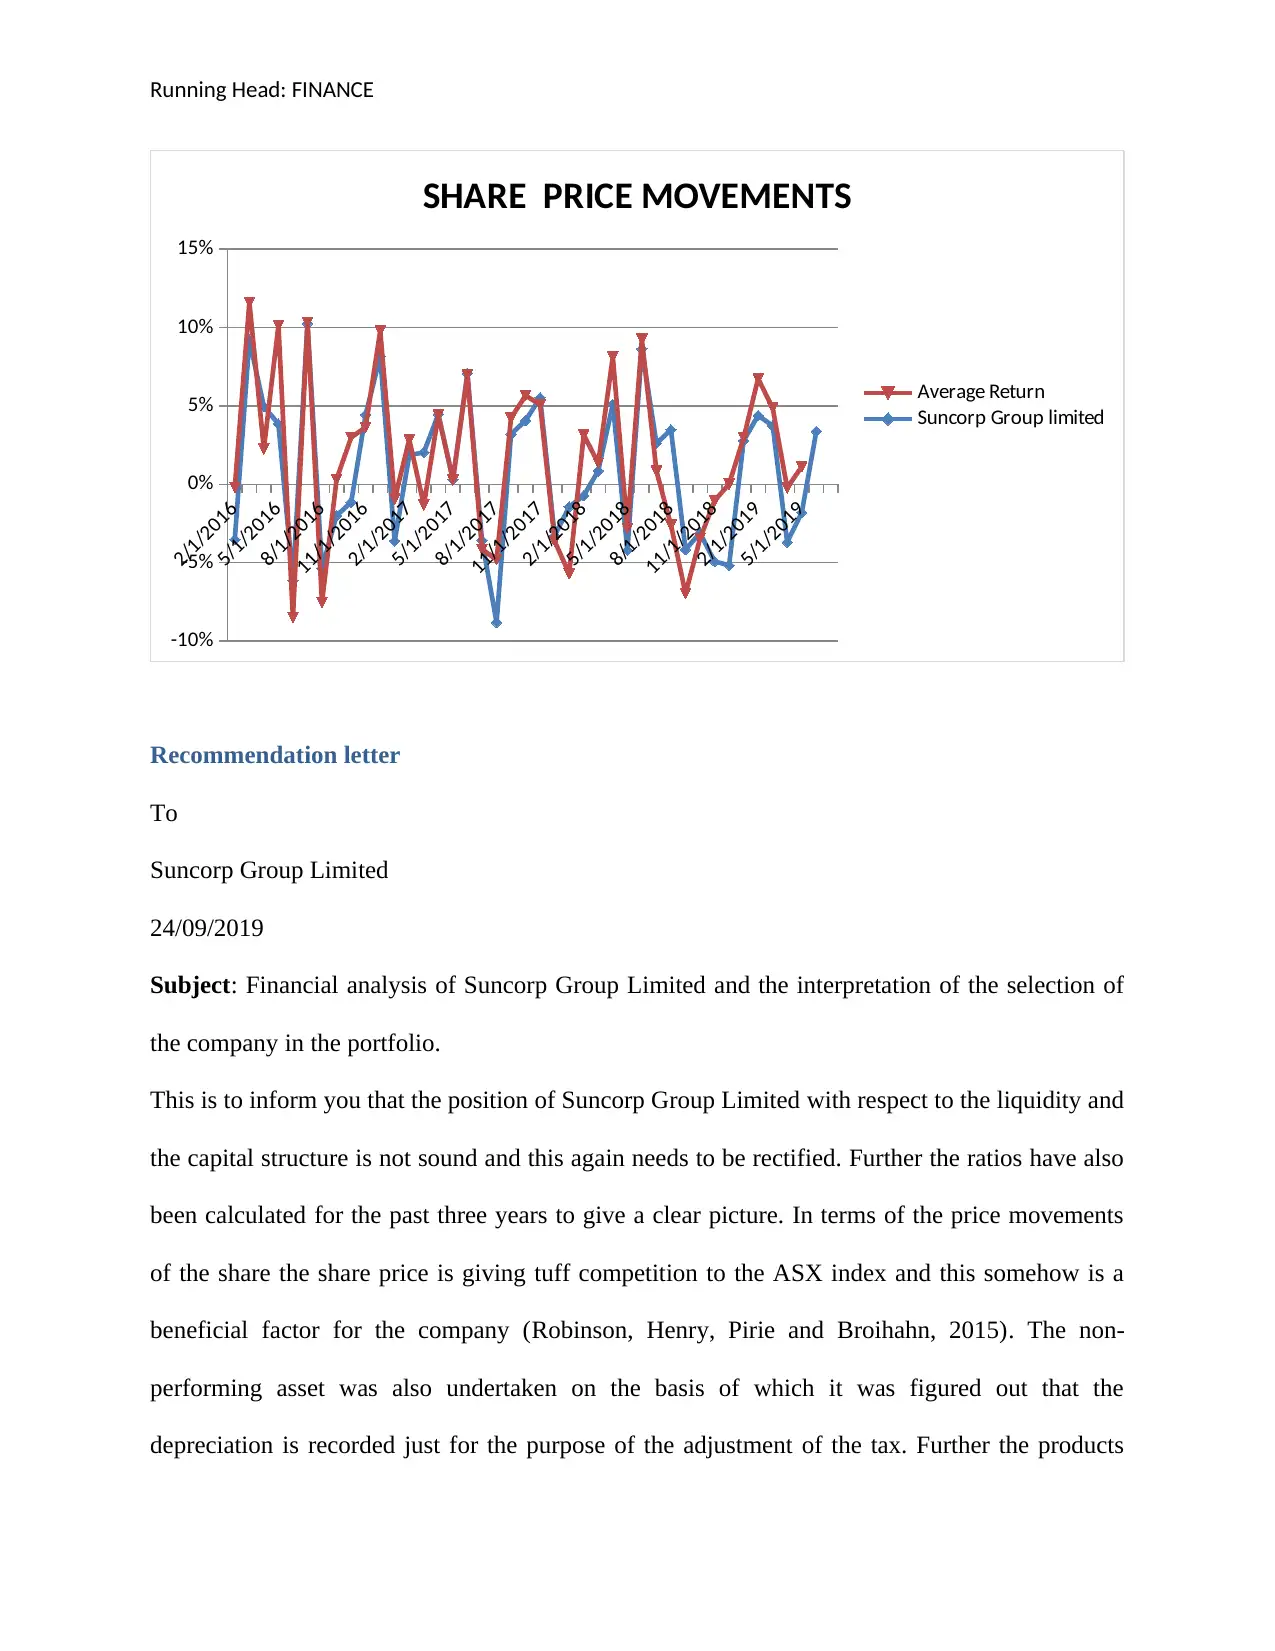
The share price movements of Suncorp Limited can be observed by the trend lines and the graph
presented below. There are several market factors which also affect the share price of the
company and in such a scenario the Suncorp’s Group’ Limited next dividend payment will be
AU$0.44 per and the trailing yield of 5.1% on the current share price of AS$13.8 (Sharif, Purohit
and Pillai, 2015). The market capitalization stands at $17.75 billion and the enterprise value at
$38.72and this presents that Suncorp flagged a cost of $160- $170 million in its first half results.
The red line indicates the performance of S&P 500 whereas the blue line represents the graph of
Suncorp Group Limited. The performance indicates that the relationship is direct relationship
with the average returns possessed by ASX index. This also reflects that the position of the
company is deeply affected by the market forces of an enterprise. The lines are overlapping on
each other and this is clearly defining that the neck to neck competition is given by the company
to ASX (Weng, Ahmed and Megahed, 2017).
On the other hand P/E ratio of the company is 85.44 and the P/E ratio is the ratio for valuing a
company which is helpful in measuring the current share price and it is relative to its per share
earnings. Also known as the price multiple or the earnings multiple, are used by the investors to
exhibit the real value of the shares of the company in an apples-to-apples comparison (Ledward,
2018).
P/E RATIOS
Market Price 13.67
EPS 0.16
85.44
⊘ This is a preview!⊘
Do you want full access?
Subscribe today to unlock all pages.
Trusted by 1+ million students worldwide
Running Head: FINANCE
2/1/2016
5/1/2016
8/1/2016
11/1/2016
2/1/2017
5/1/2017
8/1/2017
11/1/2017
2/1/2018
5/1/2018
8/1/2018
11/1/2018
2/1/2019
5/1/2019
-10%
-5%
0%
5%
10%
15%
SHARE PRICE MOVEMENTS
Average Return
Suncorp Group limited
Recommendation letter
To
Suncorp Group Limited
24/09/2019
Subject: Financial analysis of Suncorp Group Limited and the interpretation of the selection of
the company in the portfolio.
This is to inform you that the position of Suncorp Group Limited with respect to the liquidity and
the capital structure is not sound and this again needs to be rectified. Further the ratios have also
been calculated for the past three years to give a clear picture. In terms of the price movements
of the share the share price is giving tuff competition to the ASX index and this somehow is a
beneficial factor for the company (Robinson, Henry, Pirie and Broihahn, 2015). The non-
performing asset was also undertaken on the basis of which it was figured out that the
depreciation is recorded just for the purpose of the adjustment of the tax. Further the products
Paraphrase This Document
Need a fresh take? Get an instant paraphrase of this document with our AI Paraphraser
Running Head: FINANCE
and the services that are delivered by company are inclusive of wide variety which offers
different products for different customers. Hence, it has been recommended to the investors to
keep an eye in the shares and the money shall not be invested I the company to diversify the
portfolio for the short term basis, as the long term situations might turn and improve.
Yours Sincerely
Chief Accountant
Conclusion
From the overall analysis it can be understood that Suncorp limited is on the verge of great
danger and the company needs to take the measures and the initiative in order to bring back the
company on track and turnout to be a competitive edge for the other companies. Further the
products shall be diversified so that the large customer base can be served without any hassle.
This would surely increase the brand value of the company. This also comes at the cost of the
increasing the brand value for the higher customer satisfaction and higher level of customer base.
The position at present of the company reflects that the company may soon have to sell certain
asset if the situation does not improve.
Running Head: FINANCE
References
Altman, E.I., Iwanicz‐Drozdowska, M., Laitinen, E.K. and Suvas, A., 2017. Financial distress
prediction in an international context: A review and empirical analysis of Altman's Z‐score
model. Journal of International Financial Management & Accounting, 28(2), pp.131-171.
Corbet, S., Lucey, B., Urquhart, A. and Yarovaya, L., 2019. Cryptocurrencies as a financial
asset: A systematic analysis. International Review of Financial Analysis, 62, pp.182-199.
Kafka, S., 2017. Economic and Accounting Methods of Fixed Assets Evaluation. Accounting
and Finance, (1), pp.33-40.
Ledward, R., 2018. Suncorp Group Share Price Slowly Rises to 2.49% [Online] Available from
https://www.moneymorning.com.au/20180307/suncorp-group-share-price-slowly-rises-2-49-
asxu.html [Accessed on 25th September 2019].
Linnenluecke, M.K., Birt, J., Lyon, J. and Sidhu, B.K., 2015. Planetary boundaries: implications
for asset impairment. Accounting & Finance, 55(4), pp.911-929.
Robinson, T.R., Henry, E., Pirie, W.L. and Broihahn, M.A., 2015. International financial
statement analysis. John Wiley & Sons.
Schroeder, R.G., Clark, M.W. and Cathey, J.M., 2019. Financial accounting theory and
analysis: text and cases. John Wiley & Sons.
Sharif, T., Purohit, H. and Pillai, R., 2015. Analysis of factors affecting share prices: The case of
Bahrain stock exchange. International Journal of Economics and Finance, 7(3), pp.207-216.
⊘ This is a preview!⊘
Do you want full access?
Subscribe today to unlock all pages.
Trusted by 1+ million students worldwide
1 out of 13
Related Documents


Your All-in-One AI-Powered Toolkit for Academic Success.
+13062052269
info@desklib.com
Available 24*7 on WhatsApp / Email
![[object Object]](/_next/static/media/star-bottom.7253800d.svg)
Unlock your academic potential
Copyright © 2020–2026 A2Z Services. All Rights Reserved. Developed and managed by ZUCOL.