Project A: Super Mart Sales Prediction and RFM Model Analysis

Verified

Added on  2019/10/30

|5
|1297
|279
Project
AI Summary
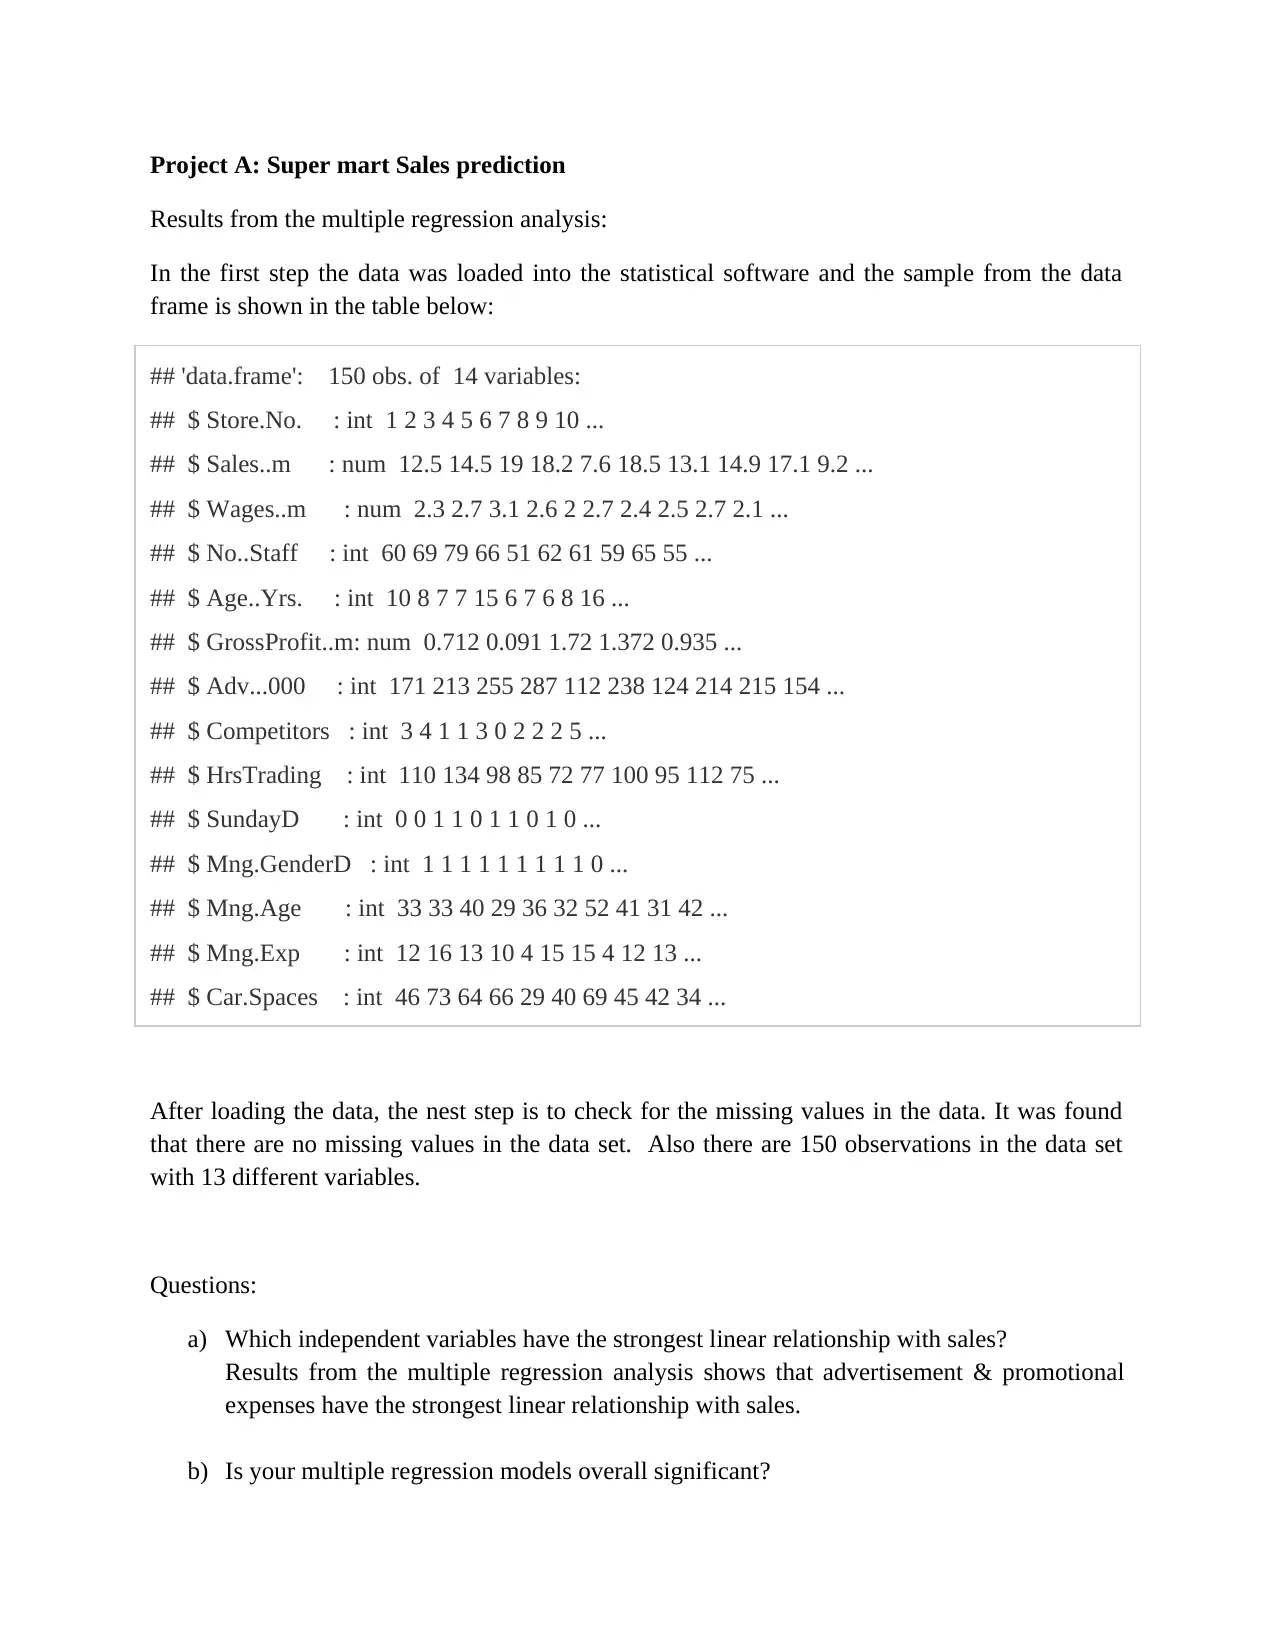
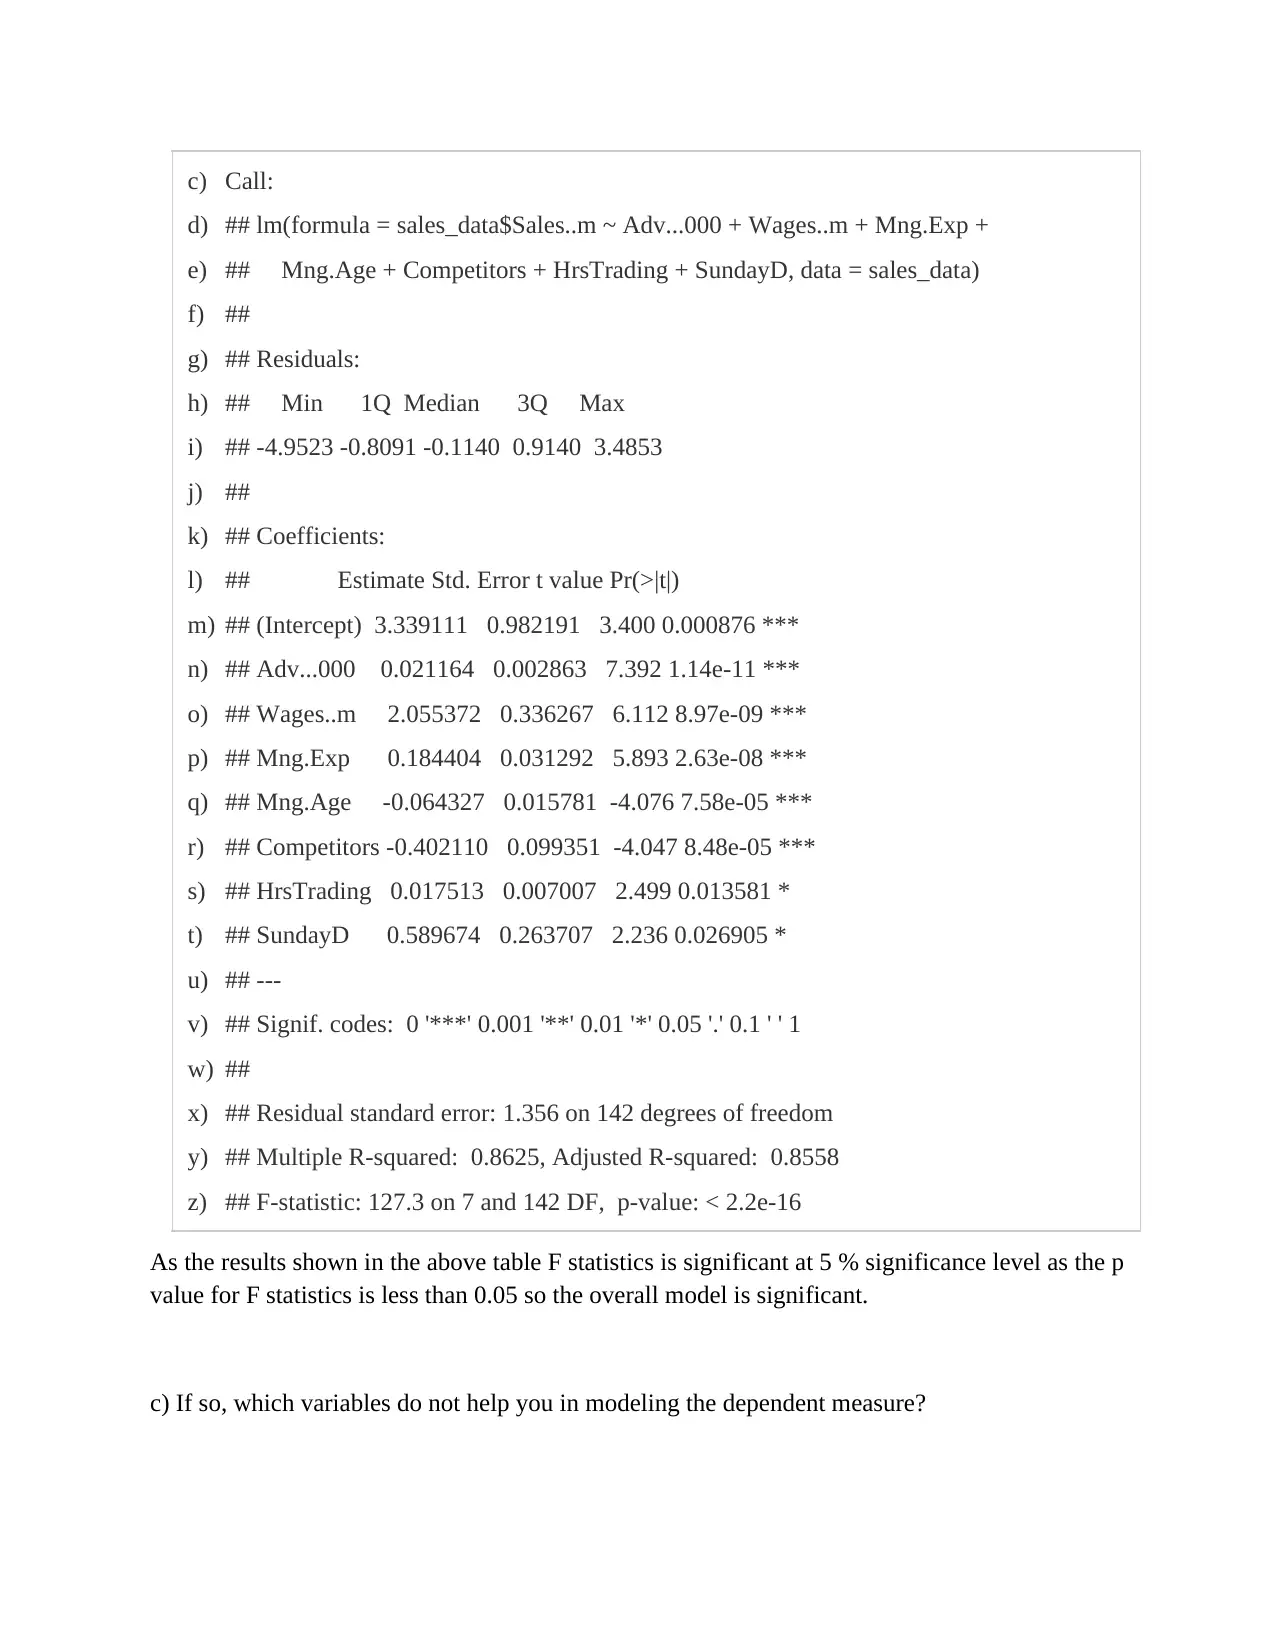
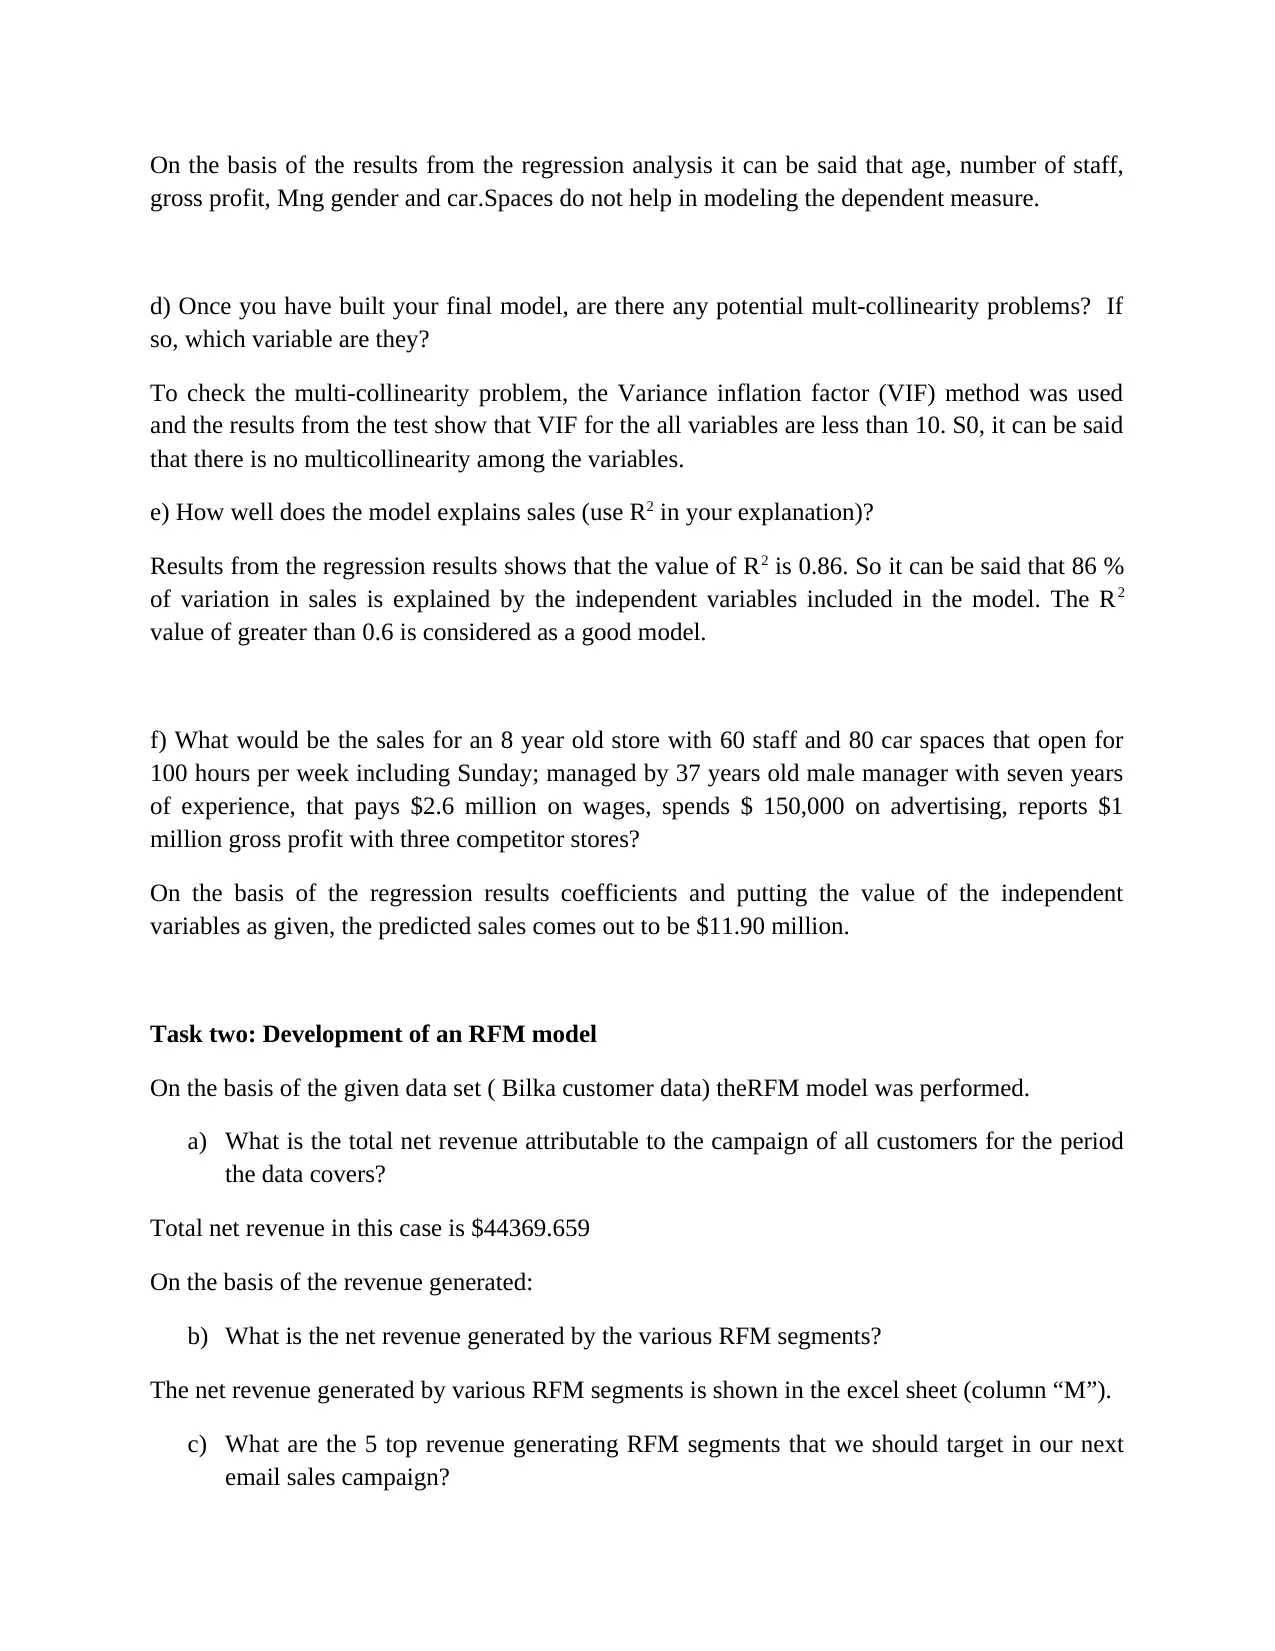
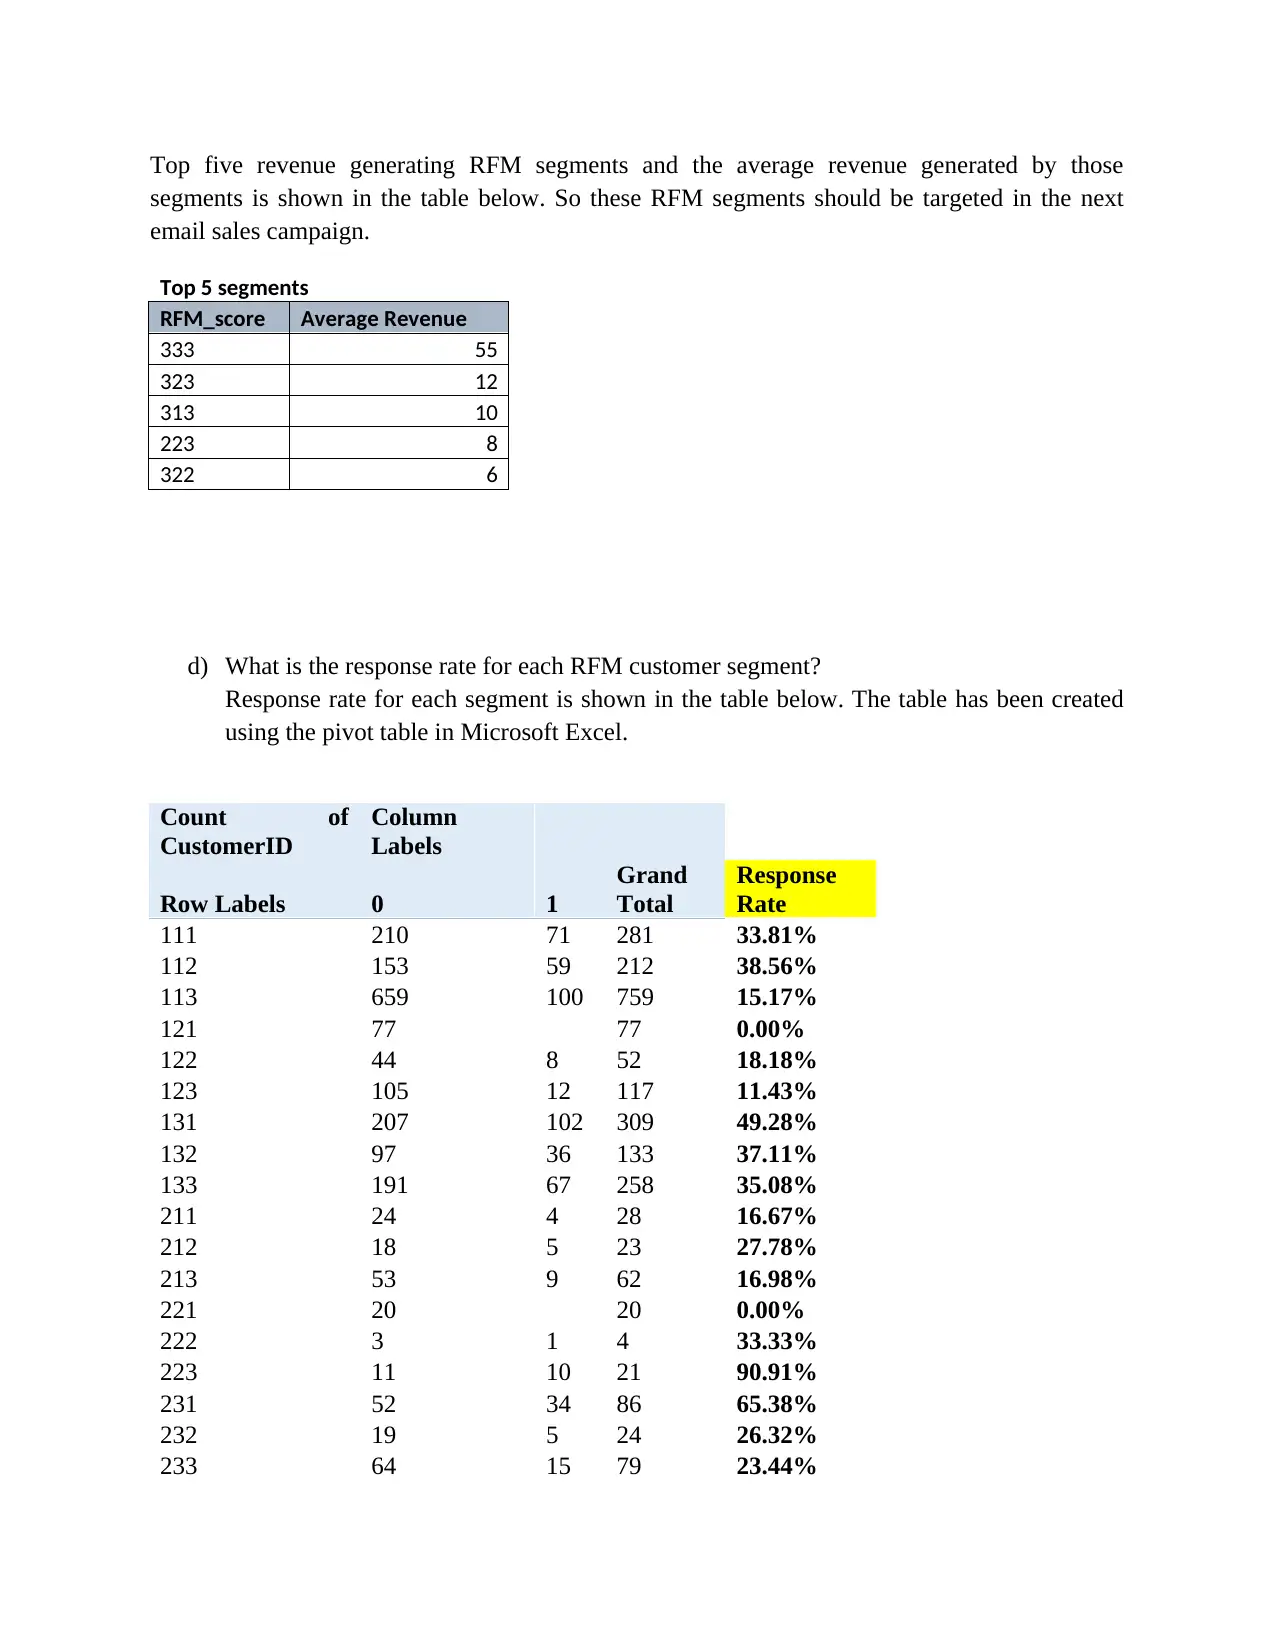
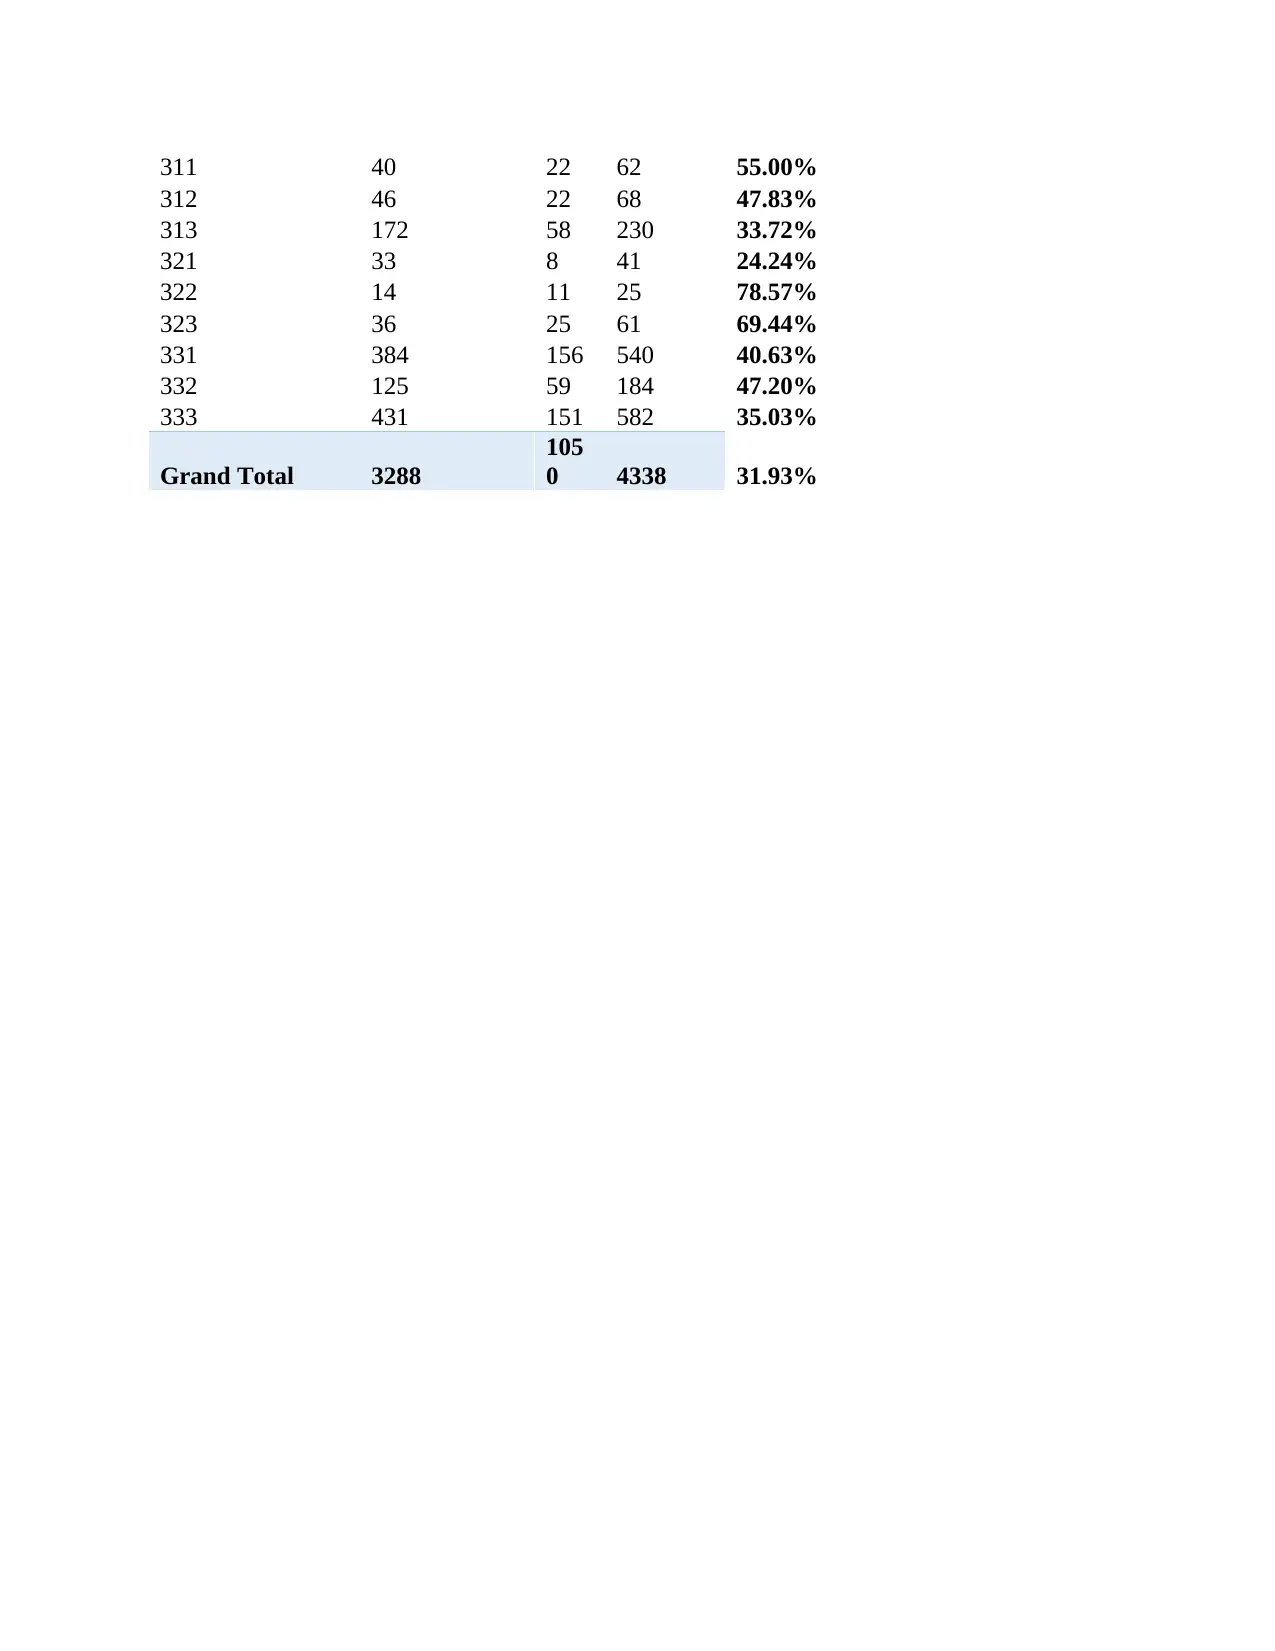
This project provides a comprehensive analysis of Super Mart sales data, employing multiple regression analysis to predict sales based on various independent variables such as advertising spend, wages, and store characteristics. The project begins with data loading, missing value checks, and an overview of the dataset. Key findings include the identification of the strongest predictors of sales, the significance of the overall regression model, and the variables that do not significantly contribute to the model. The analysis also addresses multicollinearity concerns and evaluates the model's explanatory power using the R-squared value. Additionally, the project includes a sales prediction based on a hypothetical store scenario. Furthermore, the project develops an RFM (Recency, Frequency, Monetary) model, calculating total net revenue, identifying revenue-generating customer segments, and determining response rates for each segment to optimize marketing campaigns. The project concludes with the identification of the top-performing RFM segments for targeted email campaigns.
Document Page
Project A: Super mart Sales prediction
Results from the multiple regression analysis:
In the first step the data was loaded into the statistical software and the sample from the data
frame is shown in the table below:
## 'data.frame': 150 obs. of 14 variables:
## $ Store.No. : int 1 2 3 4 5 6 7 8 9 10 ...
## $ Sales..m : num 12.5 14.5 19 18.2 7.6 18.5 13.1 14.9 17.1 9.2 ...
## $ Wages..m : num 2.3 2.7 3.1 2.6 2 2.7 2.4 2.5 2.7 2.1 ...
## $ No..Staff : int 60 69 79 66 51 62 61 59 65 55 ...
## $ Age..Yrs. : int 10 8 7 7 15 6 7 6 8 16 ...
## $ GrossProfit..m: num 0.712 0.091 1.72 1.372 0.935 ...
## $ Adv...000 : int 171 213 255 287 112 238 124 214 215 154 ...
## $ Competitors : int 3 4 1 1 3 0 2 2 2 5 ...
## $ HrsTrading : int 110 134 98 85 72 77 100 95 112 75 ...
## $ SundayD : int 0 0 1 1 0 1 1 0 1 0 ...
## $ Mng.GenderD : int 1 1 1 1 1 1 1 1 1 0 ...
## $ Mng.Age : int 33 33 40 29 36 32 52 41 31 42 ...
## $ Mng.Exp : int 12 16 13 10 4 15 15 4 12 13 ...
## $ Car.Spaces : int 46 73 64 66 29 40 69 45 42 34 ...
After loading the data, the nest step is to check for the missing values in the data. It was found
that there are no missing values in the data set. Also there are 150 observations in the data set
with 13 different variables.
Questions:
a) Which independent variables have the strongest linear relationship with sales?
Results from the multiple regression analysis shows that advertisement & promotional
expenses have the strongest linear relationship with sales.
b) Is your multiple regression models overall significant?
tabler-icon-diamond-filled.svg

Secure Best Marks with AI Grader

Need help grading? Try our AI Grader for instant feedback on your assignments.
Document Page
c) Call:
d) ## lm(formula = sales_data$Sales..m ~ Adv...000 + Wages..m + Mng.Exp +
e) ## Mng.Age + Competitors + HrsTrading + SundayD, data = sales_data)
f) ##
g) ## Residuals:
h) ## Min 1Q Median 3Q Max
i) ## -4.9523 -0.8091 -0.1140 0.9140 3.4853
j) ##
k) ## Coefficients:
l) ## Estimate Std. Error t value Pr(>|t|)
m) ## (Intercept) 3.339111 0.982191 3.400 0.000876 ***
n) ## Adv...000 0.021164 0.002863 7.392 1.14e-11 ***
o) ## Wages..m 2.055372 0.336267 6.112 8.97e-09 ***
p) ## Mng.Exp 0.184404 0.031292 5.893 2.63e-08 ***
q) ## Mng.Age -0.064327 0.015781 -4.076 7.58e-05 ***
r) ## Competitors -0.402110 0.099351 -4.047 8.48e-05 ***
s) ## HrsTrading 0.017513 0.007007 2.499 0.013581 *
t) ## SundayD 0.589674 0.263707 2.236 0.026905 *
u) ## ---
v) ## Signif. codes: 0 '***' 0.001 '**' 0.01 '*' 0.05 '.' 0.1 ' ' 1
w) ##
x) ## Residual standard error: 1.356 on 142 degrees of freedom
y) ## Multiple R-squared: 0.8625, Adjusted R-squared: 0.8558
z) ## F-statistic: 127.3 on 7 and 142 DF, p-value: < 2.2e-16
As the results shown in the above table F statistics is significant at 5 % significance level as the p
value for F statistics is less than 0.05 so the overall model is significant.
c) If so, which variables do not help you in modeling the dependent measure?
Document Page
On the basis of the results from the regression analysis it can be said that age, number of staff,
gross profit, Mng gender and car.Spaces do not help in modeling the dependent measure.
d) Once you have built your final model, are there any potential mult-collinearity problems? If
so, which variable are they?
To check the multi-collinearity problem, the Variance inflation factor (VIF) method was used
and the results from the test show that VIF for the all variables are less than 10. S0, it can be said
that there is no multicollinearity among the variables.
e) How well does the model explains sales (use R2 in your explanation)?
Results from the regression results shows that the value of R2 is 0.86. So it can be said that 86 %
of variation in sales is explained by the independent variables included in the model. The R2
value of greater than 0.6 is considered as a good model.
f) What would be the sales for an 8 year old store with 60 staff and 80 car spaces that open for
100 hours per week including Sunday; managed by 37 years old male manager with seven years
of experience, that pays $2.6 million on wages, spends $ 150,000 on advertising, reports $1
million gross profit with three competitor stores?
On the basis of the regression results coefficients and putting the value of the independent
variables as given, the predicted sales comes out to be $11.90 million.
Task two: Development of an RFM model
On the basis of the given data set ( Bilka customer data) theRFM model was performed.
a) What is the total net revenue attributable to the campaign of all customers for the period
the data covers?
Total net revenue in this case is $44369.659
On the basis of the revenue generated:
b) What is the net revenue generated by the various RFM segments?
The net revenue generated by various RFM segments is shown in the excel sheet (column “M”).
c) What are the 5 top revenue generating RFM segments that we should target in our next
email sales campaign?
Document Page
Top five revenue generating RFM segments and the average revenue generated by those
segments is shown in the table below. So these RFM segments should be targeted in the next
email sales campaign.
Top 5 segments
RFM_score Average Revenue
333 55
323 12
313 10
223 8
322 6
d) What is the response rate for each RFM customer segment?
Response rate for each segment is shown in the table below. The table has been created
using the pivot table in Microsoft Excel.
Count of
CustomerID
Column
Labels
Row Labels 0 1
Grand
Total
Response
Rate
111 210 71 281 33.81%
112 153 59 212 38.56%
113 659 100 759 15.17%
121 77 77 0.00%
122 44 8 52 18.18%
123 105 12 117 11.43%
131 207 102 309 49.28%
132 97 36 133 37.11%
133 191 67 258 35.08%
211 24 4 28 16.67%
212 18 5 23 27.78%
213 53 9 62 16.98%
221 20 20 0.00%
222 3 1 4 33.33%
223 11 10 21 90.91%
231 52 34 86 65.38%
232 19 5 24 26.32%
233 64 15 79 23.44%
tabler-icon-diamond-filled.svg

Secure Best Marks with AI Grader

Need help grading? Try our AI Grader for instant feedback on your assignments.
Document Page
311 40 22 62 55.00%
312 46 22 68 47.83%
313 172 58 230 33.72%
321 33 8 41 24.24%
322 14 11 25 78.57%
323 36 25 61 69.44%
331 384 156 540 40.63%
332 125 59 184 47.20%
333 431 151 582 35.03%
Grand Total 3288
105
0 4338 31.93%
chevron_up_icon
1 out of 5
circle_padding
hide_on_mobile
zoom_out_icon
logo.png

Your All-in-One AI-Powered Toolkit for Academic Success.

Available 24*7 on WhatsApp / Email

[object Object]