Analyzing Supermarket Data: Sales, Profit, and Data Mining

Verified

Added on  2023/01/03

|19
|3148
|51
Report
AI Summary
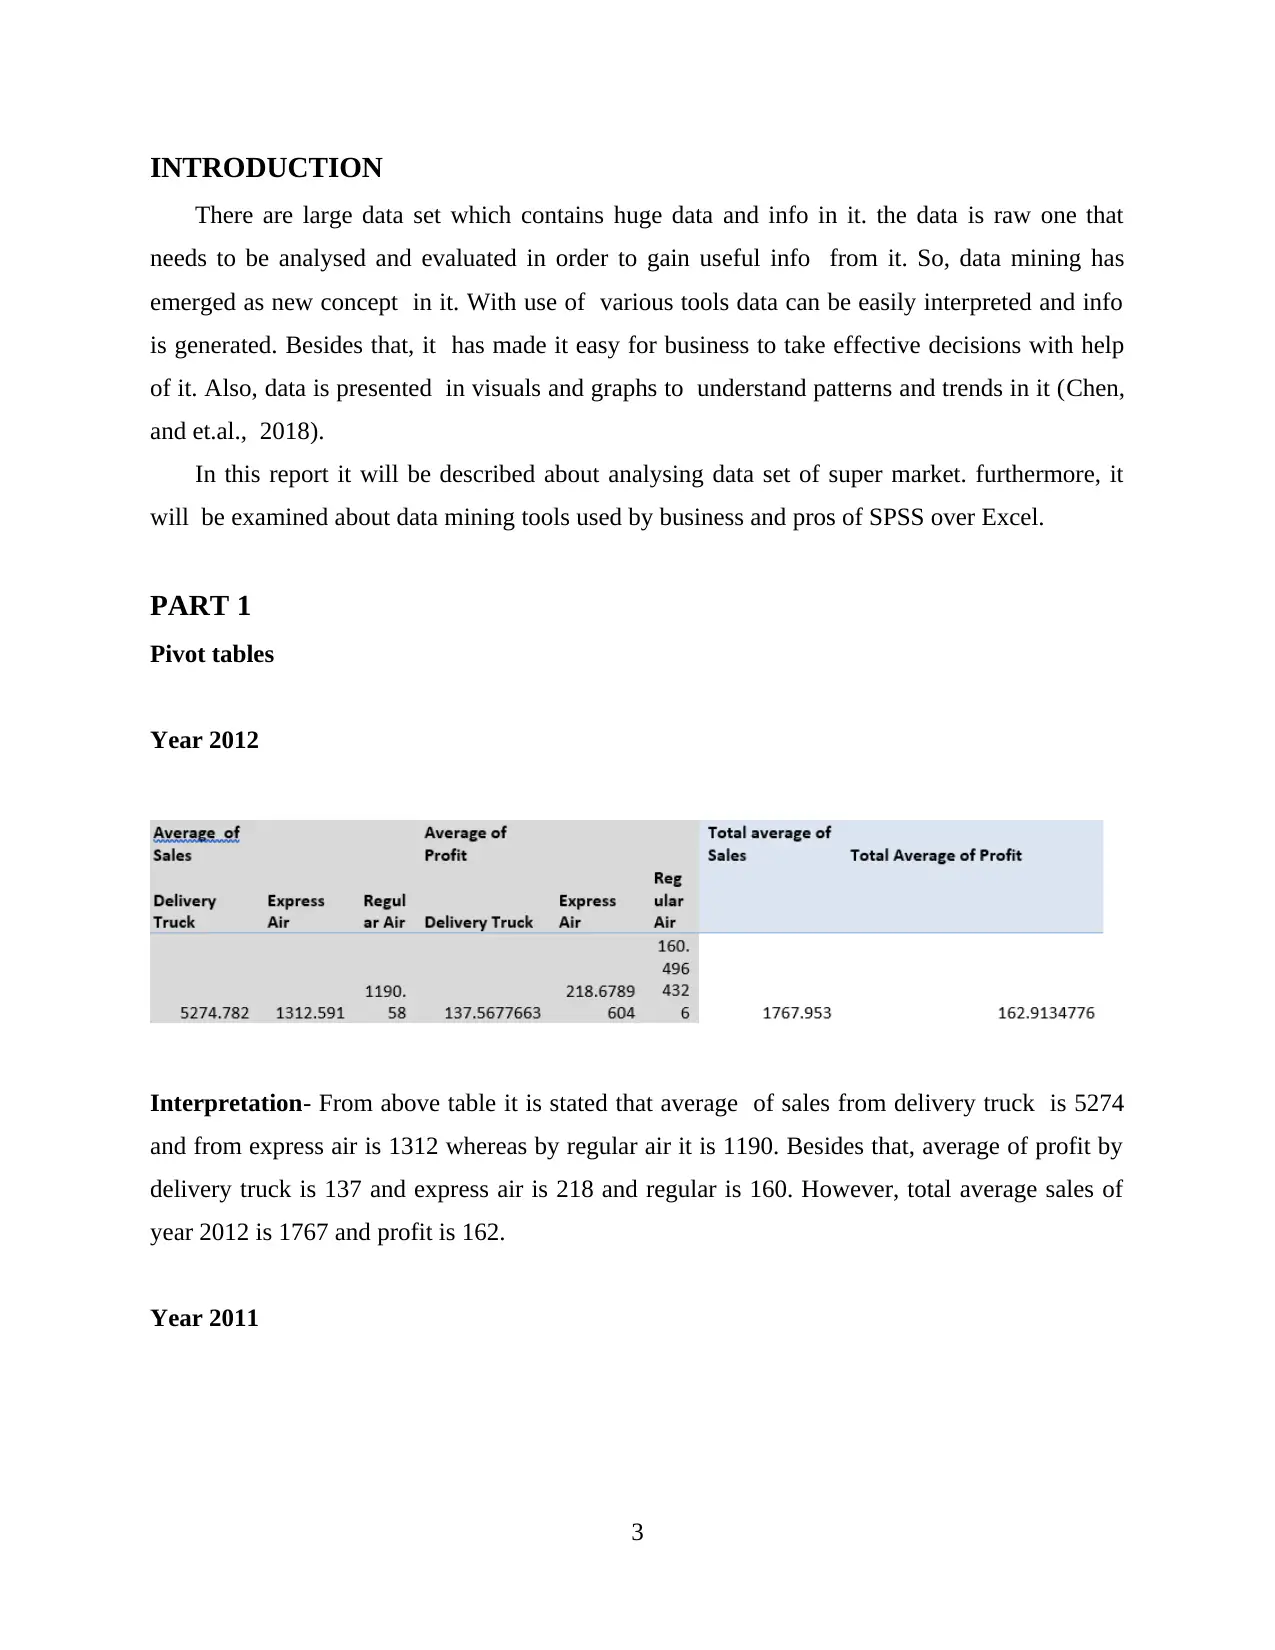
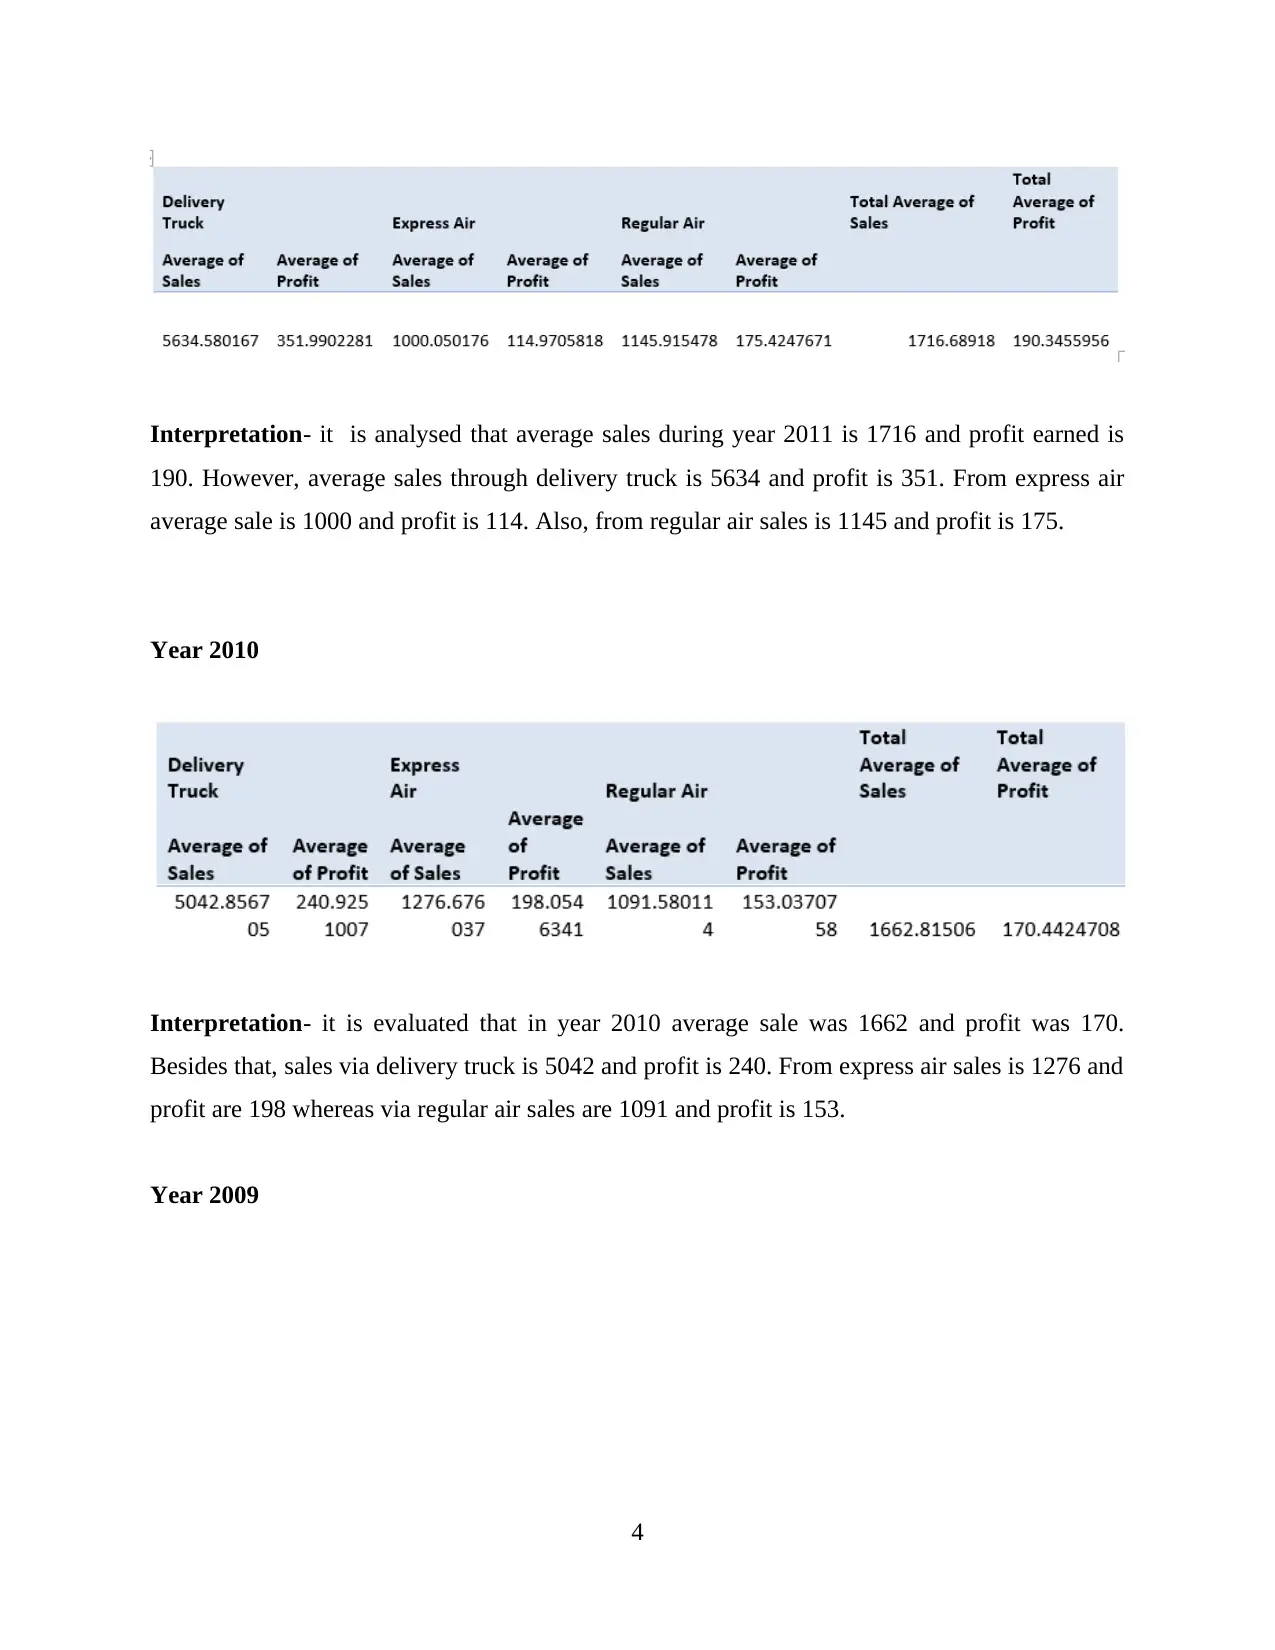
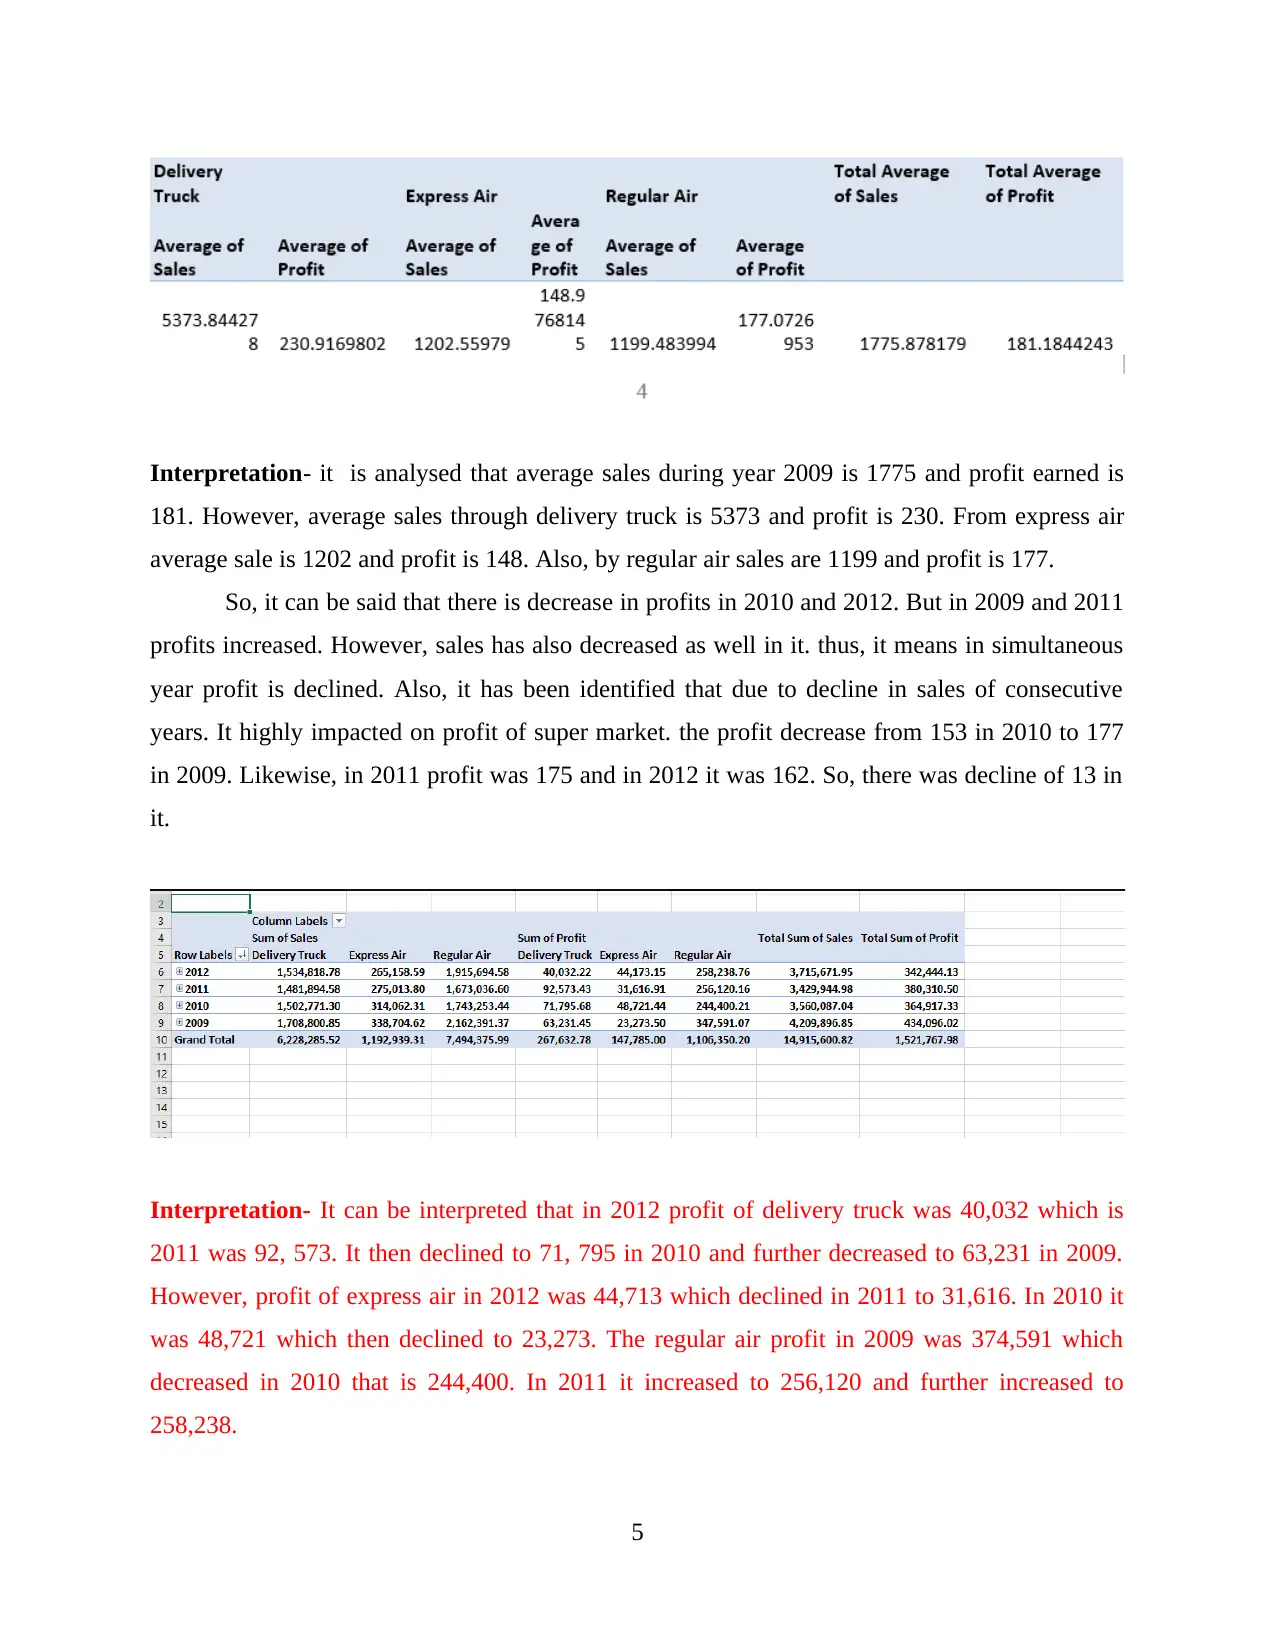
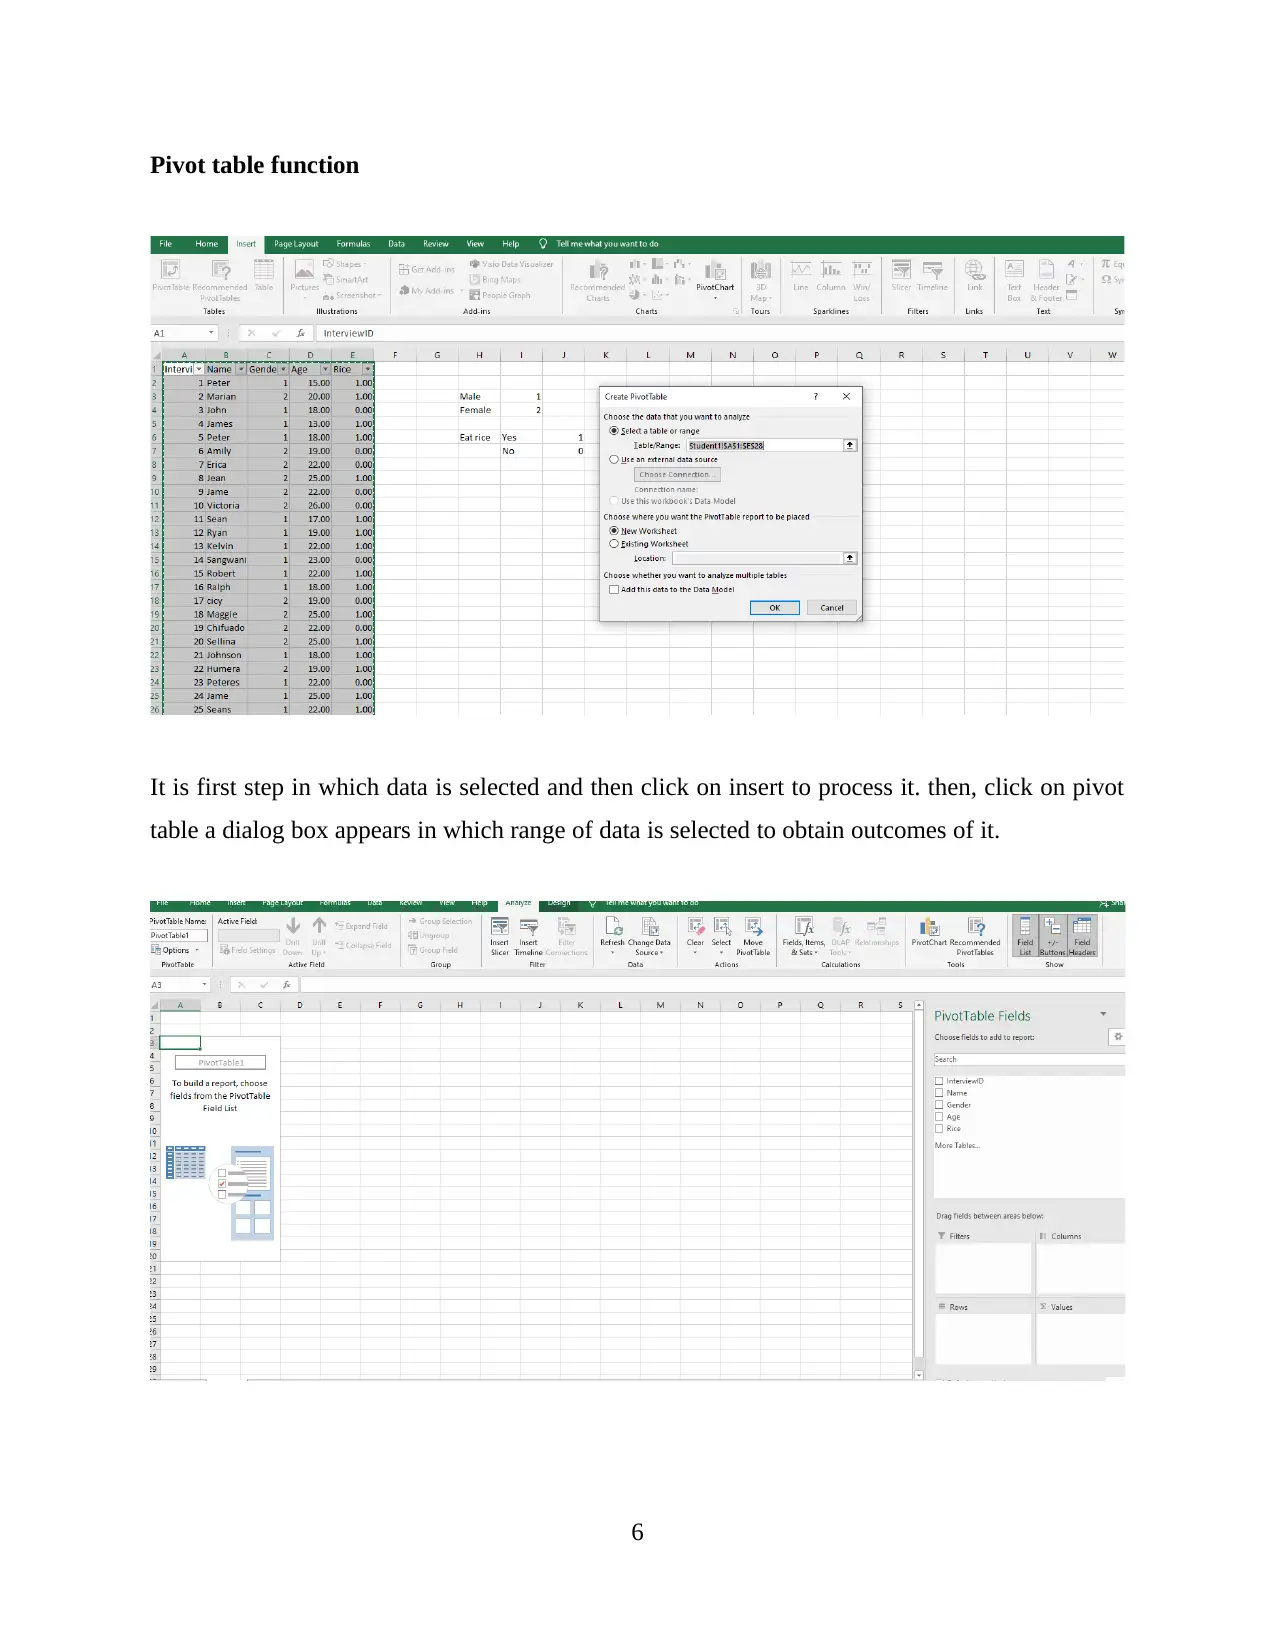
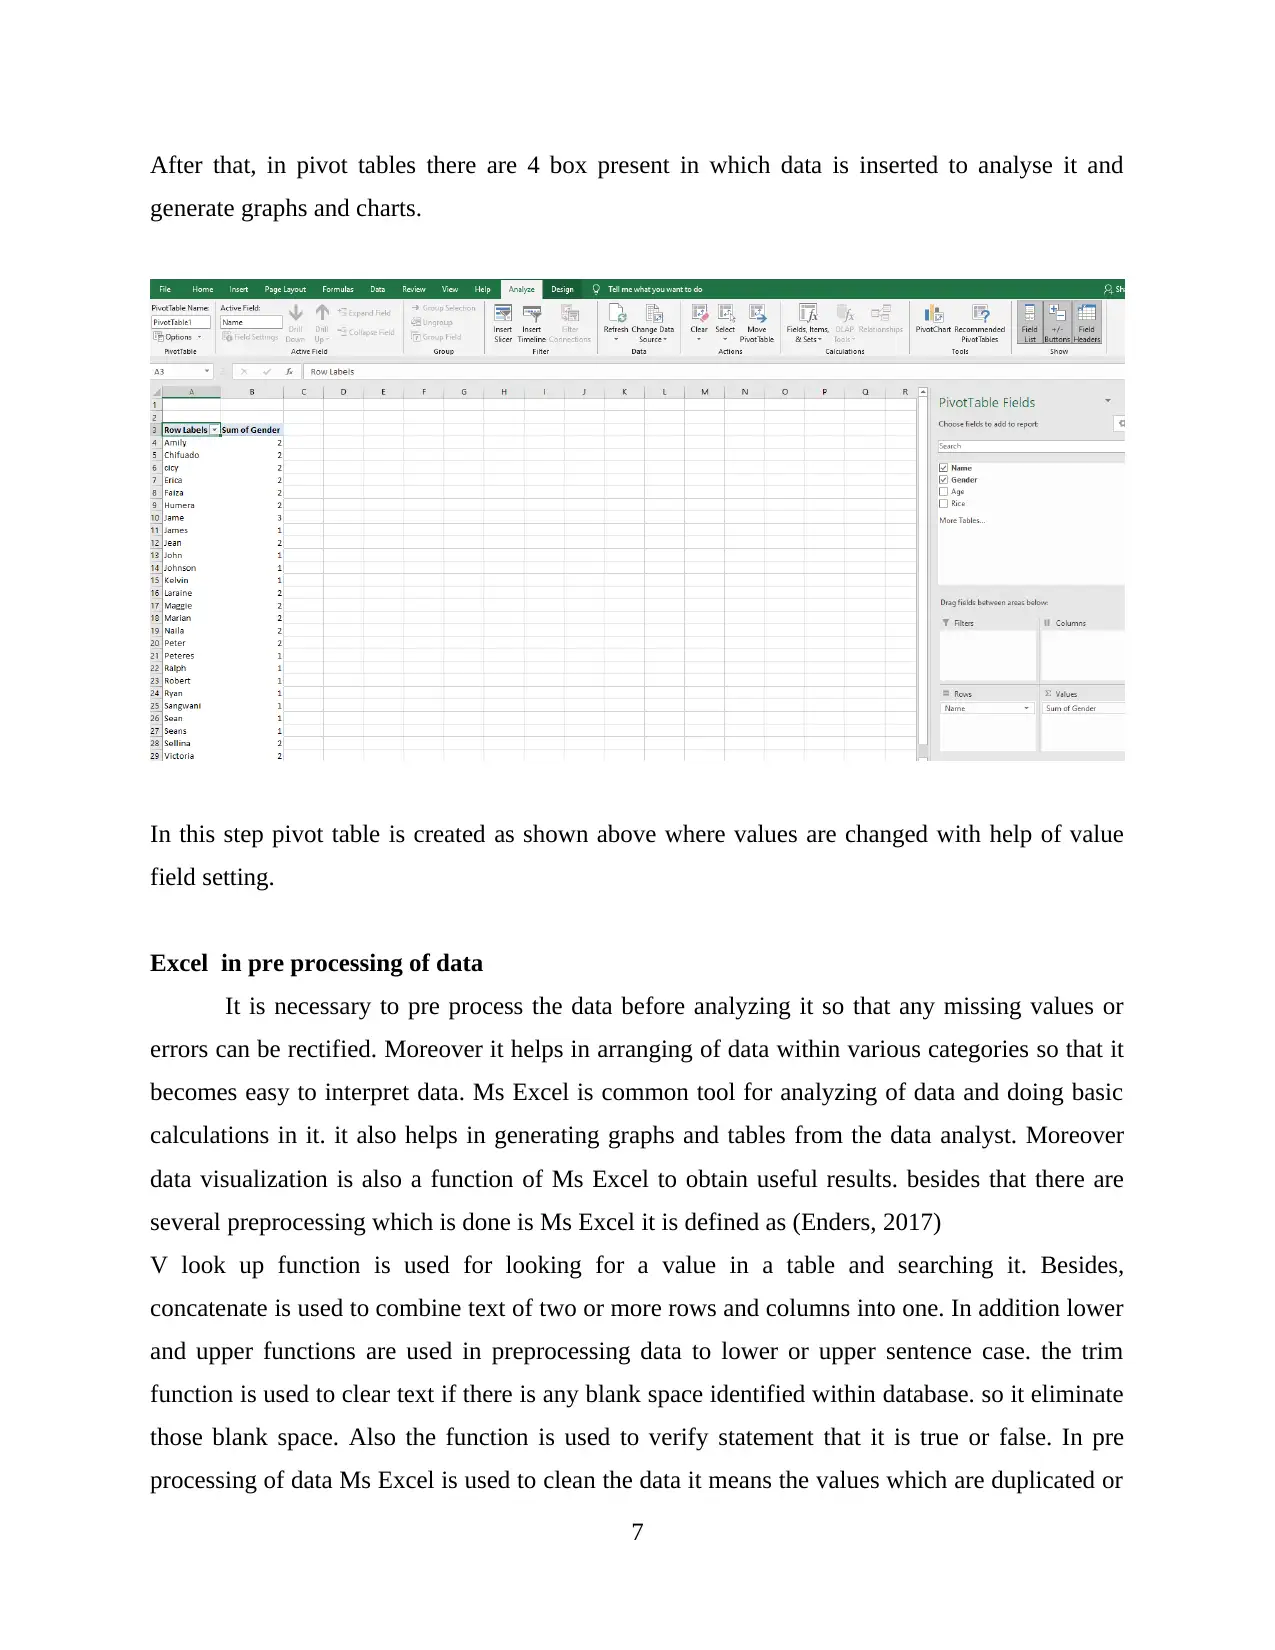
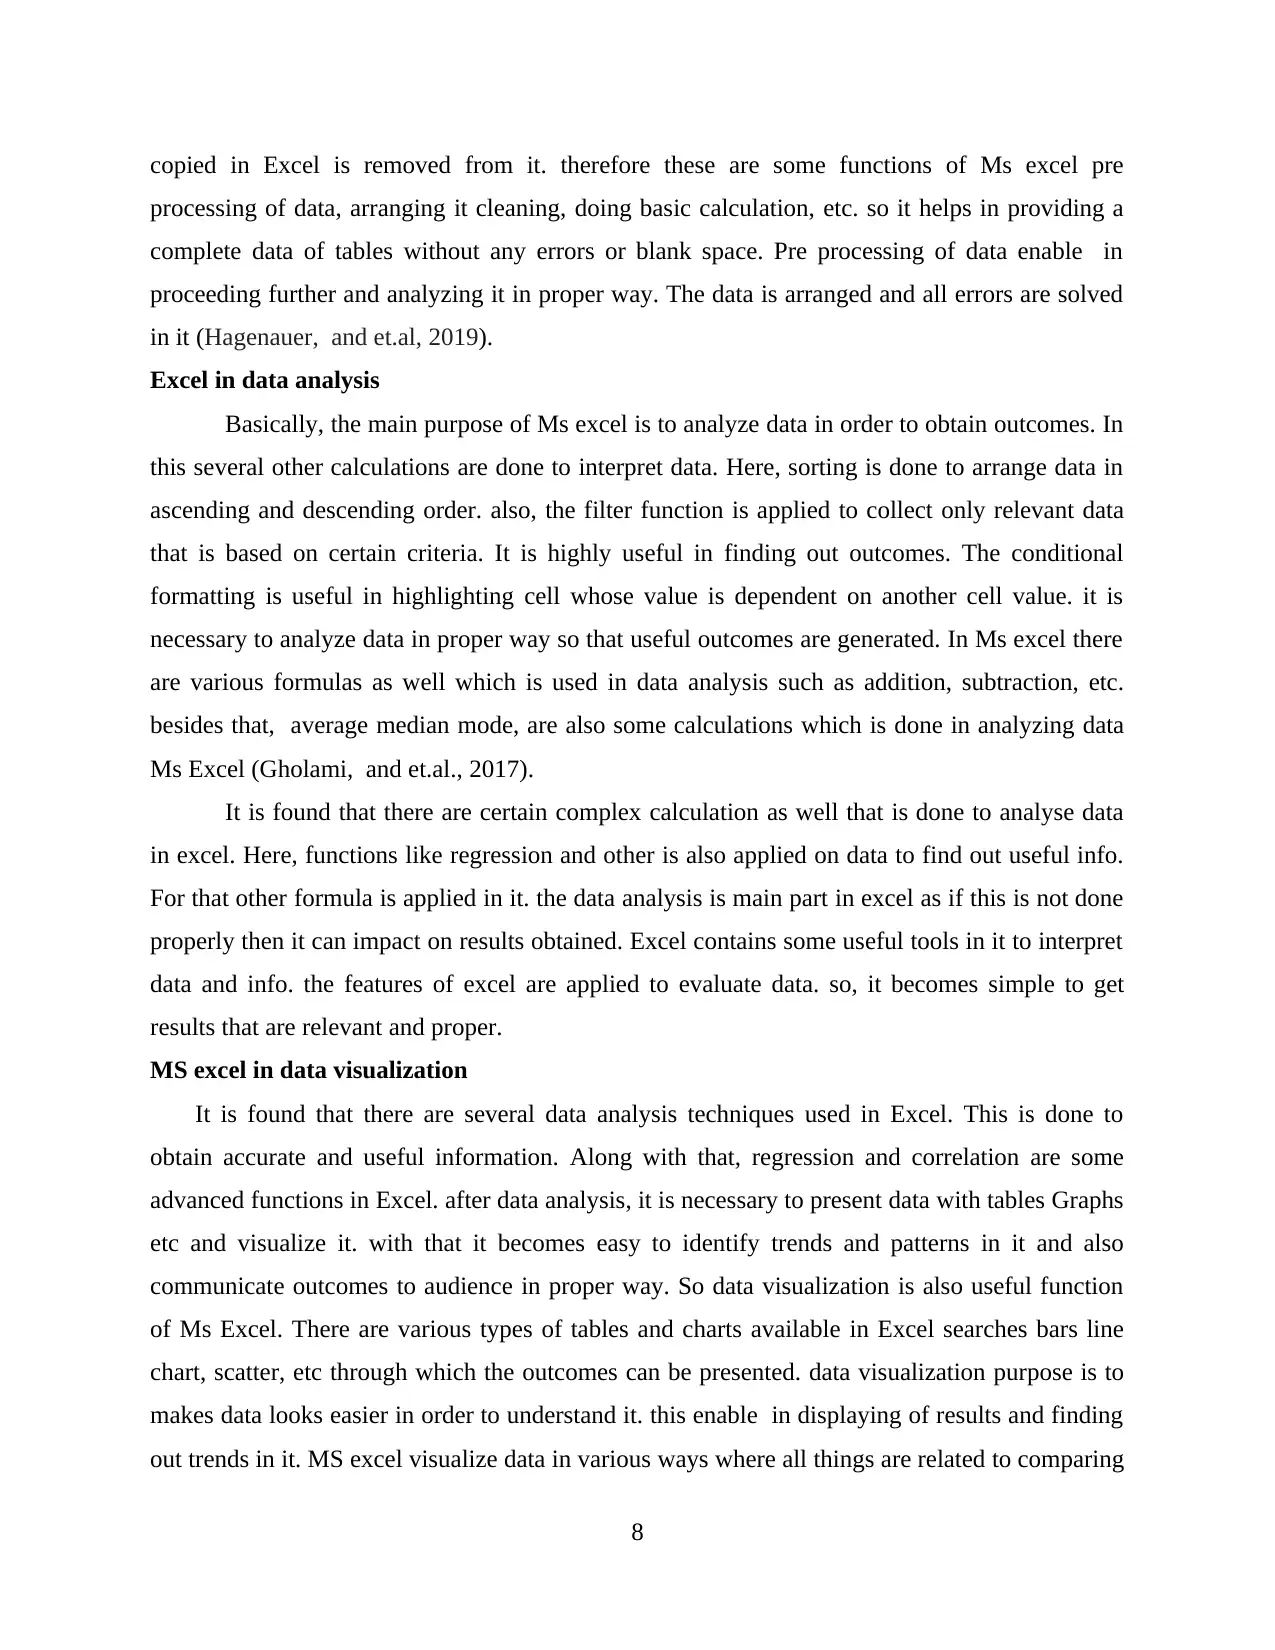
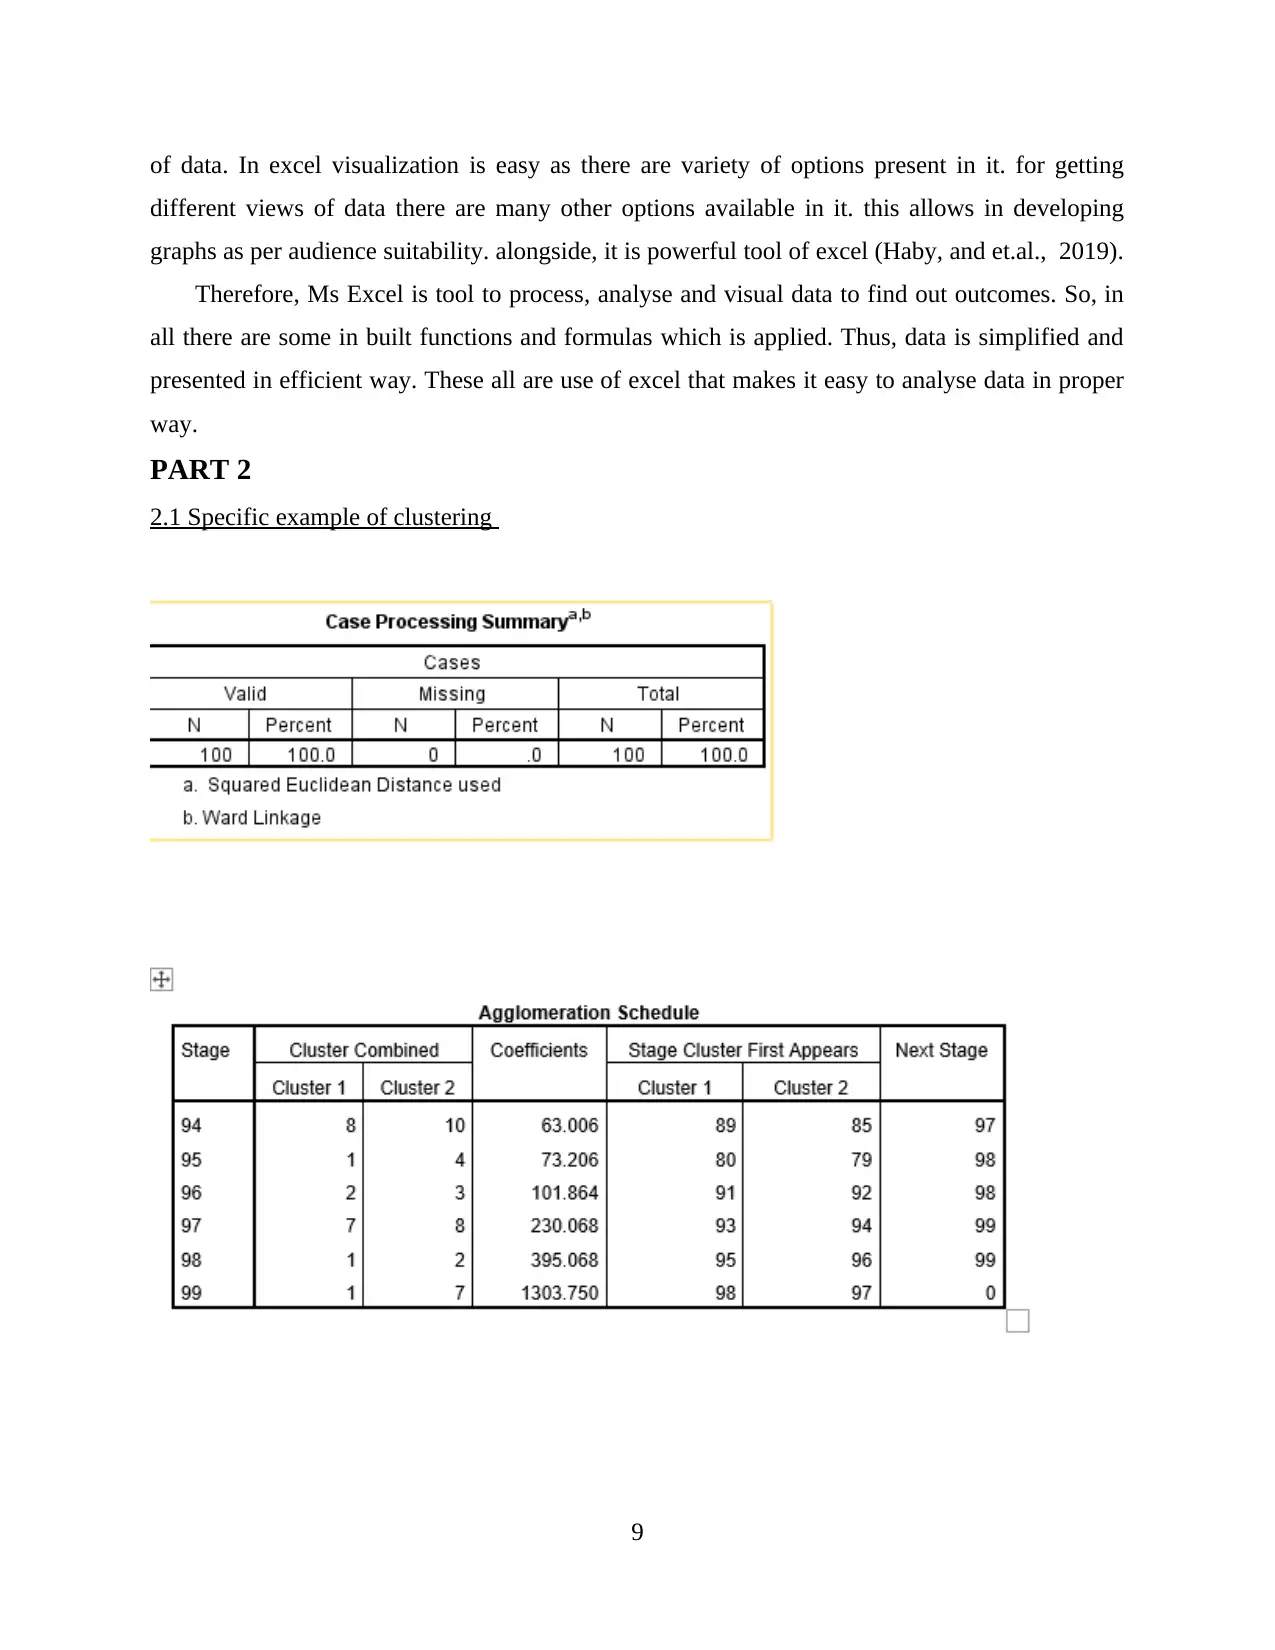
This report analyzes a supermarket's sales and profit data from 2009 to 2012 using pivot tables and Excel functions. It explores trends in sales and profits across different delivery methods (delivery truck, express air, and regular air), highlighting fluctuations and declines. The report details the use of pivot tables, VLOOKUP, CONCATENATE, and other Excel functions for data preprocessing, analysis, and visualization. Furthermore, it discusses data mining methods, including classification, association rule learning, clustering, regression, and anomaly detection, and provides a specific example of clustering with customer demographics. Finally, it compares the pros and cons of using SPSS over MS Excel for data analysis.
Document Page
Data handling and business intelligence
1
tabler-icon-diamond-filled.svg

Paraphrase This Document

Need a fresh take? Get an instant paraphrase of this document with our AI Paraphraser
Document Page
Table of Contents
INTRODUCTION...........................................................................................................................3
PART 1............................................................................................................................................3
PART 2............................................................................................................................................6
2.1 Specific example of clustering...............................................................................................6
2.2 Data mining methods that are used in business...................................................................10
2.3 Pros and cons of using SPSS over Ms- Excel.....................................................................11
CONCLUSION..............................................................................................................................13
REFERENCES..............................................................................................................................15
2
Document Page
INTRODUCTION
There are large data set which contains huge data and info in it. the data is raw one that
needs to be analysed and evaluated in order to gain useful info from it. So, data mining has
emerged as new concept in it. With use of various tools data can be easily interpreted and info
is generated. Besides that, it has made it easy for business to take effective decisions with help
of it. Also, data is presented in visuals and graphs to understand patterns and trends in it (Chen,
and et.al., 2018).
In this report it will be described about analysing data set of super market. furthermore, it
will be examined about data mining tools used by business and pros of SPSS over Excel.
PART 1
Pivot tables
Year 2012
Interpretation- From above table it is stated that average of sales from delivery truck is 5274
and from express air is 1312 whereas by regular air it is 1190. Besides that, average of profit by
delivery truck is 137 and express air is 218 and regular is 160. However, total average sales of
year 2012 is 1767 and profit is 162.
Year 2011
3
Document Page
Interpretation- it is analysed that average sales during year 2011 is 1716 and profit earned is
190. However, average sales through delivery truck is 5634 and profit is 351. From express air
average sale is 1000 and profit is 114. Also, from regular air sales is 1145 and profit is 175.
Year 2010
Interpretation- it is evaluated that in year 2010 average sale was 1662 and profit was 170.
Besides that, sales via delivery truck is 5042 and profit is 240. From express air sales is 1276 and
profit are 198 whereas via regular air sales are 1091 and profit is 153.
Year 2009
4
tabler-icon-diamond-filled.svg

Paraphrase This Document

Need a fresh take? Get an instant paraphrase of this document with our AI Paraphraser
Document Page
Interpretation- it is analysed that average sales during year 2009 is 1775 and profit earned is
181. However, average sales through delivery truck is 5373 and profit is 230. From express air
average sale is 1202 and profit is 148. Also, by regular air sales are 1199 and profit is 177.
So, it can be said that there is decrease in profits in 2010 and 2012. But in 2009 and 2011
profits increased. However, sales has also decreased as well in it. thus, it means in simultaneous
year profit is declined. Also, it has been identified that due to decline in sales of consecutive
years. It highly impacted on profit of super market. the profit decrease from 153 in 2010 to 177
in 2009. Likewise, in 2011 profit was 175 and in 2012 it was 162. So, there was decline of 13 in
it.
Interpretation- It can be interpreted that in 2012 profit of delivery truck was 40,032 which is
2011 was 92, 573. It then declined to 71, 795 in 2010 and further decreased to 63,231 in 2009.
However, profit of express air in 2012 was 44,713 which declined in 2011 to 31,616. In 2010 it
was 48,721 which then declined to 23,273. The regular air profit in 2009 was 374,591 which
decreased in 2010 that is 244,400. In 2011 it increased to 256,120 and further increased to
258,238.
5
Document Page
Pivot table function
It is first step in which data is selected and then click on insert to process it. then, click on pivot
table a dialog box appears in which range of data is selected to obtain outcomes of it.
6
Document Page
After that, in pivot tables there are 4 box present in which data is inserted to analyse it and
generate graphs and charts.
In this step pivot table is created as shown above where values are changed with help of value
field setting.
Excel in pre processing of data
It is necessary to pre process the data before analyzing it so that any missing values or
errors can be rectified. Moreover it helps in arranging of data within various categories so that it
becomes easy to interpret data. Ms Excel is common tool for analyzing of data and doing basic
calculations in it. it also helps in generating graphs and tables from the data analyst. Moreover
data visualization is also a function of Ms Excel to obtain useful results. besides that there are
several preprocessing which is done is Ms Excel it is defined as (Enders, 2017)
V look up function is used for looking for a value in a table and searching it. Besides,
concatenate is used to combine text of two or more rows and columns into one. In addition lower
and upper functions are used in preprocessing data to lower or upper sentence case. the trim
function is used to clear text if there is any blank space identified within database. so it eliminate
those blank space. Also the function is used to verify statement that it is true or false. In pre
processing of data Ms Excel is used to clean the data it means the values which are duplicated or
7
tabler-icon-diamond-filled.svg

Paraphrase This Document

Need a fresh take? Get an instant paraphrase of this document with our AI Paraphraser
Document Page
copied in Excel is removed from it. therefore these are some functions of Ms excel pre
processing of data, arranging it cleaning, doing basic calculation, etc. so it helps in providing a
complete data of tables without any errors or blank space. Pre processing of data enable in
proceeding further and analyzing it in proper way. The data is arranged and all errors are solved
in it (Hagenauer, and et.al, 2019).
Excel in data analysis
Basically, the main purpose of Ms excel is to analyze data in order to obtain outcomes. In
this several other calculations are done to interpret data. Here, sorting is done to arrange data in
ascending and descending order. also, the filter function is applied to collect only relevant data
that is based on certain criteria. It is highly useful in finding out outcomes. The conditional
formatting is useful in highlighting cell whose value is dependent on another cell value. it is
necessary to analyze data in proper way so that useful outcomes are generated. In Ms excel there
are various formulas as well which is used in data analysis such as addition, subtraction, etc.
besides that, average median mode, are also some calculations which is done in analyzing data
Ms Excel (Gholami, and et.al., 2017).
It is found that there are certain complex calculation as well that is done to analyse data
in excel. Here, functions like regression and other is also applied on data to find out useful info.
For that other formula is applied in it. the data analysis is main part in excel as if this is not done
properly then it can impact on results obtained. Excel contains some useful tools in it to interpret
data and info. the features of excel are applied to evaluate data. so, it becomes simple to get
results that are relevant and proper.
MS excel in data visualization
It is found that there are several data analysis techniques used in Excel. This is done to
obtain accurate and useful information. Along with that, regression and correlation are some
advanced functions in Excel. after data analysis, it is necessary to present data with tables Graphs
etc and visualize it. with that it becomes easy to identify trends and patterns in it and also
communicate outcomes to audience in proper way. So data visualization is also useful function
of Ms Excel. There are various types of tables and charts available in Excel searches bars line
chart, scatter, etc through which the outcomes can be presented. data visualization purpose is to
makes data looks easier in order to understand it. this enable in displaying of results and finding
out trends in it. MS excel visualize data in various ways where all things are related to comparing
8
Document Page
of data. In excel visualization is easy as there are variety of options present in it. for getting
different views of data there are many other options available in it. this allows in developing
graphs as per audience suitability. alongside, it is powerful tool of excel (Haby, and et.al., 2019).
Therefore, Ms Excel is tool to process, analyse and visual data to find out outcomes. So, in
all there are some in built functions and formulas which is applied. Thus, data is simplified and
presented in efficient way. These all are use of excel that makes it easy to analyse data in proper
way.
PART 2
2.1 Specific example of clustering
9
Document Page
Interpretation- It can be interpreted that in cluster A there are those people who eat rice and
belong to age group of 16- 19. Also, in cluster B people belong to age group of 20 -22 who eat
rice.
Frequencies
Frequency Table
10
tabler-icon-diamond-filled.svg

Paraphrase This Document

Need a fresh take? Get an instant paraphrase of this document with our AI Paraphraser
Document Page
Interpretation- it is analysed from table that there are 50 males and 50 females customers from
total sample size of 100 people.
11
Document Page
Interpretation- by analyzing data it is stated that out of 100 customers, 60 east rice and 40 do not
ear rice.
Frequencies
12
chevron_up_icon
1 out of 19
circle_padding
hide_on_mobile
zoom_out_icon
[object Object]