Understanding and Managing Data: Assignment 3 Analysis Report
VerifiedAdded on 2022/12/30
|12
|627
|51
Homework Assignment
AI Summary
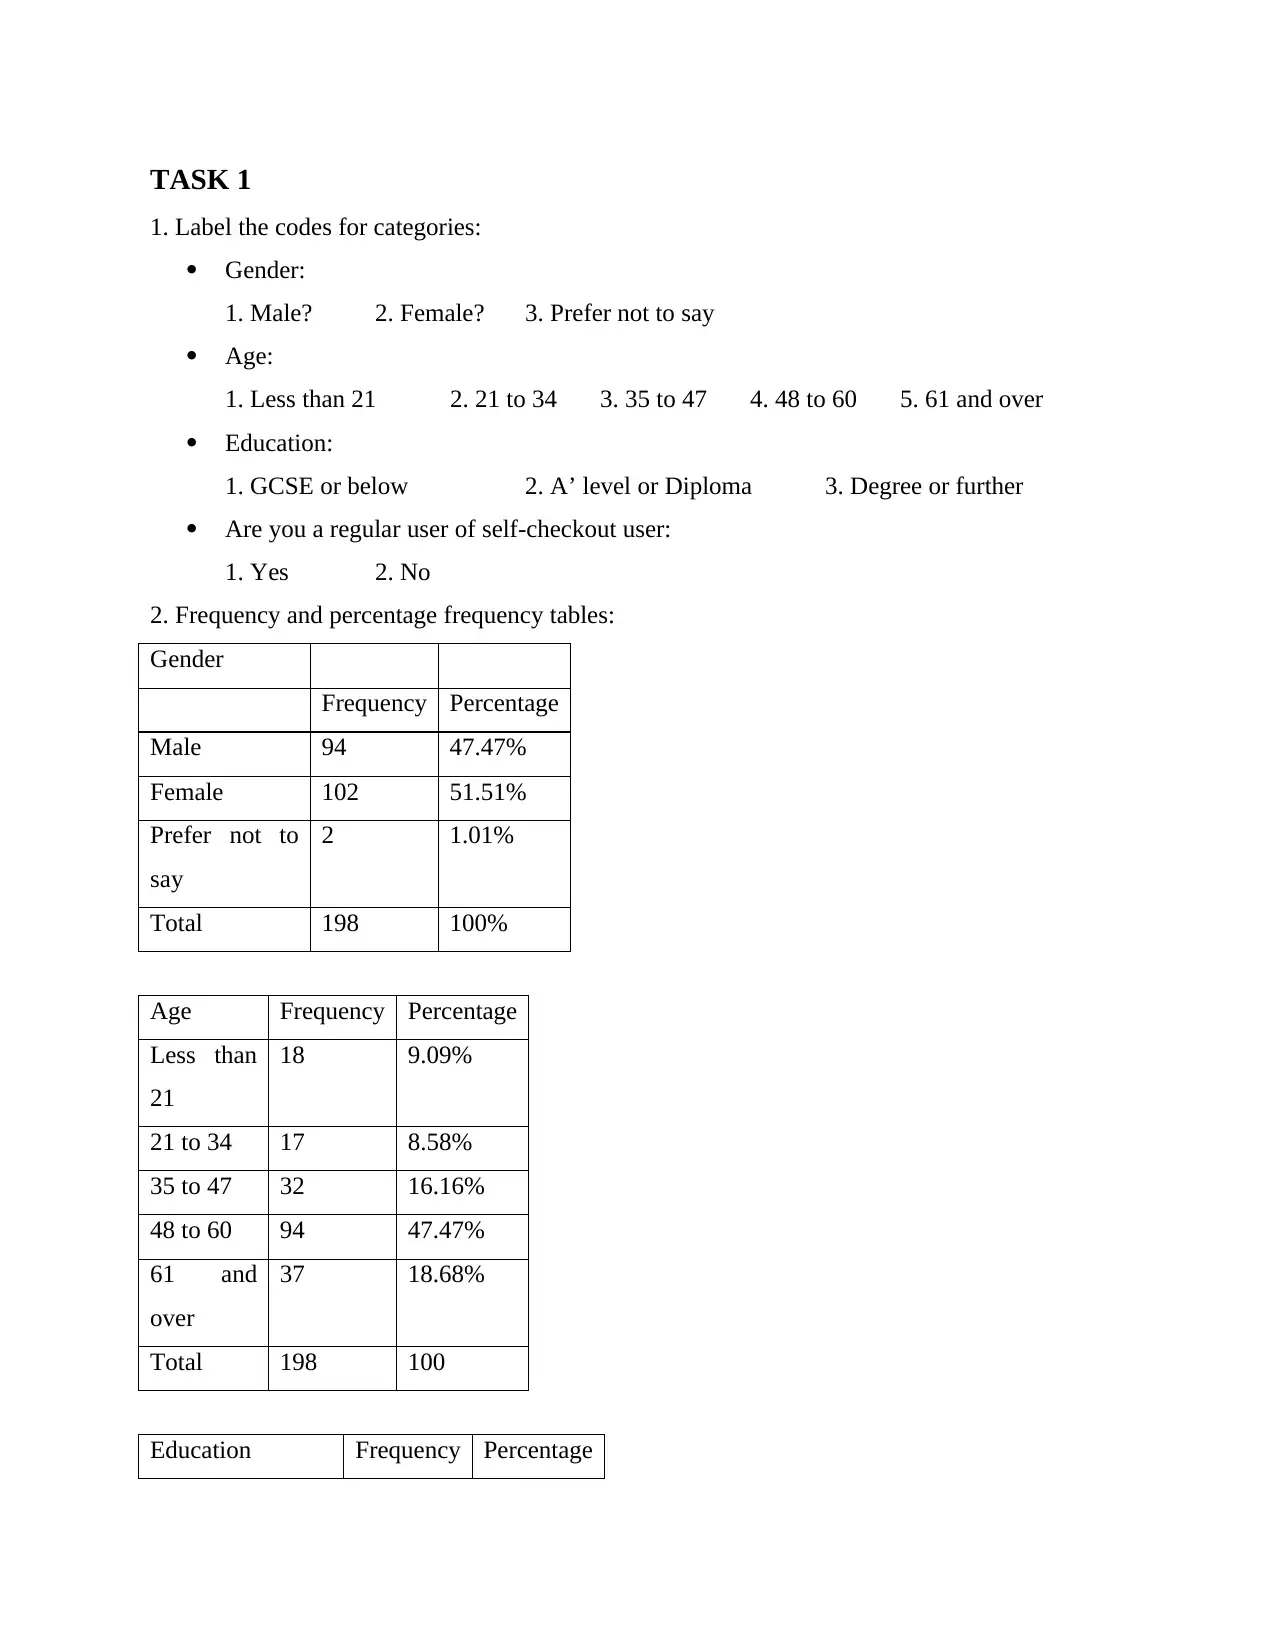
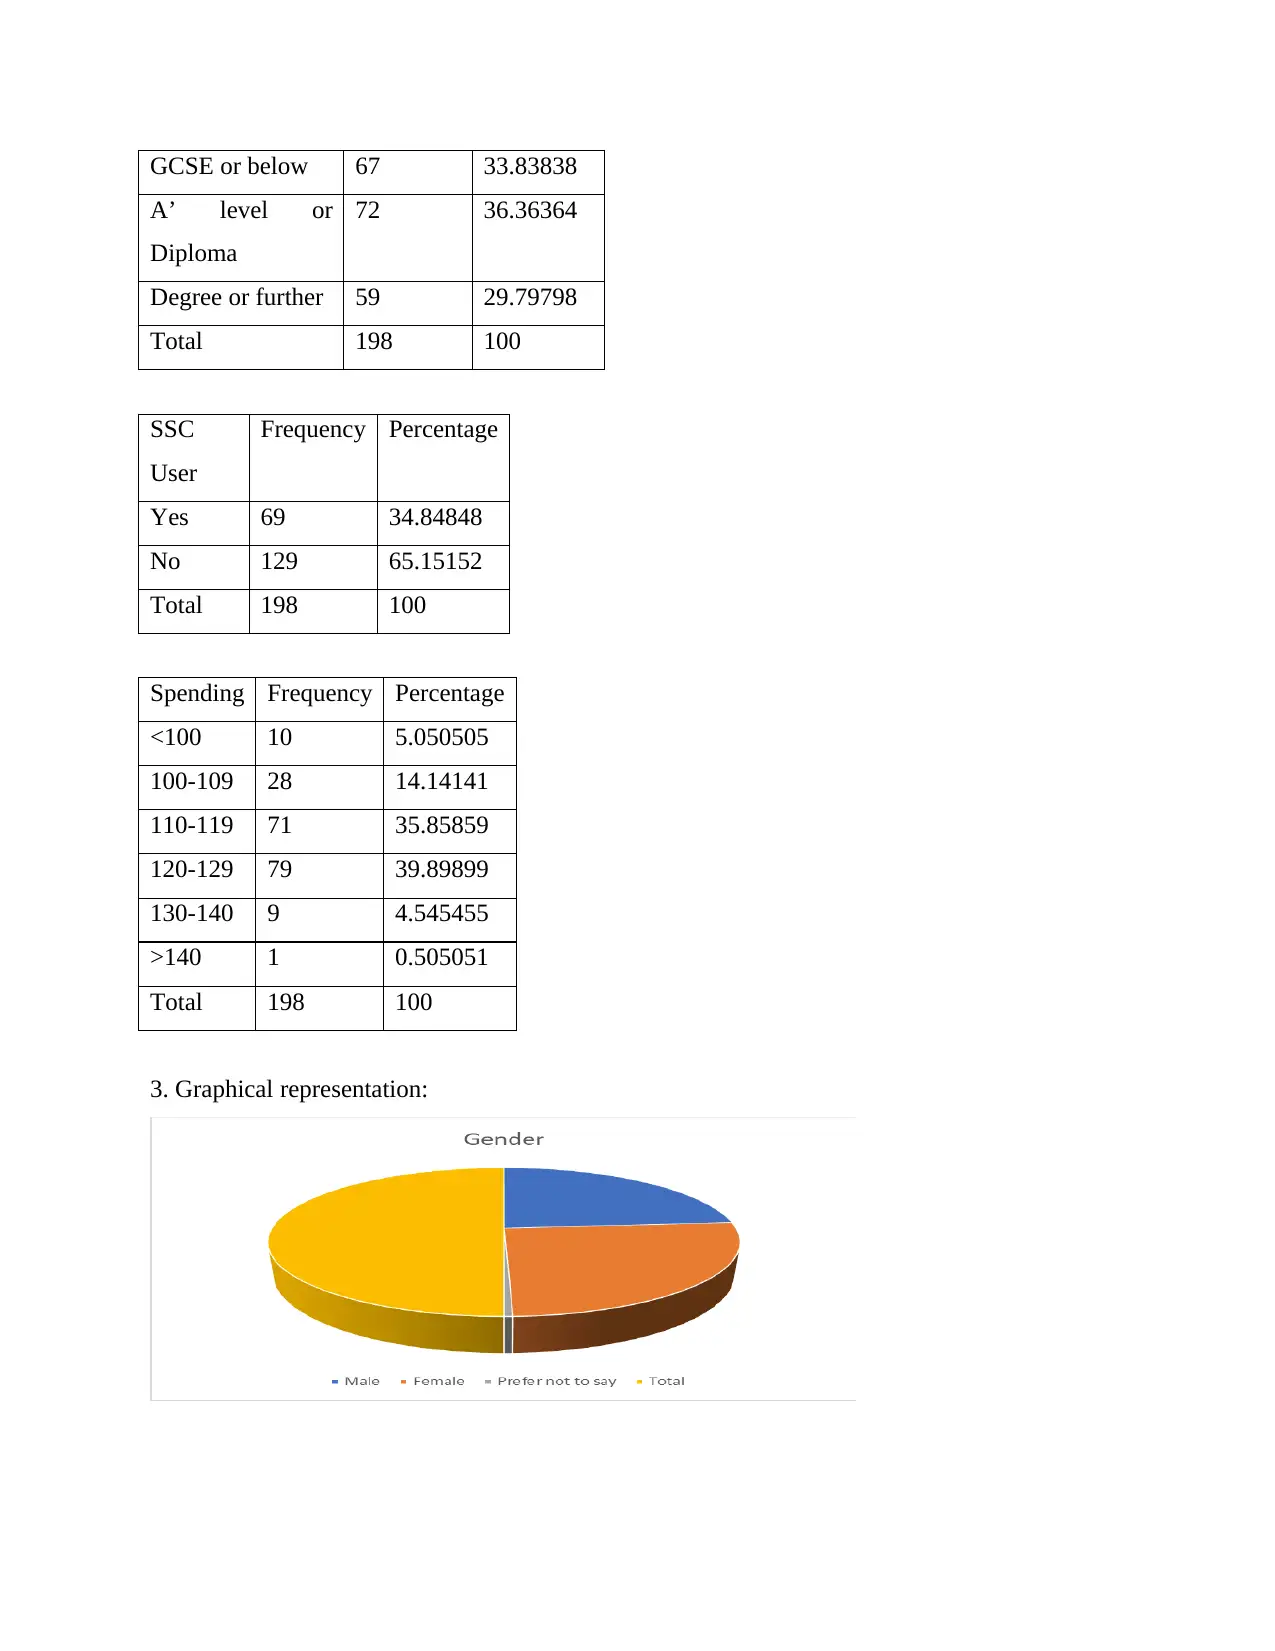
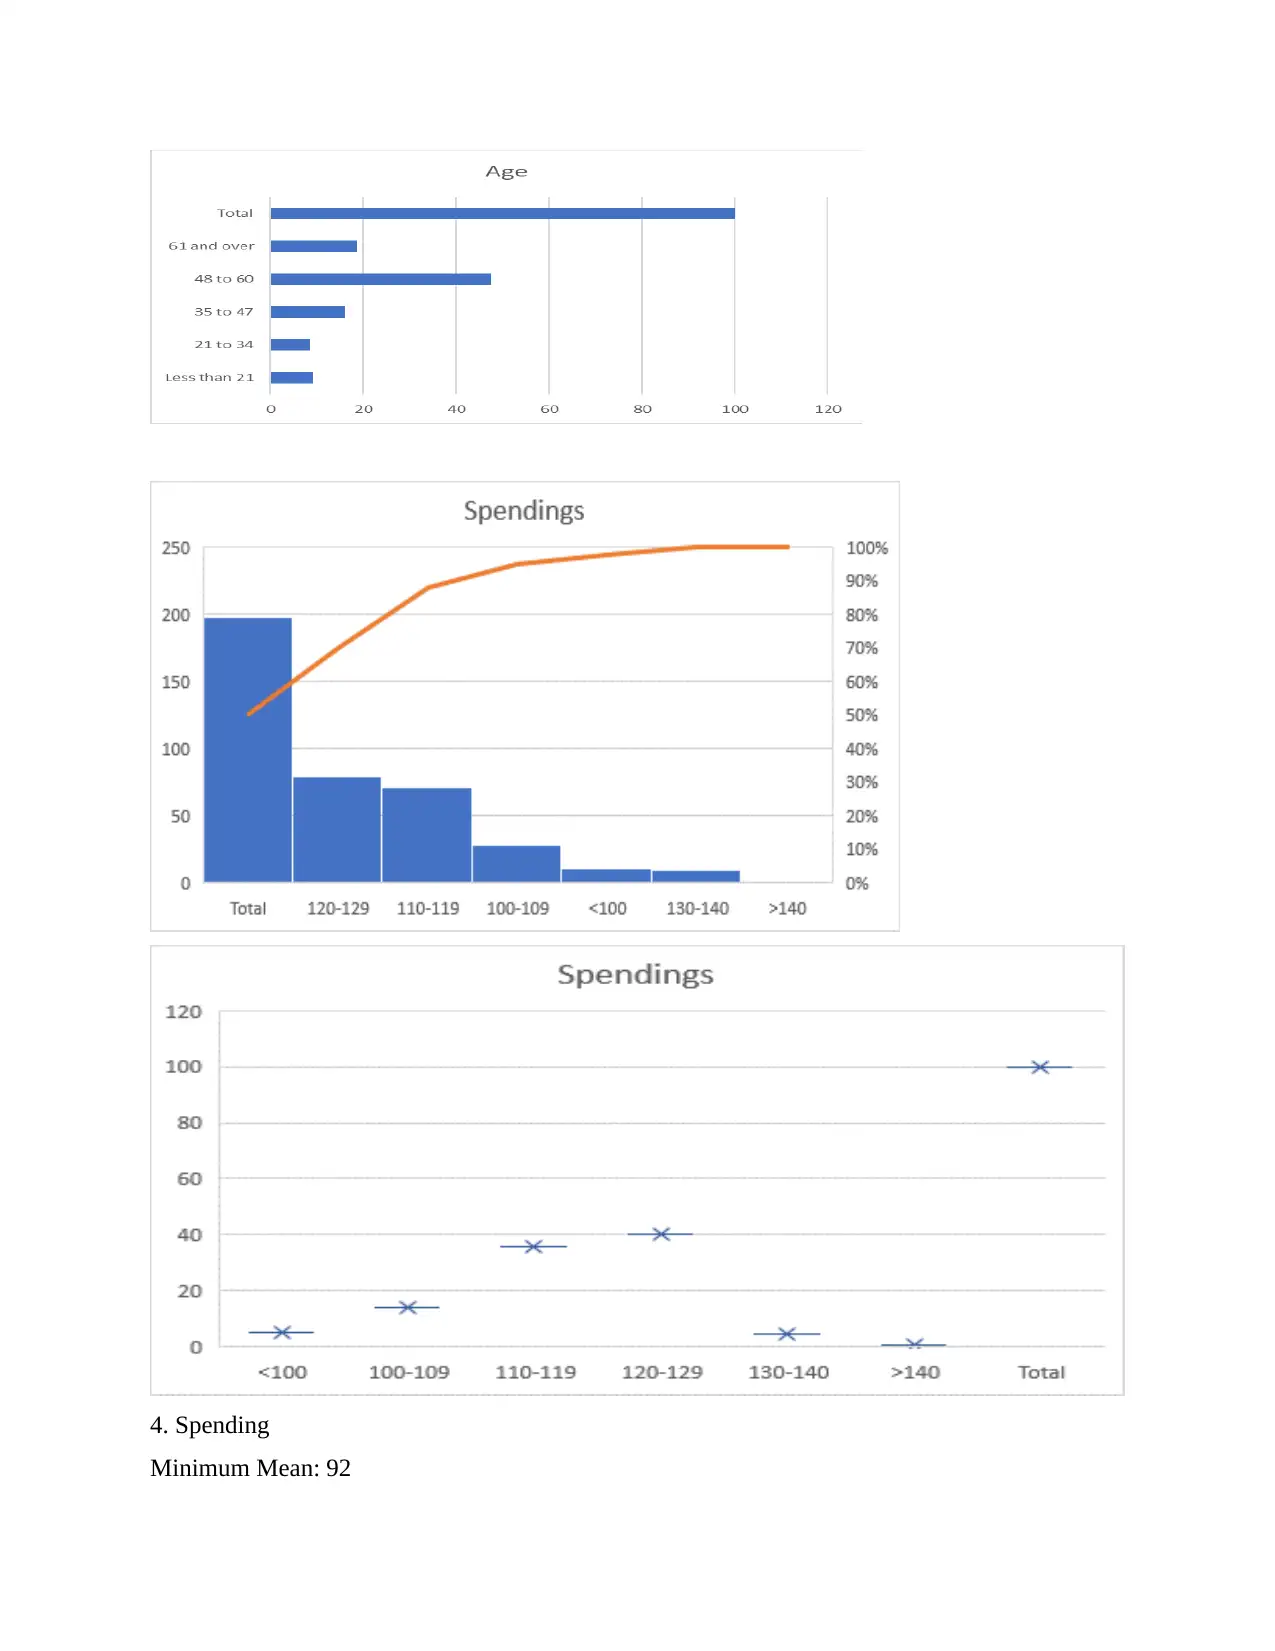
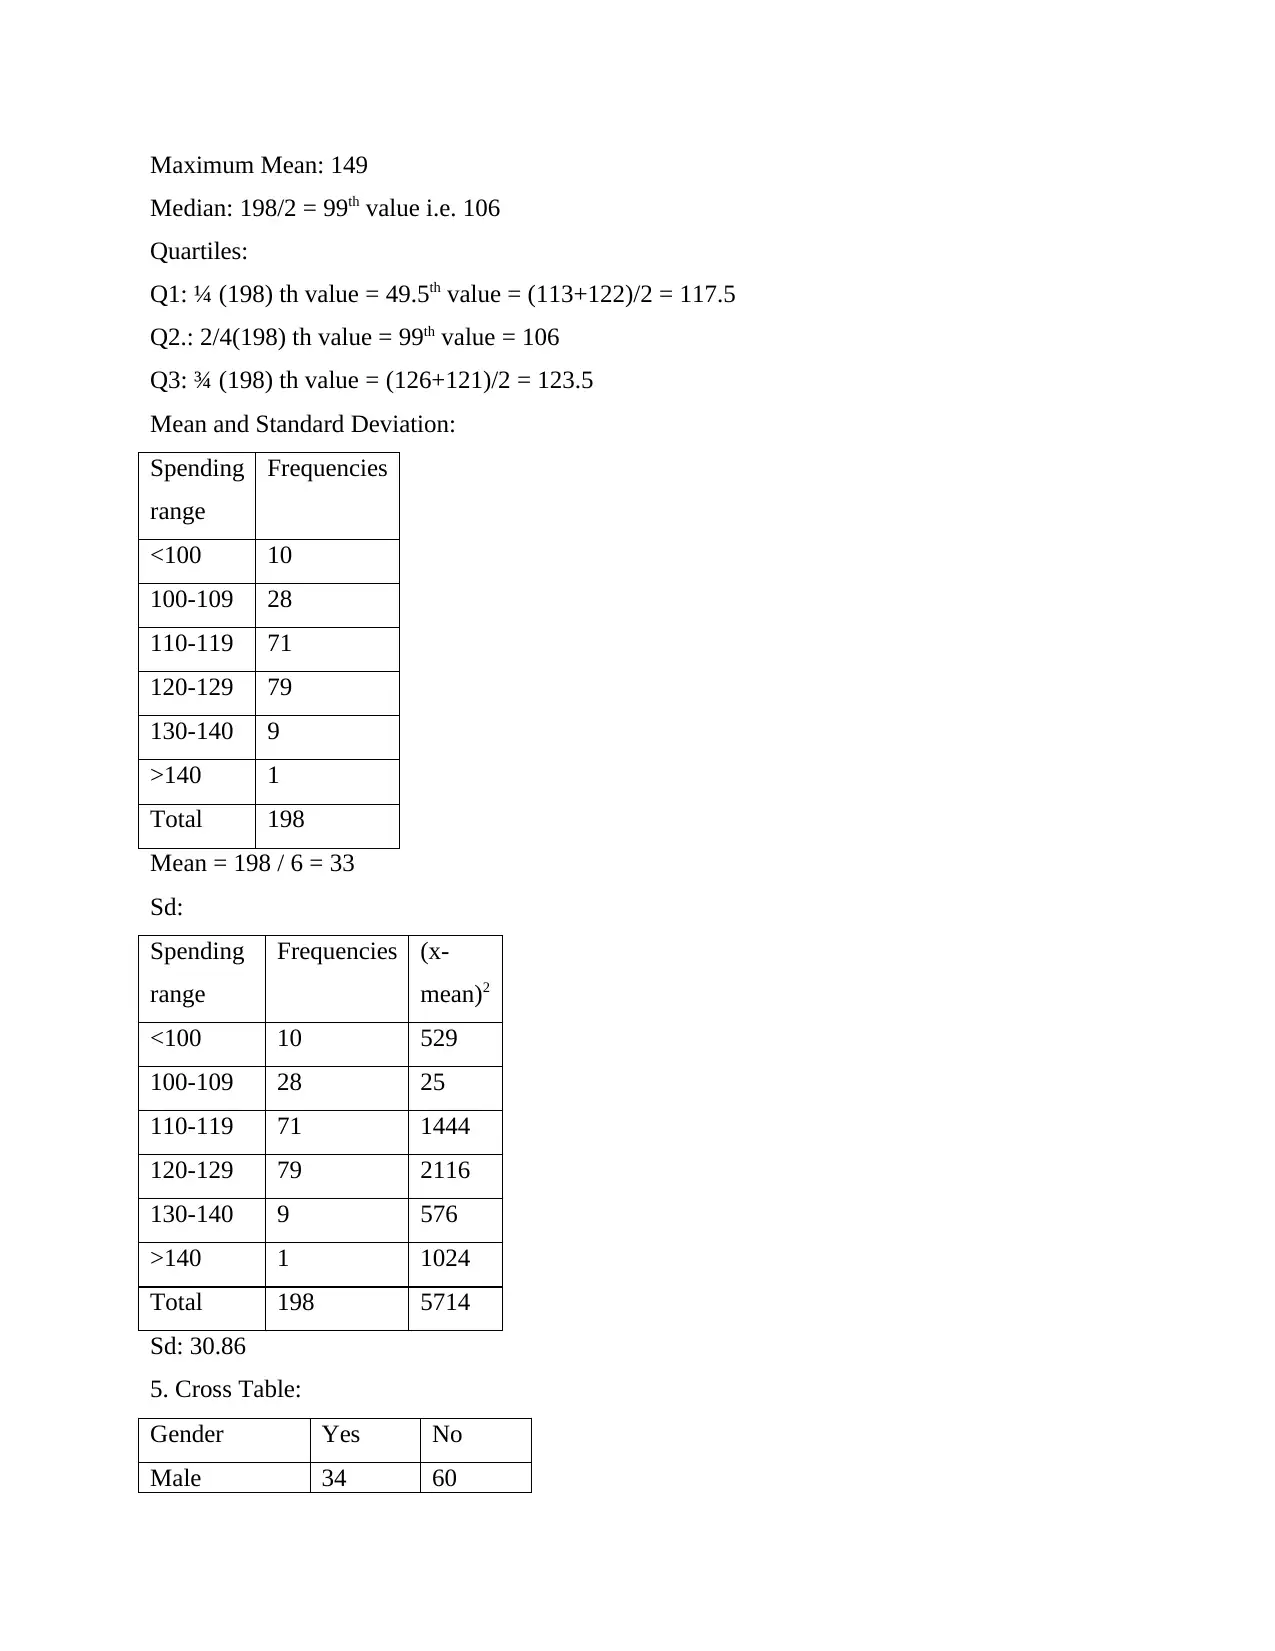
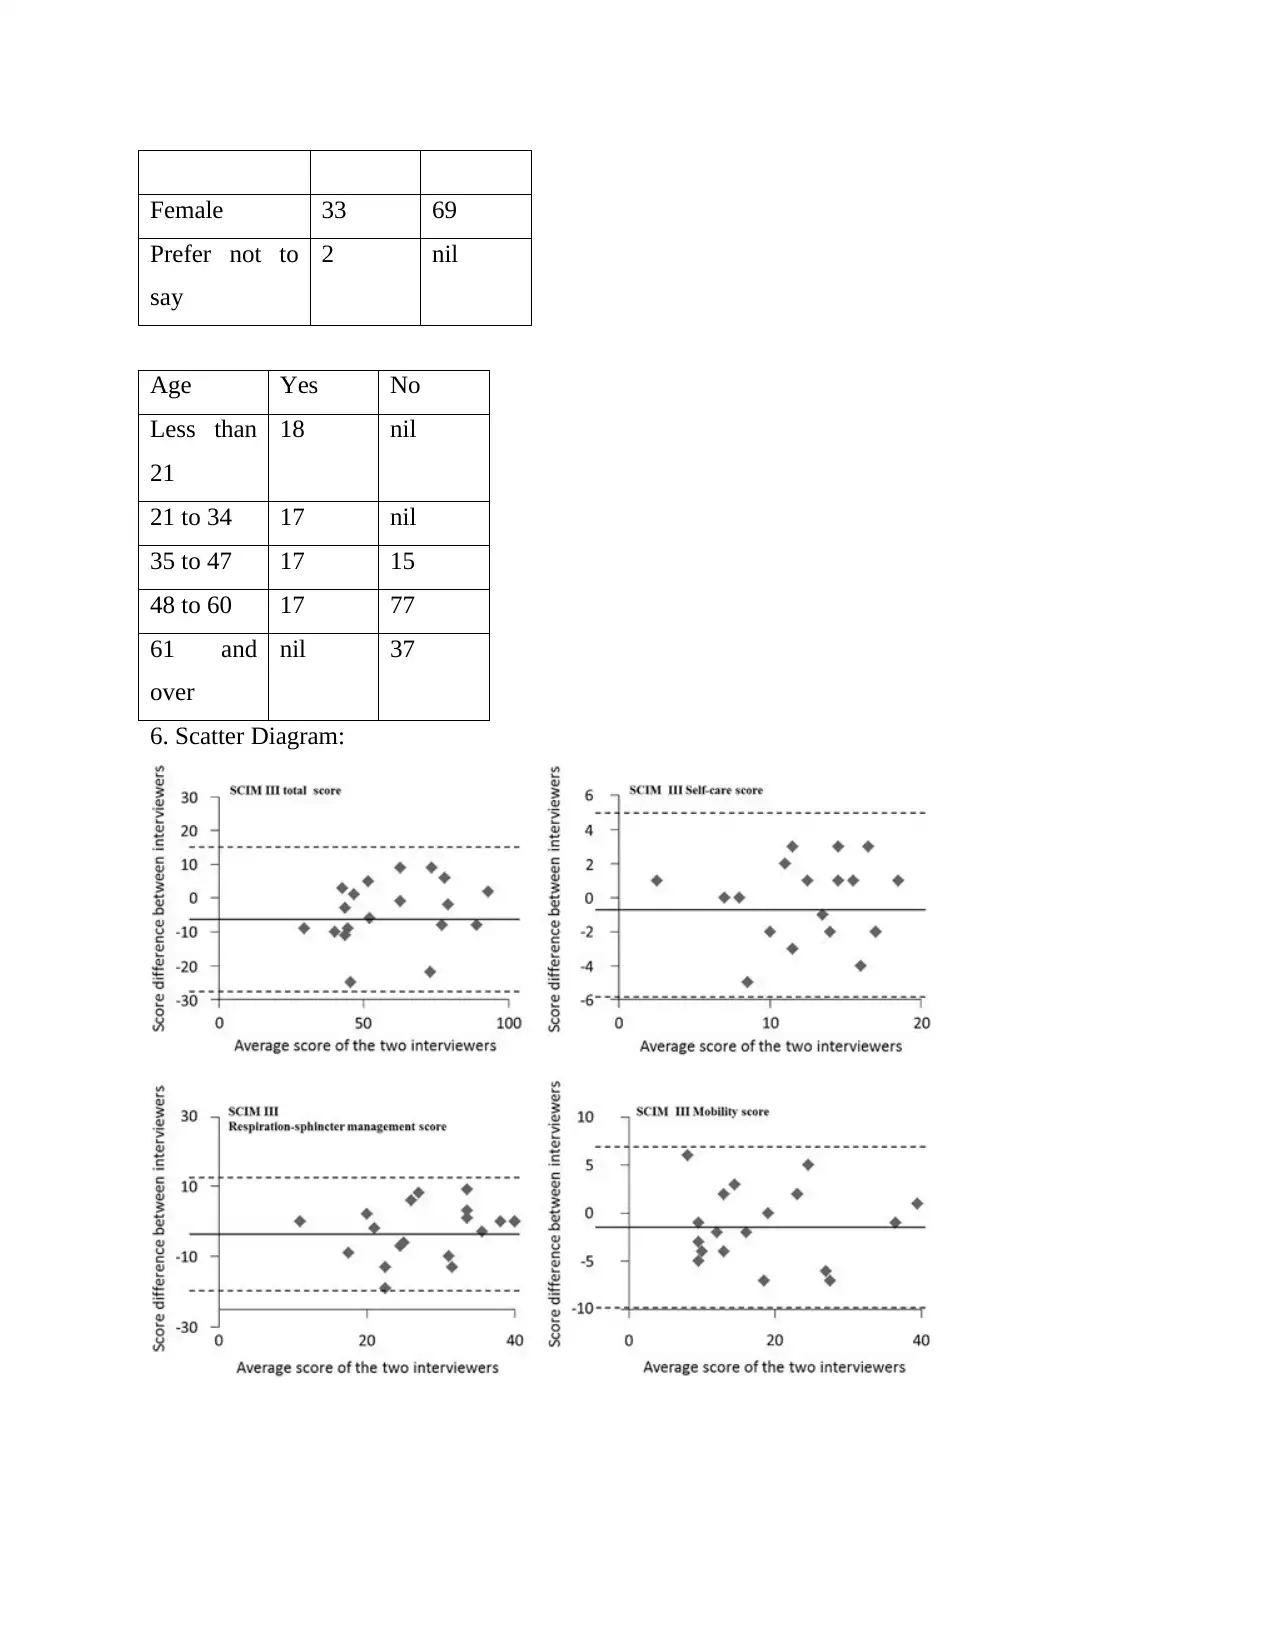
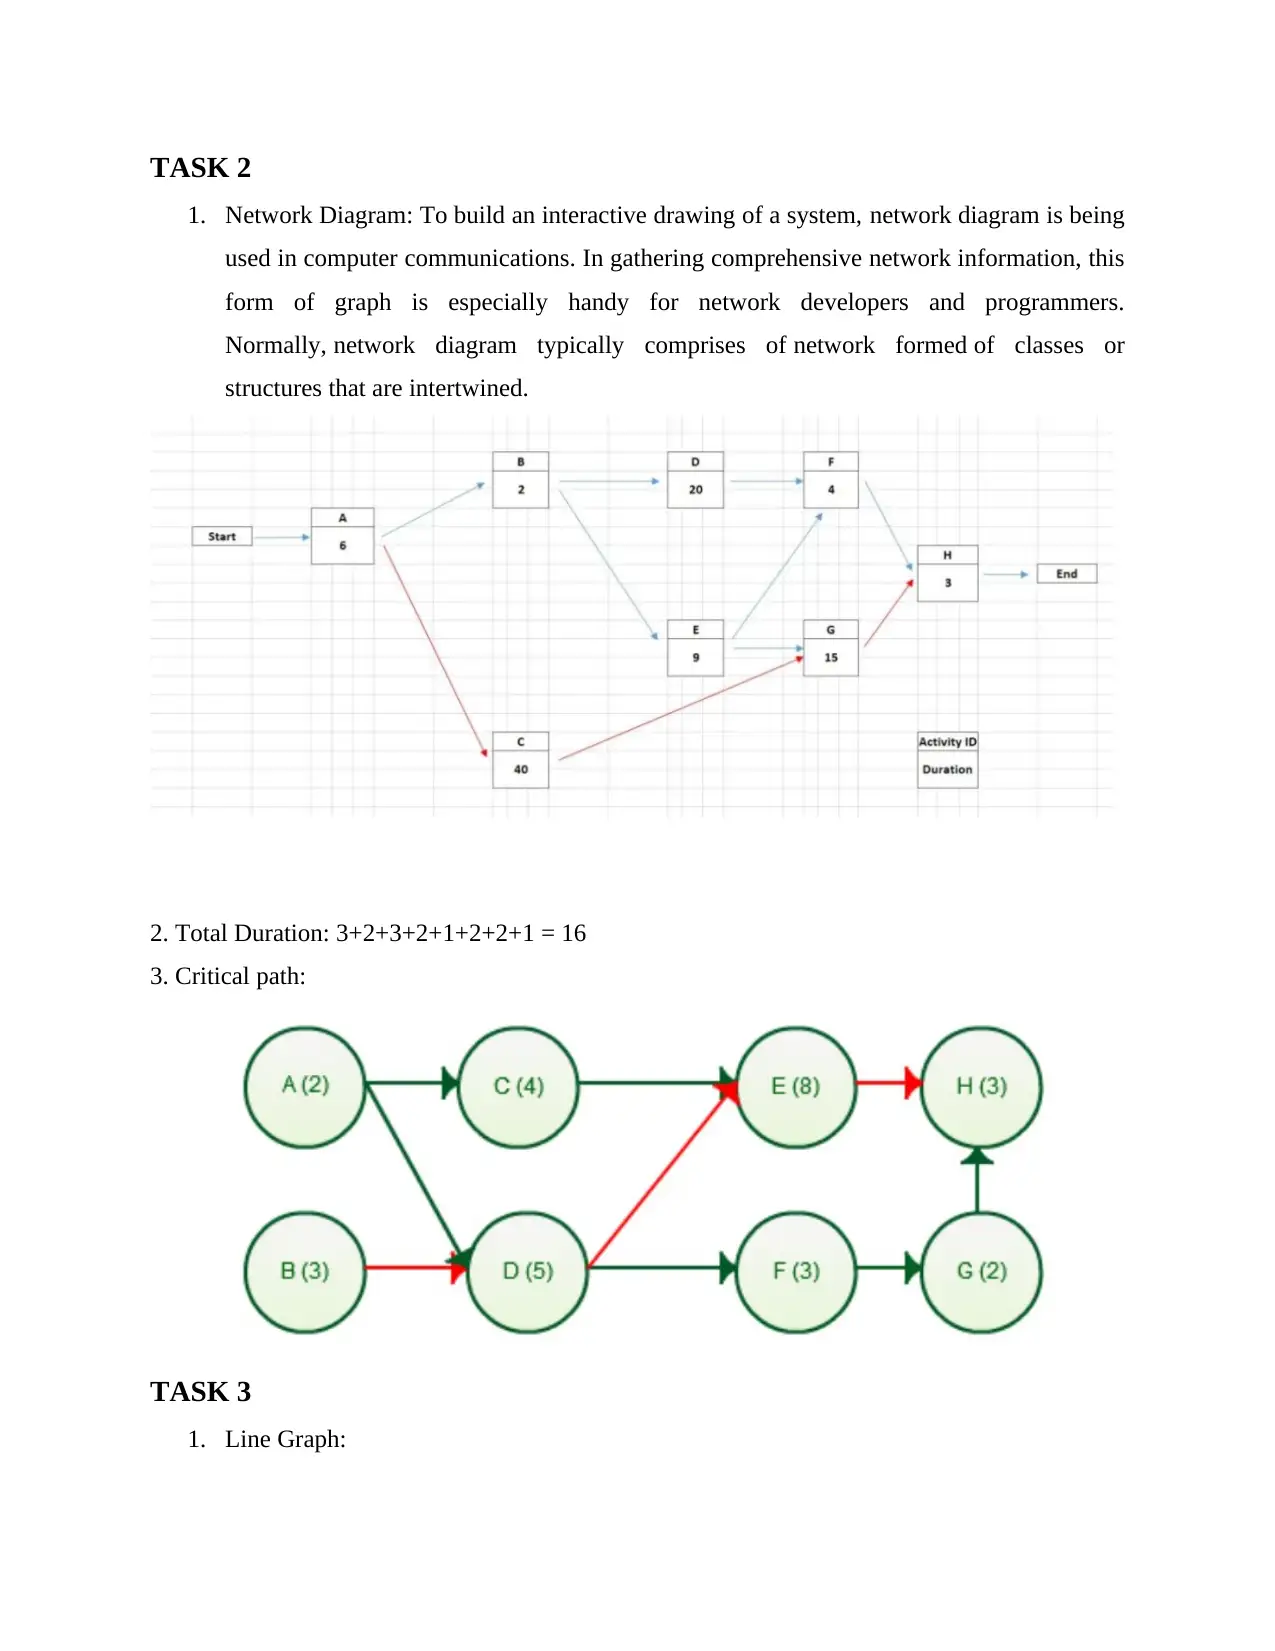
This assignment analyzes data from a supermarket survey investigating customer resistance to self-checkout counters. The solution begins with labeling codes for categories like gender, age, education, and self-checkout usage. It then presents frequency and percentage frequency tables for these categories and graphical representations of the data. The analysis includes calculating spending statistics like minimum, mean, median, and quartiles, along with mean and standard deviation. Cross tables and scatter diagrams are used to explore relationships between variables. The assignment further involves creating a network diagram, determining the total duration and critical path. Finally, it incorporates line graphs with moving averages to analyze sales trends, and a cost-benefit analysis of products.
1 out of 12
Related Documents

![Data Management: Analysis and Information Report - [Course Name]](/_next/image/?url=https%3A%2F%2Fdesklib.com%2Fmedia%2Fimages%2Fdt%2Fc9801fee81684feb8547b0107675b6dc.jpg&w=256&q=75)


Your All-in-One AI-Powered Toolkit for Academic Success.
+13062052269
info@desklib.com
Available 24*7 on WhatsApp / Email
![[object Object]](/_next/static/media/star-bottom.7253800d.svg)
Copyright © 2020–2026 A2Z Services. All Rights Reserved. Developed and managed by ZUCOL.