Analysis of Employee Survey Data at SuperPart Industries: Report
VerifiedAdded on 2020/02/24
|11
|2149
|183
Report
AI Summary
This report presents an analysis of employee survey data from SuperPart Industries, addressing queries from the Vice-President of Human Resources. The analysis, based on a sample of 400 employees, examines age profiles, exploring associations between demographics, occupation, working hours, and pre-tax income. Key findings include an average employee age of 39.41 years, a weak correlation between age and income, and a generally satisfactory work environment, with higher satisfaction among non-union employees. The report also investigates working hours, union membership, and worker retention, using statistical methods to estimate employee turnover and assess the significance of survey sample sizes. It concludes with recommendations for future surveys and provides detailed insights into employee satisfaction levels and related factors.
Running Head: FOUNDATION SKILLS IN DATA ANALYSIS
Foundation Skills in Data Analysis
Name of the Student
Name of the University
Author Note
Foundation Skills in Data Analysis
Name of the Student
Name of the University
Author Note
Paraphrase This Document
Need a fresh take? Get an instant paraphrase of this document with our AI Paraphraser
1FOUNDATION SKILLS IN DATA ANALYSIS
Executive Summary
The Vice-President of human resources at SuperPart Industries has some queries regarding
certain matters which relate to the satisfaction survey of the employees. The analysis has been
conducted as a result of his queries and in order to answer them. From the analysis a similarity
between the employees average age has been observed. There has also been observed that the
relationship between age of the employees and their pre-tax income is significantly little. With
the help of the analysis, it has also been observed that the work environment at SuperPart is
satisfactory to the employees. It has further been observed that the satisfaction is mostly among
the non-union employees. Similarity has also been observed in the average working hours of the
employees. The non-union employees work for 45 hours in a week on an average. Again, the
employees who belong to any kinds of unions are less than the national average.
2FOUNDATION SKILLS IN DATA ANALYSIS
Table of Contents
Age profile of the employees at SuperPart......................................................................................4
Exploring Associations....................................................................................................................5
Occupation within SuperPart.......................................................................................................5
The number of Hours Worked.....................................................................................................5
Before-Taxes Income...................................................................................................................5
Differences in the levels of job-satisfaction....................................................................................6
Satisfaction Summary..................................................................................................................6
Union Membership and Job Satisfaction.....................................................................................6
Working Hours and Job Satisfaction...........................................................................................7
Worker Retention.............................................................................................................................7
Union Memberships.........................................................................................................................8
Part a............................................................................................................................................8
Part b............................................................................................................................................8
Part c............................................................................................................................................9
Part d............................................................................................................................................9
Future Surveys.................................................................................................................................9
Working Hours............................................................................................................................9
Number of Satisfied employees.................................................................................................10
⊘ This is a preview!⊘
Do you want full access?
Subscribe today to unlock all pages.
Trusted by 1+ million students worldwide
3FOUNDATION SKILLS IN DATA ANALYSIS
To : Hannah Zhou, Vice-President of Human Resources
From : Sandy Stedwell, Research and Analysis Department
Subject: Survey Data Analysis of the Employees of Superpart
Dear Hannah Zhou,
I am presenting the results obtained from the analysis of the employees’ survey data of
SuperPart. There are a total of 9800 employees working in Superpart. It would have become
extremely problematic to analyze and study the responses of all the employees. Thus, for
simplicity of the analysis, a sample of 400 employees has been selected and their responses have
been recorded and analyzed. I assume that the results of this analysis will be sufficient to answer
your queries.
Age profile of the employees at SuperPart
It has been observed that the employees of SuperPart has an average age of 39.41 years.
The variation of their ages is found to be 10.61 years. The youngest employee of the company
was found to be 18 years and the oldest employee of the company is 69 years old. It can also be
seen that the age of 50 percent of the employees are more than 38 years. The ages of 25 percent
of the employees are less than 32 years and 25 percent of the employees are higher than 46 years.
One of the employee has been found to be much high as compared to the other employees.
Paraphrase This Document
Need a fresh take? Get an instant paraphrase of this document with our AI Paraphraser
4FOUNDATION SKILLS IN DATA ANALYSIS
Exploring Associations
Occupation within SuperPart
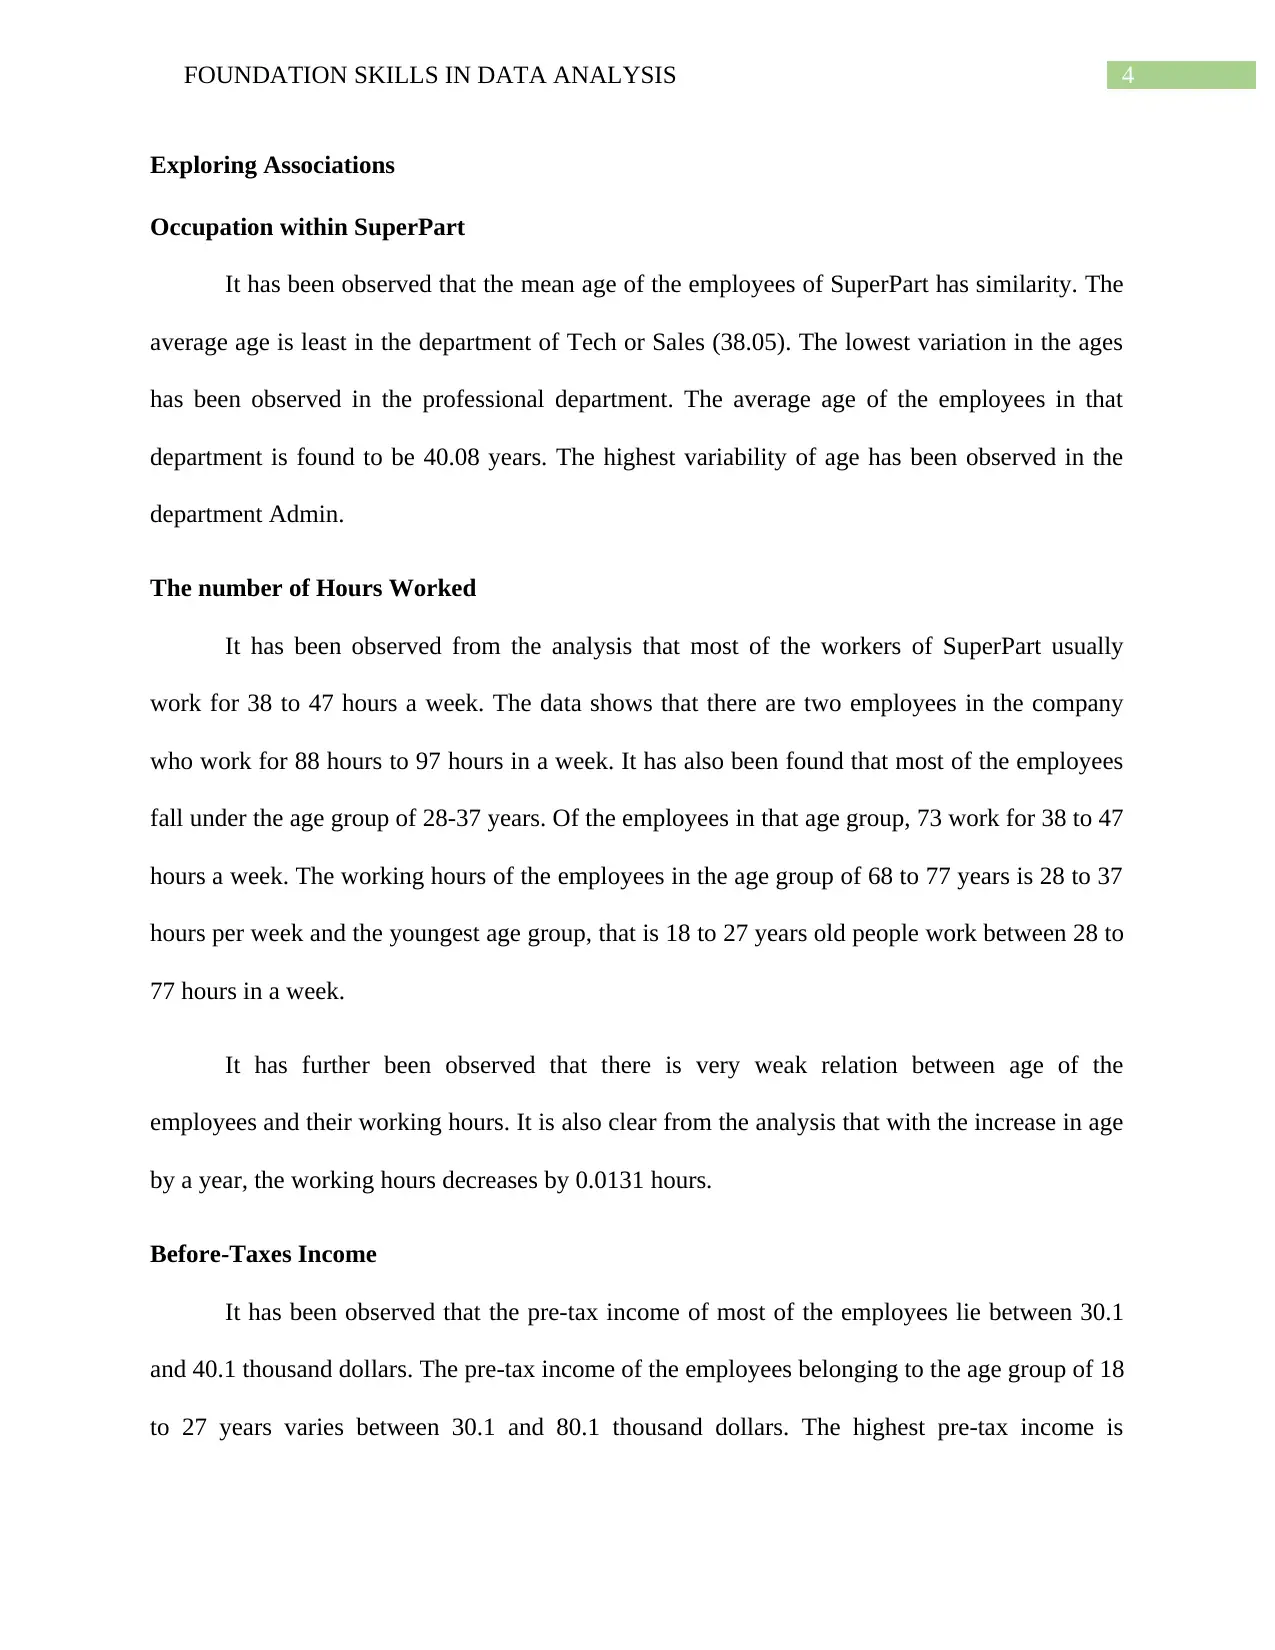
It has been observed that the mean age of the employees of SuperPart has similarity. The
average age is least in the department of Tech or Sales (38.05). The lowest variation in the ages
has been observed in the professional department. The average age of the employees in that
department is found to be 40.08 years. The highest variability of age has been observed in the
department Admin.
The number of Hours Worked
It has been observed from the analysis that most of the workers of SuperPart usually
work for 38 to 47 hours a week. The data shows that there are two employees in the company
who work for 88 hours to 97 hours in a week. It has also been found that most of the employees
fall under the age group of 28-37 years. Of the employees in that age group, 73 work for 38 to 47
hours a week. The working hours of the employees in the age group of 68 to 77 years is 28 to 37
hours per week and the youngest age group, that is 18 to 27 years old people work between 28 to
77 hours in a week.
It has further been observed that there is very weak relation between age of the
employees and their working hours. It is also clear from the analysis that with the increase in age
by a year, the working hours decreases by 0.0131 hours.
Before-Taxes Income
It has been observed that the pre-tax income of most of the employees lie between 30.1
and 40.1 thousand dollars. The pre-tax income of the employees belonging to the age group of 18
to 27 years varies between 30.1 and 80.1 thousand dollars. The highest pre-tax income is
Exploring Associations
Occupation within SuperPart
It has been observed that the mean age of the employees of SuperPart has similarity. The
average age is least in the department of Tech or Sales (38.05). The lowest variation in the ages
has been observed in the professional department. The average age of the employees in that
department is found to be 40.08 years. The highest variability of age has been observed in the
department Admin.
The number of Hours Worked
It has been observed from the analysis that most of the workers of SuperPart usually
work for 38 to 47 hours a week. The data shows that there are two employees in the company
who work for 88 hours to 97 hours in a week. It has also been found that most of the employees
fall under the age group of 28-37 years. Of the employees in that age group, 73 work for 38 to 47
hours a week. The working hours of the employees in the age group of 68 to 77 years is 28 to 37
hours per week and the youngest age group, that is 18 to 27 years old people work between 28 to
77 hours in a week.
It has further been observed that there is very weak relation between age of the
employees and their working hours. It is also clear from the analysis that with the increase in age
by a year, the working hours decreases by 0.0131 hours.
Before-Taxes Income
It has been observed that the pre-tax income of most of the employees lie between 30.1
and 40.1 thousand dollars. The pre-tax income of the employees belonging to the age group of 18
to 27 years varies between 30.1 and 80.1 thousand dollars. The highest pre-tax income is
5FOUNDATION SKILLS IN DATA ANALYSIS
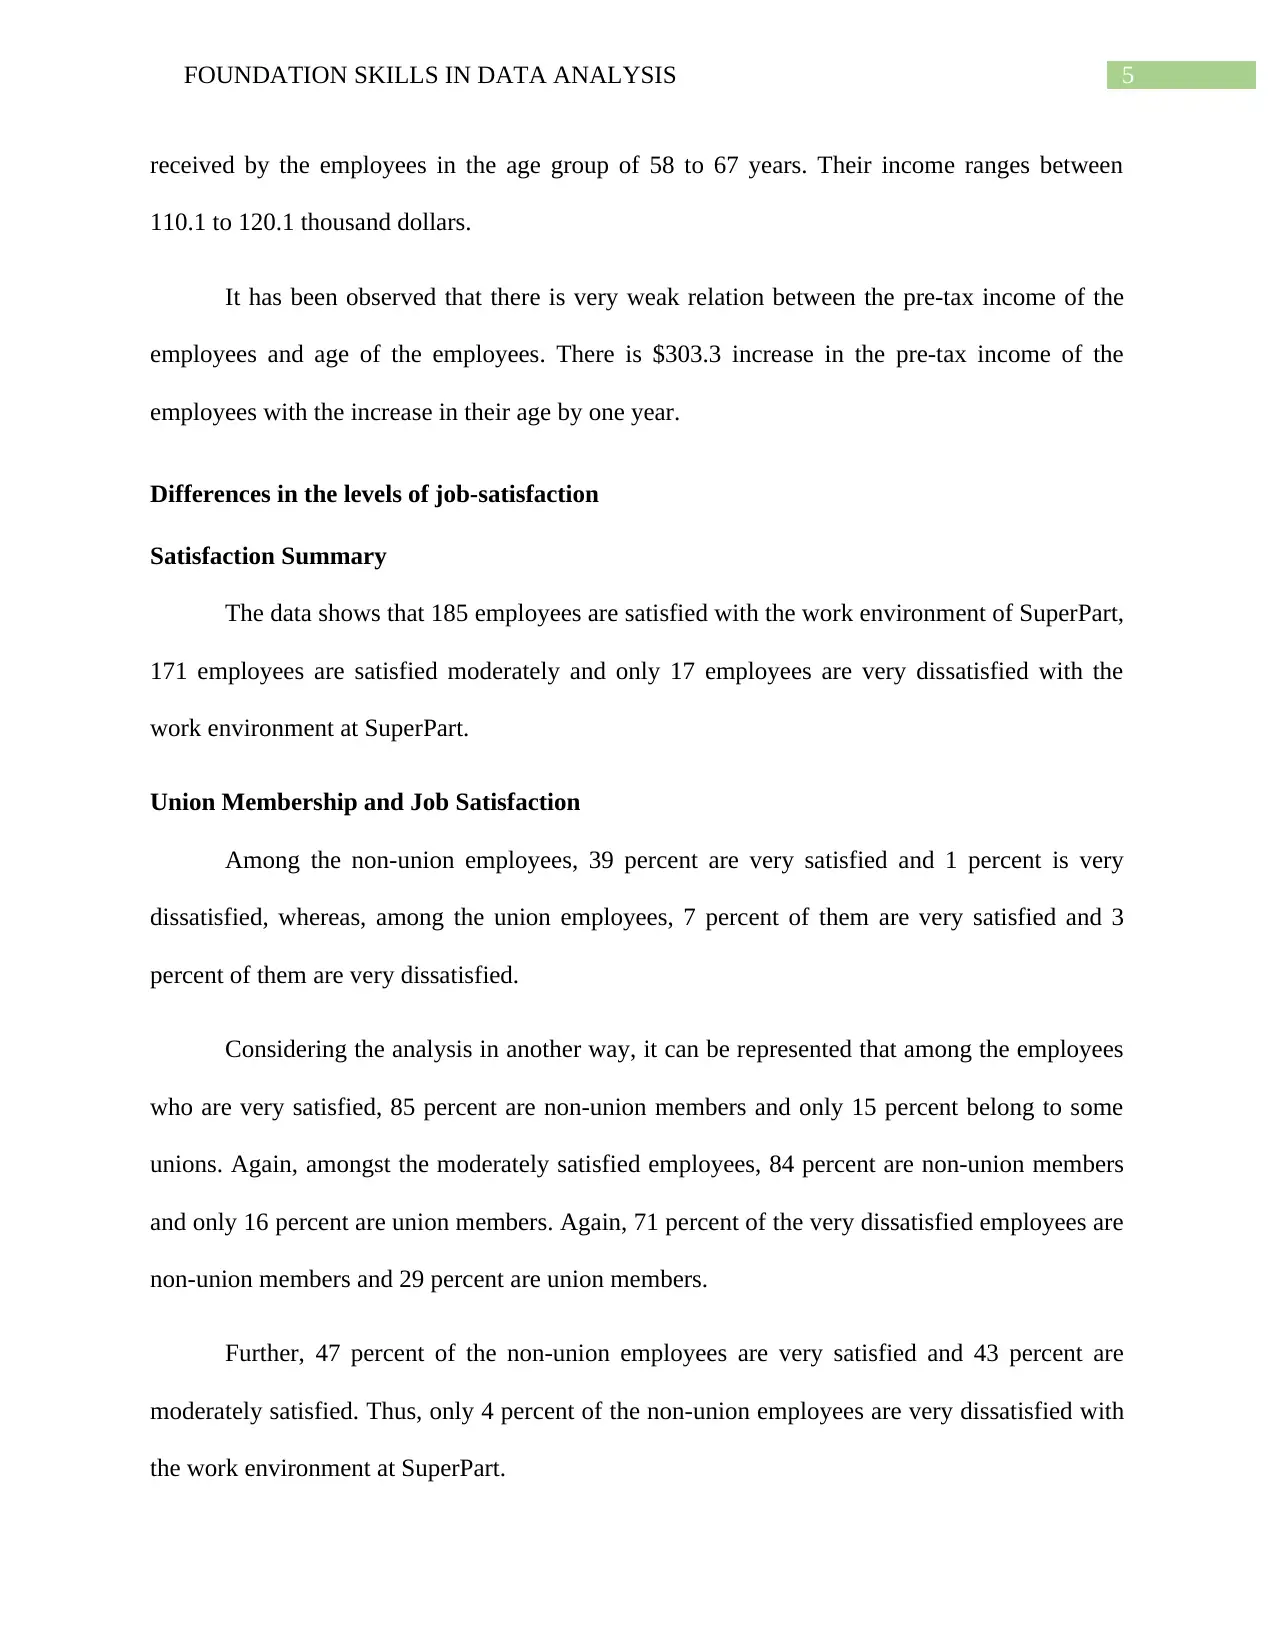
received by the employees in the age group of 58 to 67 years. Their income ranges between
110.1 to 120.1 thousand dollars.
It has been observed that there is very weak relation between the pre-tax income of the
employees and age of the employees. There is $303.3 increase in the pre-tax income of the
employees with the increase in their age by one year.
Differences in the levels of job-satisfaction
Satisfaction Summary
The data shows that 185 employees are satisfied with the work environment of SuperPart,
171 employees are satisfied moderately and only 17 employees are very dissatisfied with the
work environment at SuperPart.
Union Membership and Job Satisfaction
Among the non-union employees, 39 percent are very satisfied and 1 percent is very
dissatisfied, whereas, among the union employees, 7 percent of them are very satisfied and 3
percent of them are very dissatisfied.
Considering the analysis in another way, it can be represented that among the employees
who are very satisfied, 85 percent are non-union members and only 15 percent belong to some
unions. Again, amongst the moderately satisfied employees, 84 percent are non-union members
and only 16 percent are union members. Again, 71 percent of the very dissatisfied employees are
non-union members and 29 percent are union members.
Further, 47 percent of the non-union employees are very satisfied and 43 percent are
moderately satisfied. Thus, only 4 percent of the non-union employees are very dissatisfied with
the work environment at SuperPart.
⊘ This is a preview!⊘
Do you want full access?
Subscribe today to unlock all pages.
Trusted by 1+ million students worldwide
6FOUNDATION SKILLS IN DATA ANALYSIS
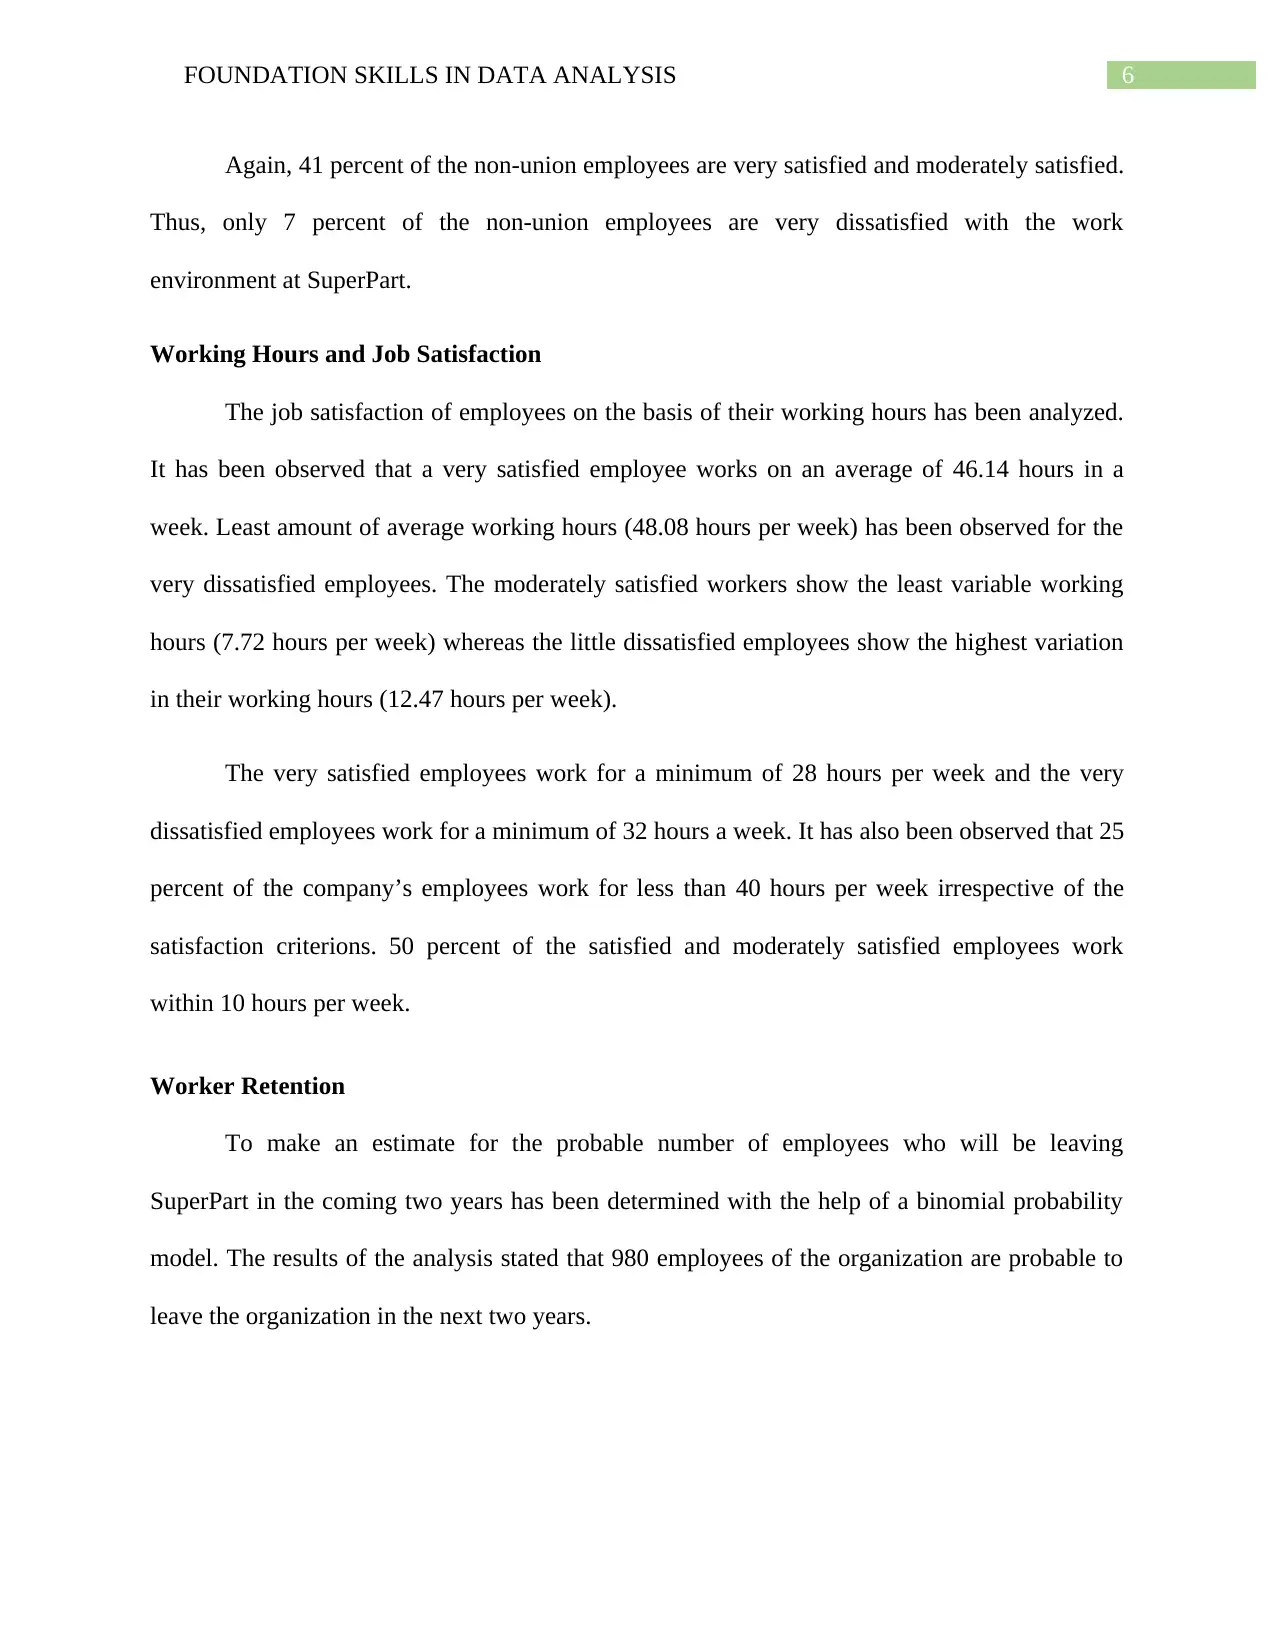
Again, 41 percent of the non-union employees are very satisfied and moderately satisfied.
Thus, only 7 percent of the non-union employees are very dissatisfied with the work
environment at SuperPart.
Working Hours and Job Satisfaction
The job satisfaction of employees on the basis of their working hours has been analyzed.
It has been observed that a very satisfied employee works on an average of 46.14 hours in a
week. Least amount of average working hours (48.08 hours per week) has been observed for the
very dissatisfied employees. The moderately satisfied workers show the least variable working
hours (7.72 hours per week) whereas the little dissatisfied employees show the highest variation
in their working hours (12.47 hours per week).
The very satisfied employees work for a minimum of 28 hours per week and the very
dissatisfied employees work for a minimum of 32 hours a week. It has also been observed that 25
percent of the company’s employees work for less than 40 hours per week irrespective of the
satisfaction criterions. 50 percent of the satisfied and moderately satisfied employees work
within 10 hours per week.
Worker Retention
To make an estimate for the probable number of employees who will be leaving
SuperPart in the coming two years has been determined with the help of a binomial probability
model. The results of the analysis stated that 980 employees of the organization are probable to
leave the organization in the next two years.
Paraphrase This Document
Need a fresh take? Get an instant paraphrase of this document with our AI Paraphraser
7FOUNDATION SKILLS IN DATA ANALYSIS
Union Memberships
Part a
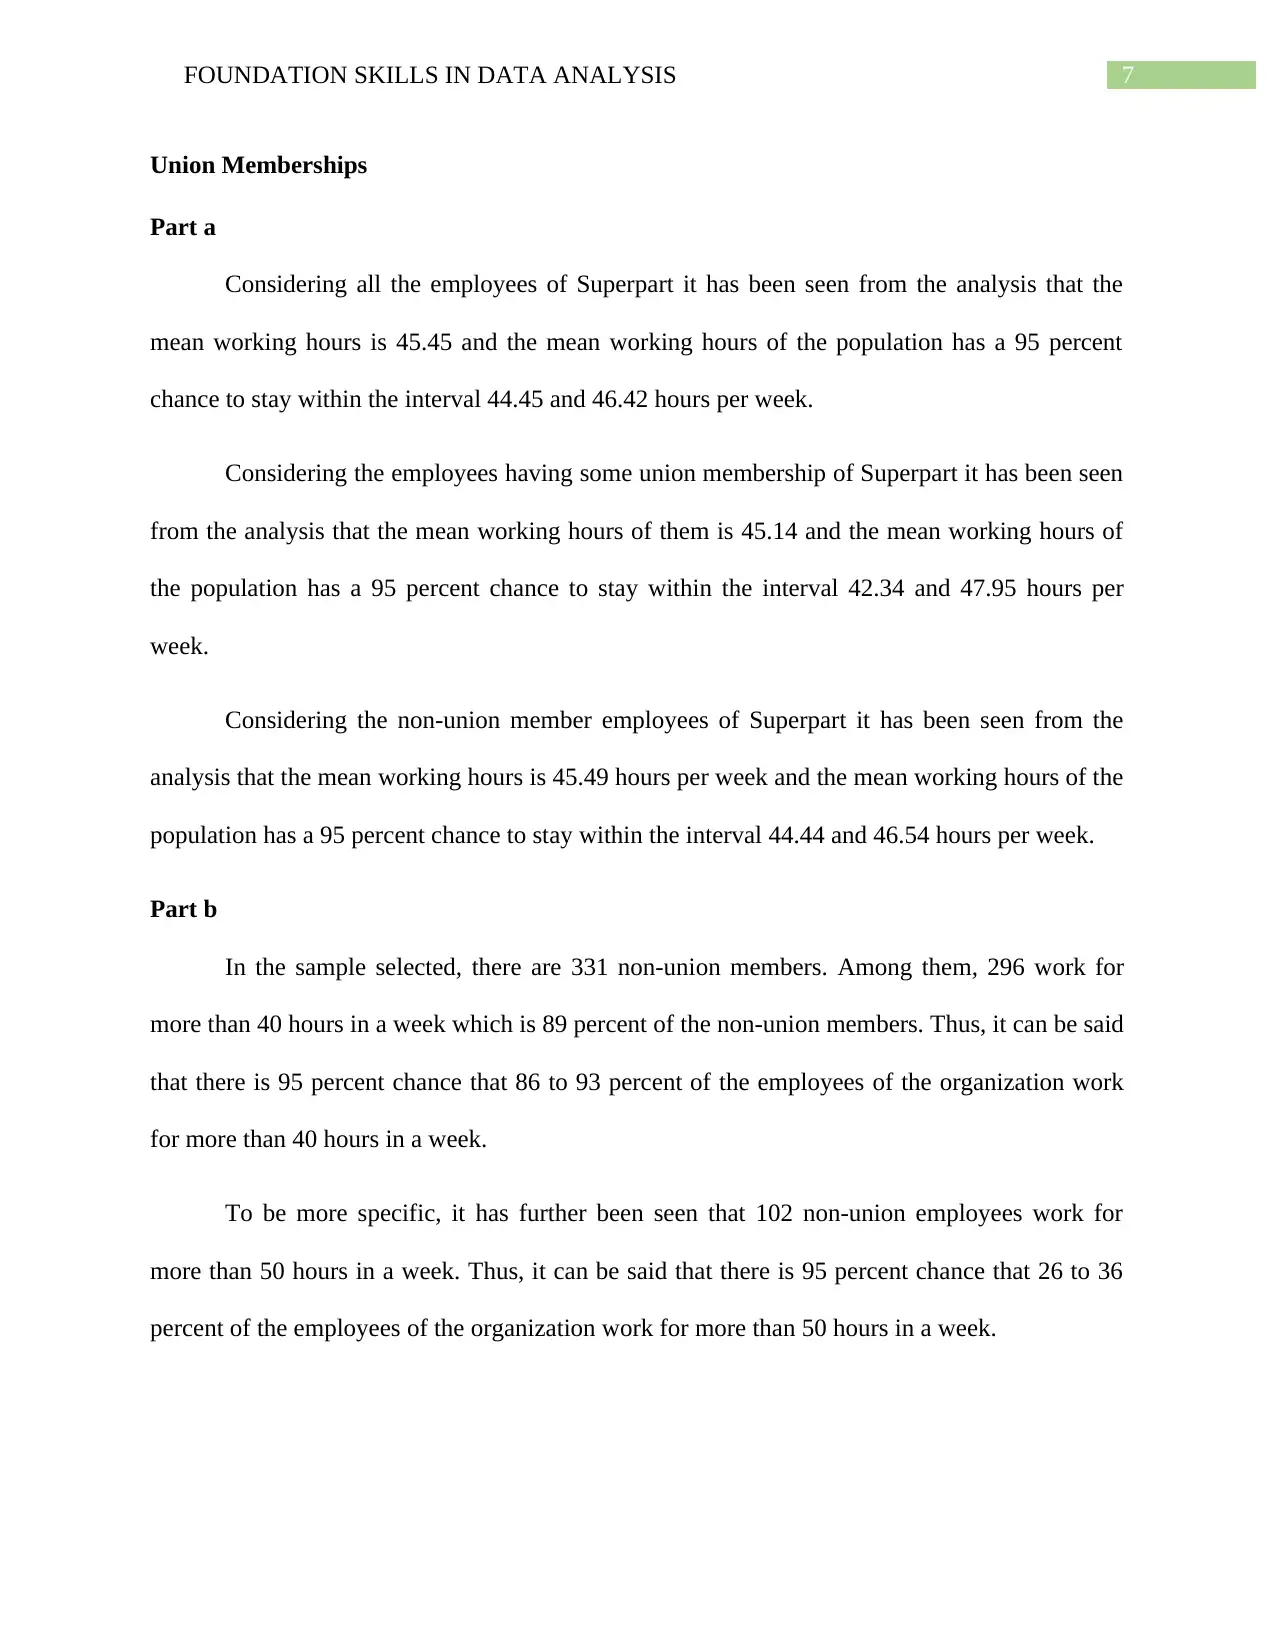
Considering all the employees of Superpart it has been seen from the analysis that the
mean working hours is 45.45 and the mean working hours of the population has a 95 percent
chance to stay within the interval 44.45 and 46.42 hours per week.
Considering the employees having some union membership of Superpart it has been seen
from the analysis that the mean working hours of them is 45.14 and the mean working hours of
the population has a 95 percent chance to stay within the interval 42.34 and 47.95 hours per
week.
Considering the non-union member employees of Superpart it has been seen from the
analysis that the mean working hours is 45.49 hours per week and the mean working hours of the
population has a 95 percent chance to stay within the interval 44.44 and 46.54 hours per week.
Part b
In the sample selected, there are 331 non-union members. Among them, 296 work for
more than 40 hours in a week which is 89 percent of the non-union members. Thus, it can be said
that there is 95 percent chance that 86 to 93 percent of the employees of the organization work
for more than 40 hours in a week.
To be more specific, it has further been seen that 102 non-union employees work for
more than 50 hours in a week. Thus, it can be said that there is 95 percent chance that 26 to 36
percent of the employees of the organization work for more than 50 hours in a week.
Union Memberships
Part a
Considering all the employees of Superpart it has been seen from the analysis that the
mean working hours is 45.45 and the mean working hours of the population has a 95 percent
chance to stay within the interval 44.45 and 46.42 hours per week.
Considering the employees having some union membership of Superpart it has been seen
from the analysis that the mean working hours of them is 45.14 and the mean working hours of
the population has a 95 percent chance to stay within the interval 42.34 and 47.95 hours per
week.
Considering the non-union member employees of Superpart it has been seen from the
analysis that the mean working hours is 45.49 hours per week and the mean working hours of the
population has a 95 percent chance to stay within the interval 44.44 and 46.54 hours per week.
Part b
In the sample selected, there are 331 non-union members. Among them, 296 work for
more than 40 hours in a week which is 89 percent of the non-union members. Thus, it can be said
that there is 95 percent chance that 86 to 93 percent of the employees of the organization work
for more than 40 hours in a week.
To be more specific, it has further been seen that 102 non-union employees work for
more than 50 hours in a week. Thus, it can be said that there is 95 percent chance that 26 to 36
percent of the employees of the organization work for more than 50 hours in a week.
8FOUNDATION SKILLS IN DATA ANALYSIS
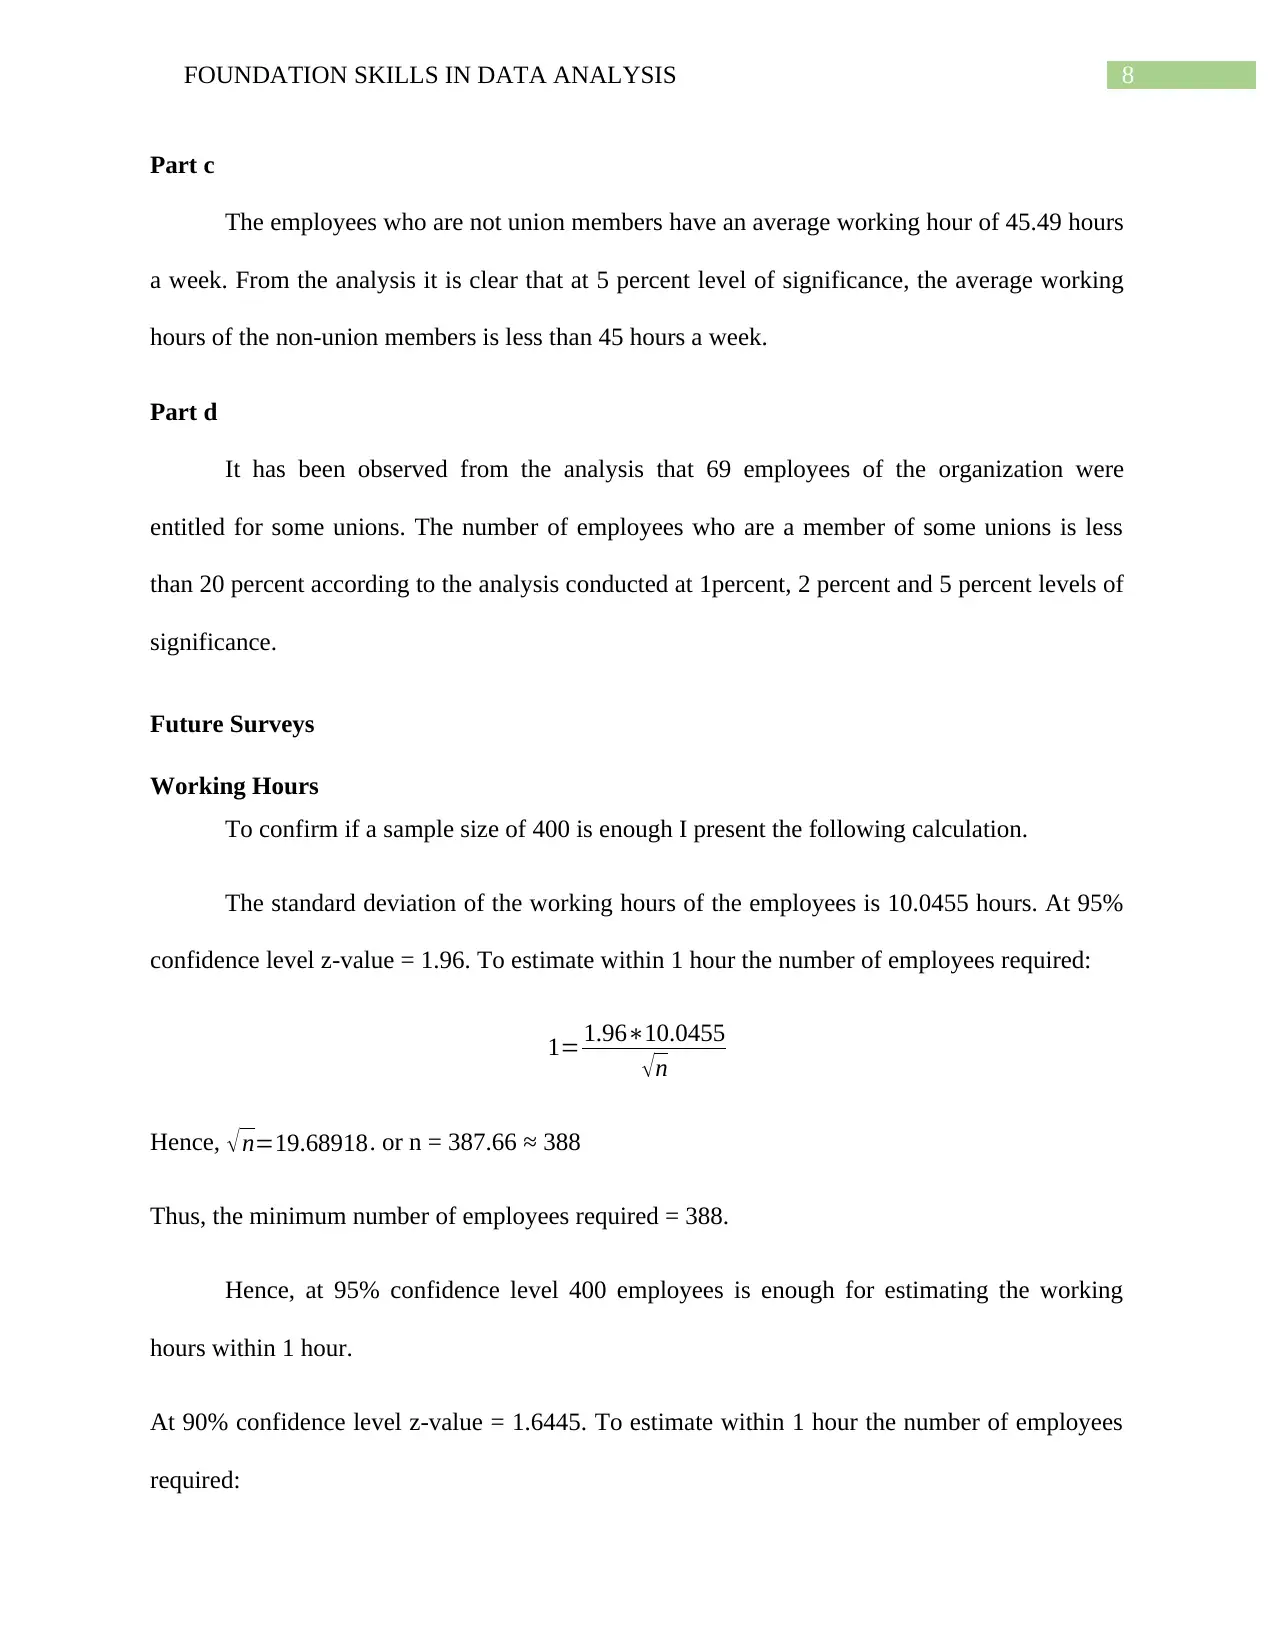
Part c
The employees who are not union members have an average working hour of 45.49 hours
a week. From the analysis it is clear that at 5 percent level of significance, the average working
hours of the non-union members is less than 45 hours a week.
Part d
It has been observed from the analysis that 69 employees of the organization were
entitled for some unions. The number of employees who are a member of some unions is less
than 20 percent according to the analysis conducted at 1percent, 2 percent and 5 percent levels of
significance.
Future Surveys
Working Hours
To confirm if a sample size of 400 is enough I present the following calculation.
The standard deviation of the working hours of the employees is 10.0455 hours. At 95%
confidence level z-value = 1.96. To estimate within 1 hour the number of employees required:
1= 1.96∗10.0455
√n
Hence, √ n=19.68918. or n = 387.66 ≈ 388
Thus, the minimum number of employees required = 388.
Hence, at 95% confidence level 400 employees is enough for estimating the working
hours within 1 hour.
At 90% confidence level z-value = 1.6445. To estimate within 1 hour the number of employees
required:
⊘ This is a preview!⊘
Do you want full access?
Subscribe today to unlock all pages.
Trusted by 1+ million students worldwide
9FOUNDATION SKILLS IN DATA ANALYSIS
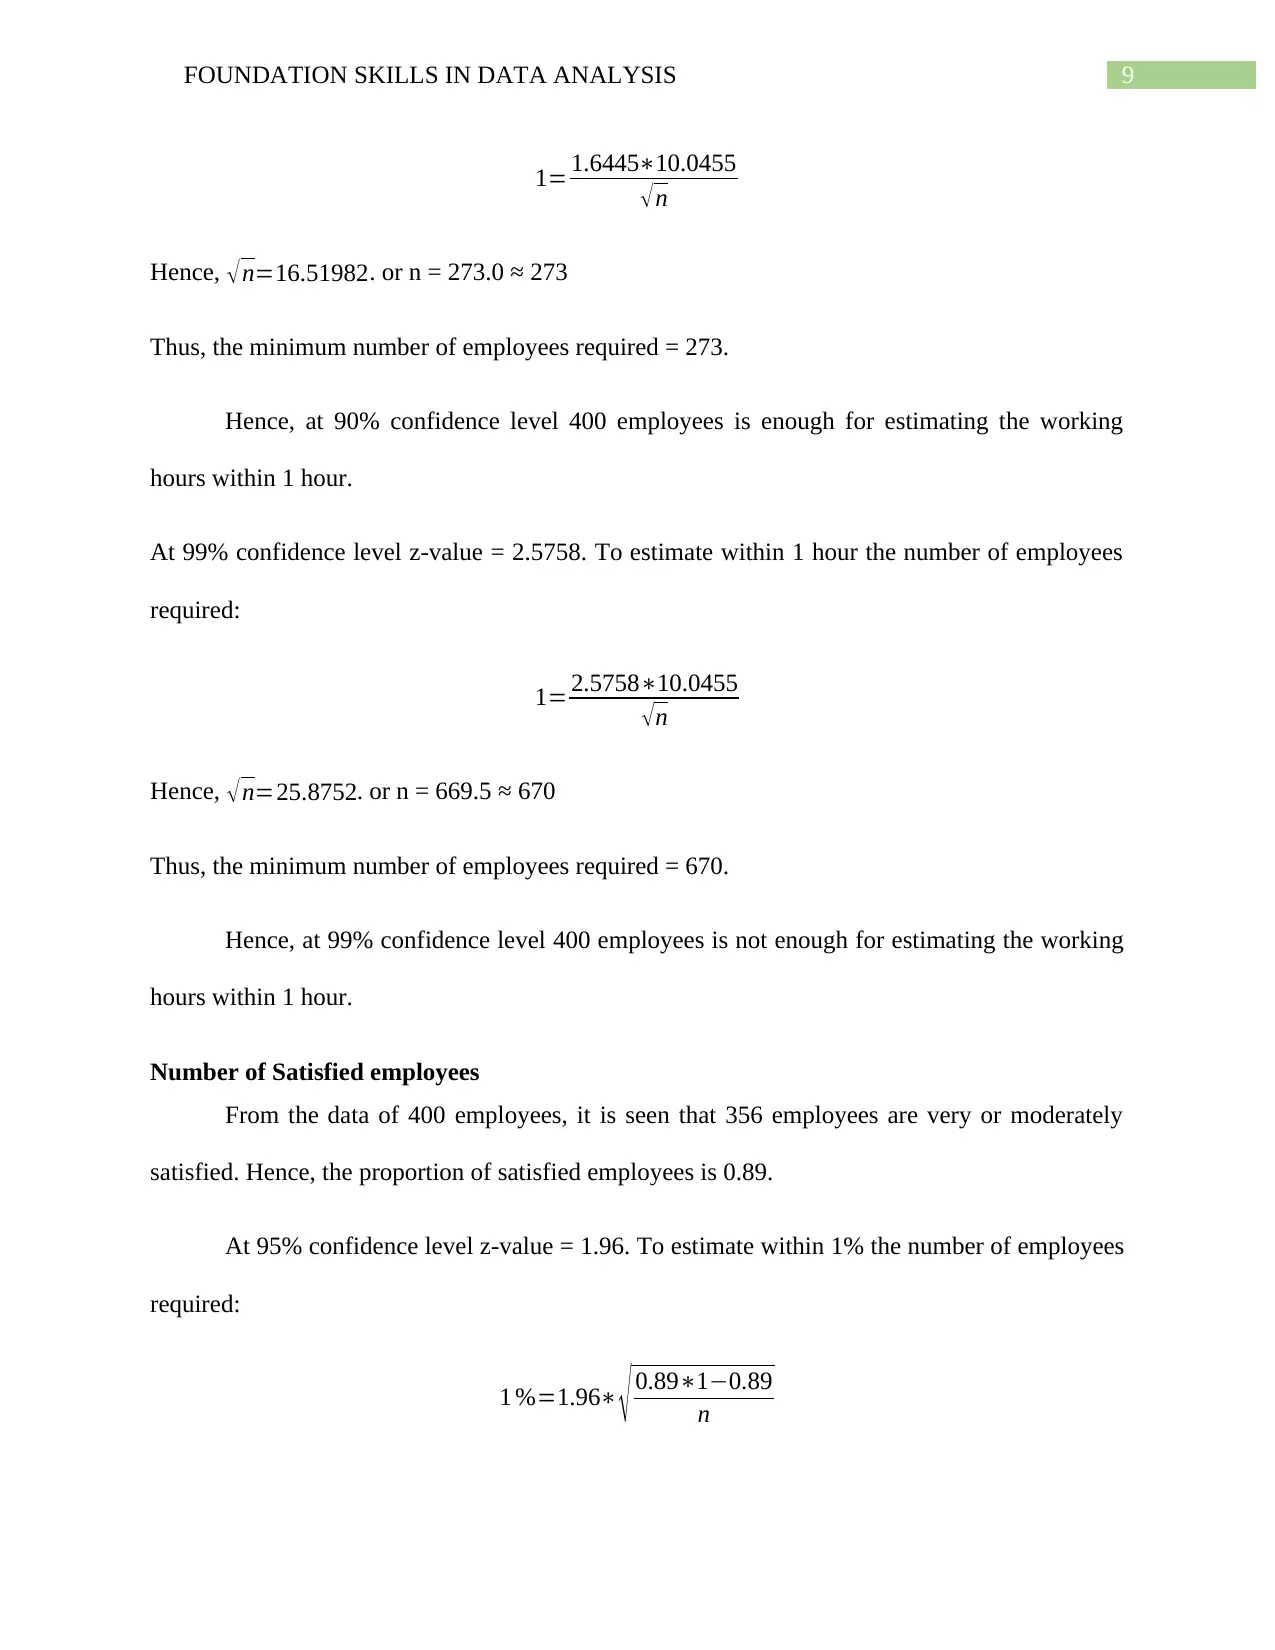
1= 1.6445∗10.0455
√ n
Hence, √n=16.51982. or n = 273.0 ≈ 273
Thus, the minimum number of employees required = 273.
Hence, at 90% confidence level 400 employees is enough for estimating the working
hours within 1 hour.
At 99% confidence level z-value = 2.5758. To estimate within 1 hour the number of employees
required:
1= 2.5758∗10.0455
√ n
Hence, √ n=25.8752. or n = 669.5 ≈ 670
Thus, the minimum number of employees required = 670.
Hence, at 99% confidence level 400 employees is not enough for estimating the working
hours within 1 hour.
Number of Satisfied employees
From the data of 400 employees, it is seen that 356 employees are very or moderately
satisfied. Hence, the proportion of satisfied employees is 0.89.
At 95% confidence level z-value = 1.96. To estimate within 1% the number of employees
required:
1 %=1.96∗ √ 0.89∗1−0.89
n
Paraphrase This Document
Need a fresh take? Get an instant paraphrase of this document with our AI Paraphraser
10FOUNDATION SKILLS IN DATA ANALYSIS
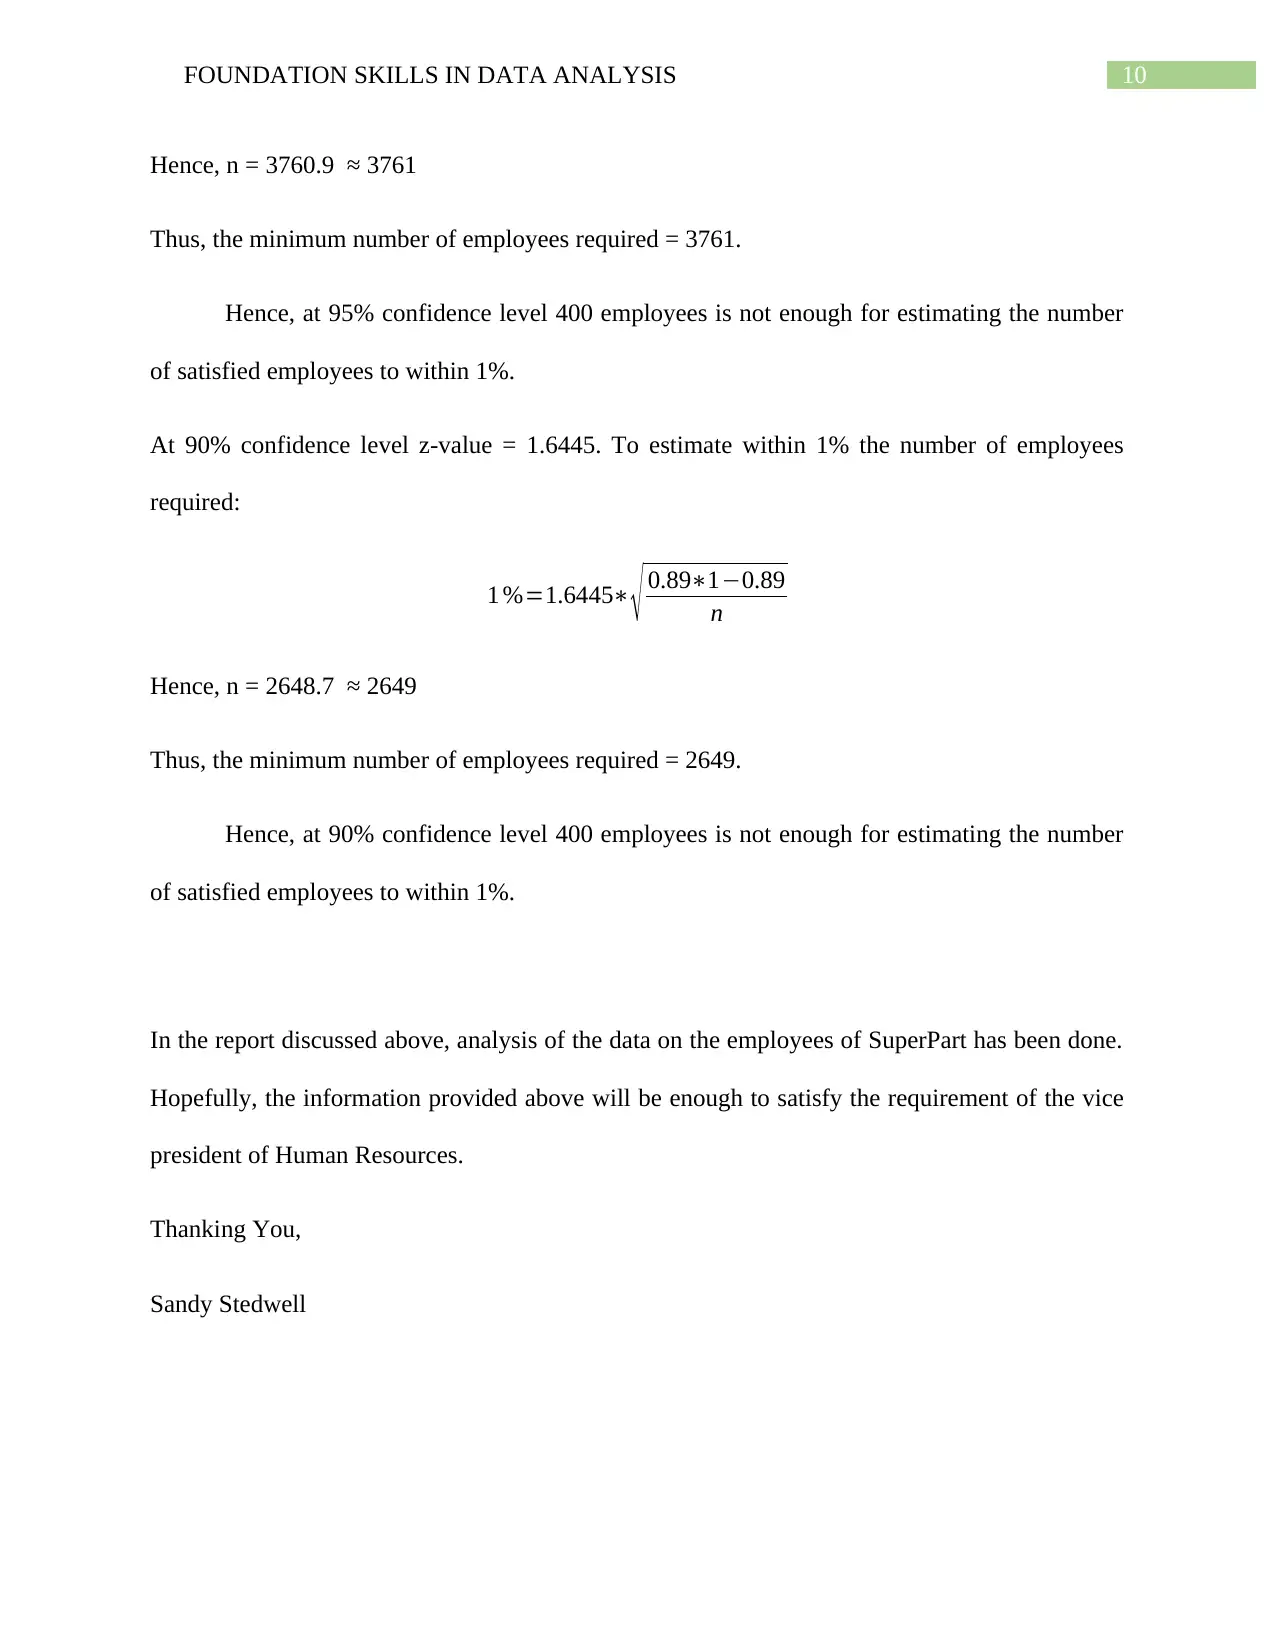
Hence, n = 3760.9 ≈ 3761
Thus, the minimum number of employees required = 3761.
Hence, at 95% confidence level 400 employees is not enough for estimating the number
of satisfied employees to within 1%.
At 90% confidence level z-value = 1.6445. To estimate within 1% the number of employees
required:
1 %=1.6445∗ √ 0.89∗1−0.89
n
Hence, n = 2648.7 ≈ 2649
Thus, the minimum number of employees required = 2649.
Hence, at 90% confidence level 400 employees is not enough for estimating the number
of satisfied employees to within 1%.
In the report discussed above, analysis of the data on the employees of SuperPart has been done.
Hopefully, the information provided above will be enough to satisfy the requirement of the vice
president of Human Resources.
Thanking You,
Sandy Stedwell
1 out of 11
Related Documents


Your All-in-One AI-Powered Toolkit for Academic Success.
+13062052269
info@desklib.com
Available 24*7 on WhatsApp / Email
![[object Object]](/_next/static/media/star-bottom.7253800d.svg)
Unlock your academic potential
Copyright © 2020–2026 A2Z Services. All Rights Reserved. Developed and managed by ZUCOL.