Supervised ML for Modeling Long-Distance Travel Mode Choice
VerifiedAdded on 2024/06/25
|12
|8704
|156
Report
AI Summary
This study explores the modeling of long-distance travel (LDT) mode choice between intercity buses and trains using supervised machine learning algorithms. A questionnaire survey was conducted in Bangladesh, considering factors like travel time, cost, comfort, safety, and reliability. Various machine learning models, including Random Forest, Naive Bayes, Support Vector Machine, and K-Nearest Neighbors, were employed to develop mode preference models. The Random Forest model achieved the highest accuracy (95.31%) and F1-score (0.95), indicating its superior performance. The findings suggest that intercity buses are generally preferred over trains for LDT in Bangladesh. The research contributes to understanding travel behavior in a low-income country and identifies key attributes influencing mode choice, offering valuable insights for transportation planning and policymaking. This document is available on Desklib, a platform offering a wealth of study resources for students.
See discussions, stats, and author profiles for this publication at: https://www.researchgate.net/publication/363667971
Modeling the Behavior in Choosing Travel Mode for Long-Distance Travel
Using Supervised Machine Learning Algorithms
Article in Communications · September 2022
DOI: 10.26552/com.C.2022.4.A187-A197
CITATIONS
2
READS
215
4 authors:
Khondhaker Al Momin
University of Oklahoma
20PUBLICATIONS99CITATIONS
SEE PROFILE
Saurav Barua
Daffodil International University
63PUBLICATIONS191CITATIONS
SEE PROFILE
Omar Faruqe Hamim
Purdue University
27PUBLICATIONS231CITATIONS
SEE PROFILE
Subrata Roy
University of Information Technology and Sciences
9 PUBLICATIONS7 CITATIONS
SEE PROFILE
All content following this page was uploaded by Khondhaker Al Momin on 20 September 2022.
The user has requested enhancement of the downloaded file.
Paraphrase This Document
Need a fresh take? Get an instant paraphrase of this document with our AI Paraphraser
© 2 0 2 2 U N I V E R S I T YO F Z I L I N A C O M M U N I C A T I O N S 2 4 ( 4 ) A 1 8 7 -A 1 9 7
O R I G I N A L R E S E A R C HA R T I C L E Operation and Economics in Transport A187
MODELING THE BEHAVIOR IN CHOOSING THE TRAVEL MODE
FOR LONG-DISTANCE TRAVEL USING SUPERVISED MACHINE
LEARNING ALGORITHMS
Khondhaker Al Momin1,
*, Saurav Barua1, Omar Faruqe Hamim2, Subrata Roy3
1
Department of Civil Engineering, Daffodil International University, Dhaka, Bangladesh
2
Department of Civil Engineering, Bangladesh University of Engineering and Technology, Dhaka, Bangladesh
3
Department of Civil Engineering, University of Information Technology and Sciences, Dhaka, Bangladesh
*E-mail of corresponding author: momin.ce@diu.edu.bd
Resume
The long-distance travel (LDT) mode choice modeling is important
for transportation planners. This study investigated alternative mode
choice behavior for the LDT between the intercity buses and trains.
A questionnaire survey, consisting of important mode choice attributes,
was conducted on various groups of people in Bangladesh. Numerous travel
mode choice contributing features (e.g., travel time, travel costs, origin-
destination, comfort, safety, travel time reliability, ticket availability and
schedule flexibility) were considered and the LDT mode choice models were
developed using various machine learning algorithms typically applied for
classification problems. With 95.31 % accuracy and 0.95 F1-score, Random
Forest model was the best performing model for the dataset. According to the
findings of this study, the intercity bus is preferred over the intercity train
for LDT in Bangladesh.
Article info
Received 23 May 2022
Accepted 2 August 2022
Online 8 September 2022
Keywords:
long distance travel
mode choice
supervised machine learning
intercity train
intercity bus
Available online: https://doi.org/10.26552/com.C.2022.4.A187-A197
ISSN 1335-4205 (print version)
ISSN 2585-7878 (online version)
This is an open access article distributed under the terms of the Creative Commons Attribution 4.0 International License (CC BY 4.0), which permits
use, distribution, and reproduction in any medium, provided the original publication is properly cited. No use, distribution or reproduction is permitted
which does not comply with these terms.
In travel behavior research, discrete choice models,
such as the multinomial logit model [7], are usually
used. According to Cheng et al. [8] machine learning
(ML) methods are a viable alternative to statistical
models to predict the mode preferences for traveling.
Many researchers have employed the ML techniques
to predict travel mode preference behavior in recent
years. However, differences can be identified between
ML and conventional statistical methodologies in terms
of understanding the data structure [9]. A logit model
presupposes the data structure using assumptions
regarding behavior and statistics, whereas many
popular ML methods are non-parametric, devoid of
theoretical assumptions about the underlying data
structure and rely on computers for analyzing the data
[10]. Hence, more flexible structures can be formed using
the ML algorithms to yield better predictive ability on
test samples. Several recent works in travel behavior
research have shown that ML models are outperforming
logit models in predictive capacity, especially in research
related to travel behavior [8-9, 11-13].
Preference for travel mode or modal split has been
studied over the past few decades for transportation
planning and policymaking. Mode choice depends on
1 Introduction
Understanding the causal variables is vital in
predicting the travel demand in the transportation
planning domain. Factors such as individual traits,
household type, security, comfort level, weather and
built environment affect a person’s travel mode choice
[1-3]. Two of the most competitive public transport modes
for the long-distance travel (LDT) within a country are
intercity train and intercity bus. Bus uses shared road
space with other vehicles on highways, whereas the
train uses exclusive right-of-way with high ridership
potential without occupying any road space [4]. Hence,
prioritizing the train services will lead to more efficient
use of land for transportation than bus services. On the
contrary, intercity buses provide more accessibility and
flexibility than intercity trains. Besides, construction,
operation and improvement of the bus service systems
are less expensive and time-consuming than the
intercity train systems [5]. It has been argued by Kampf
et. al. [6] that different modes of transport are essential
parts of a sustainable transport system. Therefore, there
is a need for research to assess peoples’ preferences
between intercity train and intercity bus services.
A188 M O M I N e t a l .
C O M M U N I C A T I O N S 4 / 2 0 2 2 V O L U M E 2 4
knowledge and activities at the cognitive level into mode
choice behavior; Tang et al. [26] discussed the travel
mode switching behavior of people who were only given
two options using DTs. On the other hand, Cheng et al.
[8] modeled the behavior in travel mode preference using
the RF algorithm. Instead of using logit model, travel
mode preference can be modeled using a classification
problem-based approach. Many researchers have argued
that ML classifiers can effectively model individual
travel behavior [8-9, 11, 13].
Across the world, many researchers have focused on
revealing different factors affecting the LDT. Moeckel
et al. [27] explained why it is important to predict
and understand the LDT mode in terms of vehicle
miles traveled, as well as looked at different logit and
combined choice models for proposing a new (modified
R 3 logit) nested multinomial logit model to predict LDT
mode for the state of North Carolina, USA. A study
conducted in Japan by Shen [28] found that the Latent
Class Model performed better than the Mixed Logit
Model when it came to choosing transport mode among
monorail, car and bus. Bok et al. [29] conducted an
empirical study for LDT in Portugal by car, train, or
bus. Similarly, many researchers for example Rohr et al.
[30] in the UK, MVA [31] in the Netherlands, De Jong
and Gunn [32] in Italy, Mandel et al. [33] in Germany
and RAVE [34] in Portugal, conducted studies regarding
the long-distance travel using different logit models.
Furthermore, Gasparik et al. [35] explored the technical
and non-technical obstacles to the operation of long-
distance rail services in the European Union.
In addition, ML classifiers have been found to
outperform conventional logit models in forecasting
the travel-mode preferences, e.g., RF classifier achieves
better accuracy in less computational time and with
less modeling effort than the multinomial logit model
(MNL) [12, 36]. ML models increase compatibility with
the empirical data by allowing flexible model structures,
whereas logit models work on a predetermined model
structure; thus, ML models perform better than logit
models in predicting mode preferences for travel [9, 37].
This is due to the fact that the logit model prioritizes the
estimation of the parameter to increase the predictive
precision of the model [38]. Wang and Ross [39] compared
the performance between extreme gradient boosting
(XGB) and the MNL model in predicting travel mode
choice and found that in overall, the XGB model is better
at making predictions than the MNL model, especially
when the data set is not extremely unbalanced. Omrani
[40] applied four ML methods (neural net-RBF, neural
net-MLP, multinomial logistic regression and SVM) to
predict how people in Luxembourg will choose to travel
and found that the ML methods perform better.
Despite showing a significant overall model fit, the
mixed logit model was found to have worse prediction
accuracy than the simpler multinomial logit model [41].
According to Mullainathan and Spiess [38], although the
ML approaches yield better predictive accuracy, these are
several features, such as time required for travel, travel
expenses, level of comfort, safety, convenience and so
on [14-15]. Each feature has underlying relation with
the mode choice model individually and in combination.
The mode choice model varies with demographics,
socioeconomic and geographic conditions. Two of the
most significant factors in choosing among available
alternative travel modes are found to be the adequacy
of transportation infrastructure and level of service [16].
The LDT differs from short-distance daily travel in
various aspects. According to the European DATELINE
study [17], the LDT is defined as trips that cover
100 kilometers or more, whereas the US Bureau of
Transportation Statistics [18] defines LDT as trips
greater or equal to 50 miles (83.33 kilometers) travel
from the origin. Though few prior pieces of literature
have been found to distinguish clearly between the
different features and aspects of LDT than short-
distance travel, it is apparent that people used to make
a distinctive choice for both cases. Short-distance travels
are typically work trips, non-work trips, shopping trips
which are most frequent, whereas the LDT is mostly
infrequent and subjected to non-work trips and vacation
trips.
Several studies performed nested logit model [19],
structured equation model [20], neural network [21],
decision tree (DT) [10] and random forest (RF) algorithm
[8, 12, 22] to understand modal split behavior. Each
of the models has its pros and cons. This research
aimed to use popular supervised ML algorithms. used
for classification problems such as Naive Bayes (NB),
Support Vector Machine (SVM), K-Nearest Neighbors
(KNN), RF and DT models, to develop a mode preference
model for LDT, using stated preference survey data.
Further, the attributes important in predicting
the travel mode preference have been identified by
investigating the users’ LDT mode choice behavior using
the best-performing ML-based classification method in
the context of Dhaka, the capital city of Bangladesh.
According to the authors’ knowledge, none has performed
such study for modeling the LDT mode choice using ML
approaches in a low-income country like Bangladesh.
2 Literature review
The growing challenge of increasing demand for
travel, safety concerns, energy exhaustion, emission
of deadly gases and environmental deterioration
has prompted transportation engineers to adopt ML
techniques to solve these dynamic problems [23]. The
ML is an assemblage of methodologies or algorithms
that allow computers to program the development
of the data-driven model by detecting patterns in
statistically significant data [24]. Recently, a variety of
ML approaches have been employed for modeling the
travel mode choice. Using artificial neural networks,
Pulugurta et al. [25] were able to incorporate human
⊘ This is a preview!⊘
Do you want full access?
Subscribe today to unlock all pages.
Trusted by 1+ million students worldwide
M O D E L I N G T H E B E H A V I O R I N C H O O S I N G T H E T R A V E LM O D E F O R L O N G -D I S T A N C E T R A V E L .. . A189
V O L U M E 2 4 C O M M U N I C A T I O N S 4 / 2 0 2 2
railway stations. The questionnaire survey is designed
with close-ended multiple-choice questions containing
two segments. The questions in the questionnaire have
been adapted from similar research [45-46] performed to
model travel mode choice for the LDT.
The first part of the questionnaire includes general
questions regarding route traveling, frequency of travel
and demographic information such as gender and
income level. The second portion asks about travel
mode preference and various features related to mode
choice, e.g., the time required for travel, i.e., travel time,
expenses incurred for travel, i.e., travel costs, comfort
during journey, safety, reliability of journey time, stop or
station closer (proximity) to destination, stop or station
closer (proximity) to origin, availability of tickets and
flexible schedule. The respondents were asked to choose
between intercity train and intercity bus mode for LDT
in the questions related to each of the features.
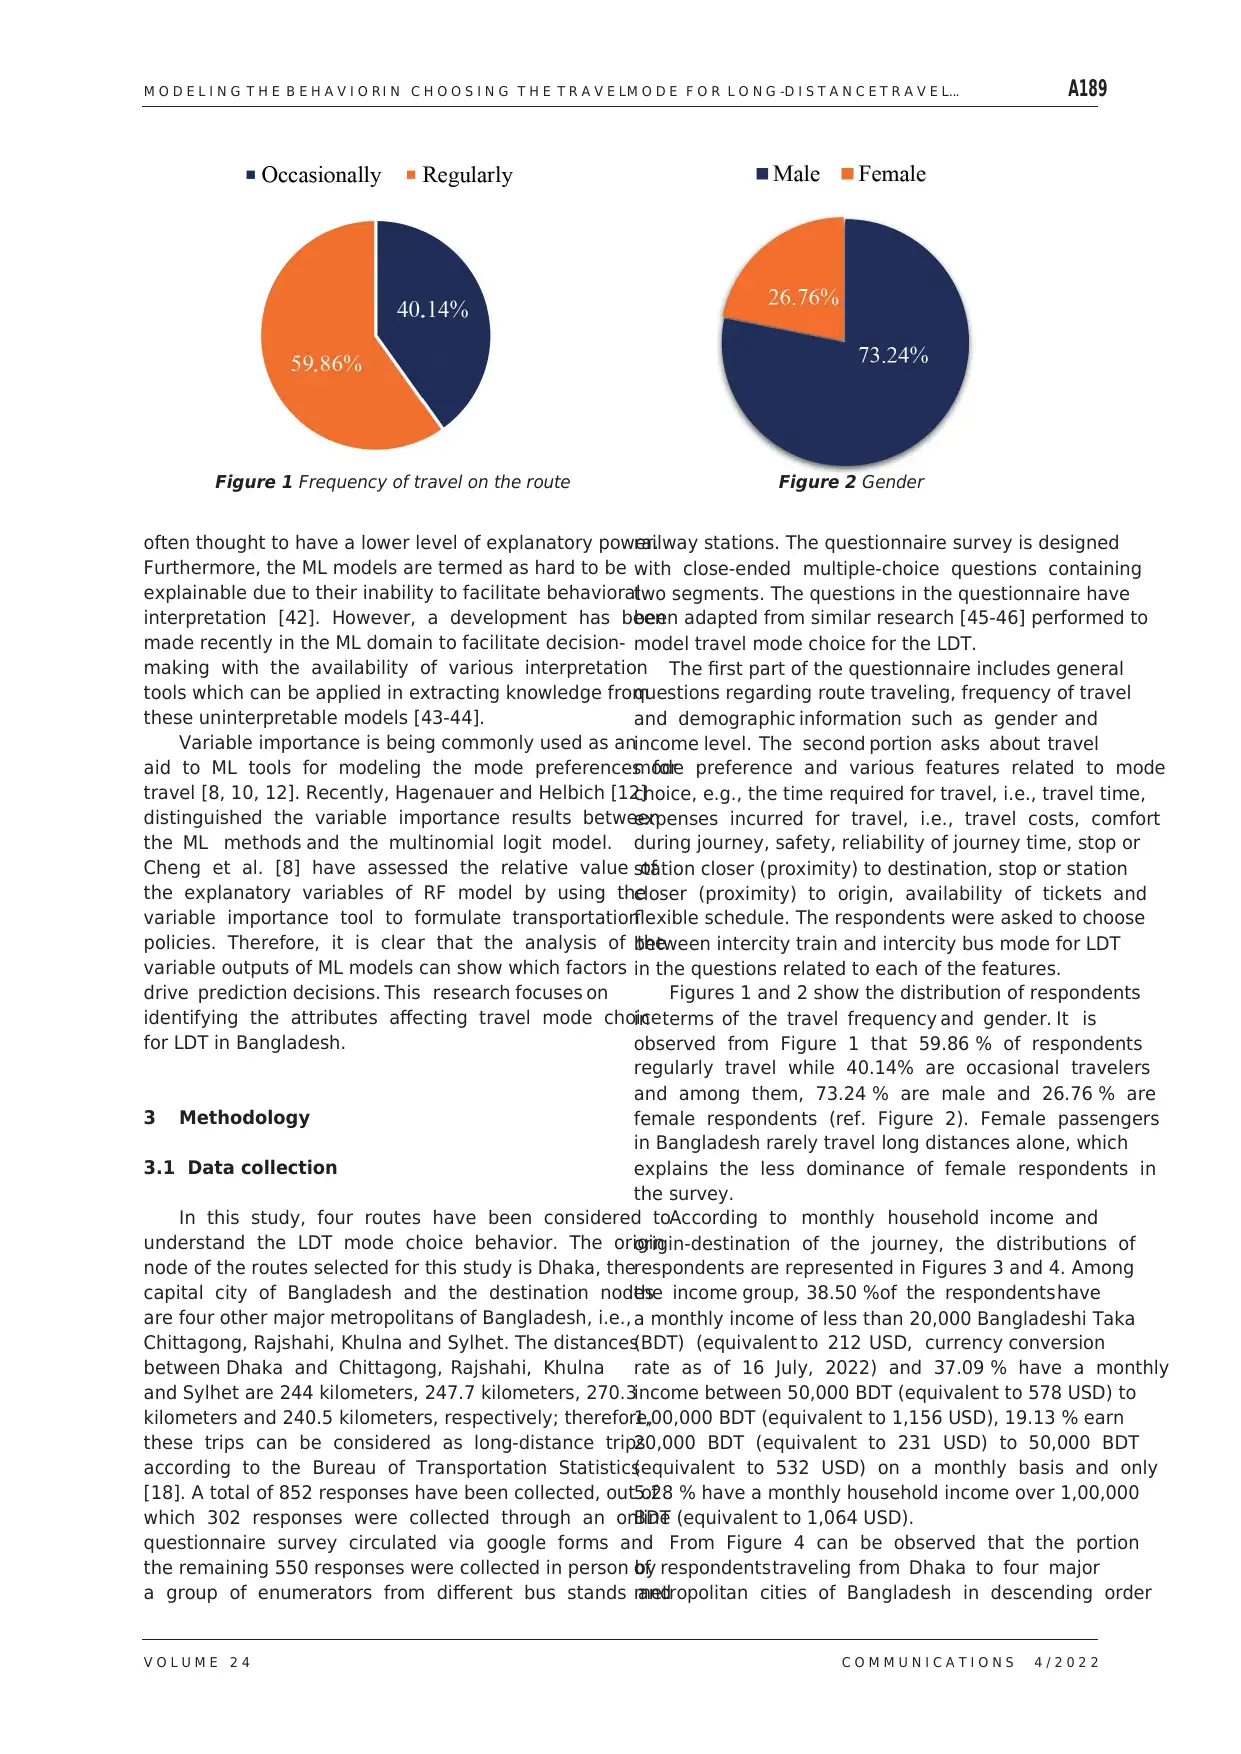
Figures 1 and 2 show the distribution of respondents
in terms of the travel frequency and gender. It is
observed from Figure 1 that 59.86 % of respondents
regularly travel while 40.14% are occasional travelers
and among them, 73.24 % are male and 26.76 % are
female respondents (ref. Figure 2). Female passengers
in Bangladesh rarely travel long distances alone, which
explains the less dominance of female respondents in
the survey.
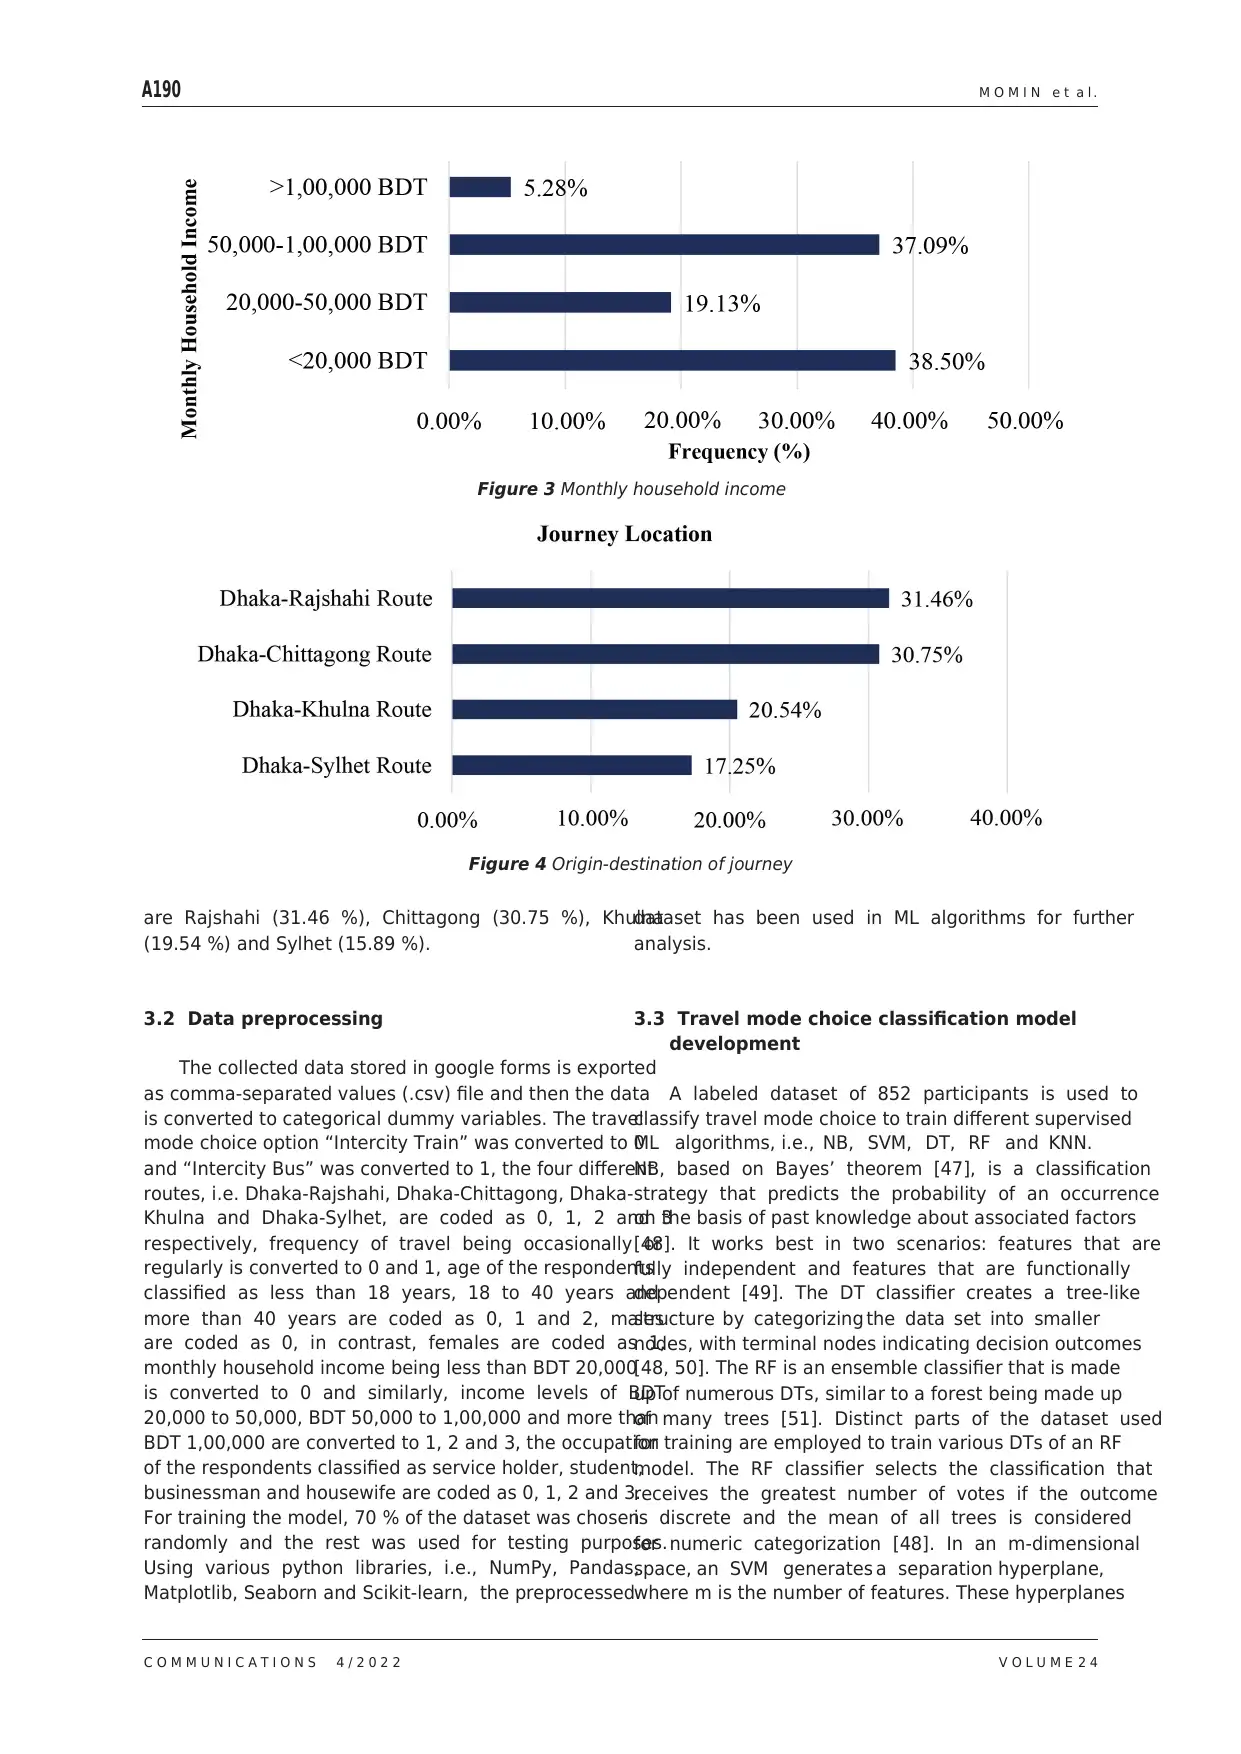
According to monthly household income and
origin-destination of the journey, the distributions of
respondents are represented in Figures 3 and 4. Among
the income group, 38.50 %of the respondents have
a monthly income of less than 20,000 Bangladeshi Taka
(BDT) (equivalent to 212 USD, currency conversion
rate as of 16 July, 2022) and 37.09 % have a monthly
income between 50,000 BDT (equivalent to 578 USD) to
1,00,000 BDT (equivalent to 1,156 USD), 19.13 % earn
20,000 BDT (equivalent to 231 USD) to 50,000 BDT
(equivalent to 532 USD) on a monthly basis and only
5.28 % have a monthly household income over 1,00,000
BDT (equivalent to 1,064 USD).
From Figure 4 can be observed that the portion
of respondents traveling from Dhaka to four major
metropolitan cities of Bangladesh in descending order
often thought to have a lower level of explanatory power.
Furthermore, the ML models are termed as hard to be
explainable due to their inability to facilitate behavioral
interpretation [42]. However, a development has been
made recently in the ML domain to facilitate decision-
making with the availability of various interpretation
tools which can be applied in extracting knowledge from
these uninterpretable models [43-44].
Variable importance is being commonly used as an
aid to ML tools for modeling the mode preferences for
travel [8, 10, 12]. Recently, Hagenauer and Helbich [12]
distinguished the variable importance results between
the ML methods and the multinomial logit model.
Cheng et al. [8] have assessed the relative value of
the explanatory variables of RF model by using the
variable importance tool to formulate transportation
policies. Therefore, it is clear that the analysis of the
variable outputs of ML models can show which factors
drive prediction decisions. This research focuses on
identifying the attributes affecting travel mode choice
for LDT in Bangladesh.
3 Methodology
3.1 Data collection
In this study, four routes have been considered to
understand the LDT mode choice behavior. The origin
node of the routes selected for this study is Dhaka, the
capital city of Bangladesh and the destination nodes
are four other major metropolitans of Bangladesh, i.e.,
Chittagong, Rajshahi, Khulna and Sylhet. The distances
between Dhaka and Chittagong, Rajshahi, Khulna
and Sylhet are 244 kilometers, 247.7 kilometers, 270.3
kilometers and 240.5 kilometers, respectively; therefore,
these trips can be considered as long-distance trips
according to the Bureau of Transportation Statistics
[18]. A total of 852 responses have been collected, out of
which 302 responses were collected through an online
questionnaire survey circulated via google forms and
the remaining 550 responses were collected in person by
a group of enumerators from different bus stands and
Figure 1 Frequency of travel on the route Figure 2 Gender
V O L U M E 2 4 C O M M U N I C A T I O N S 4 / 2 0 2 2
railway stations. The questionnaire survey is designed
with close-ended multiple-choice questions containing
two segments. The questions in the questionnaire have
been adapted from similar research [45-46] performed to
model travel mode choice for the LDT.
The first part of the questionnaire includes general
questions regarding route traveling, frequency of travel
and demographic information such as gender and
income level. The second portion asks about travel
mode preference and various features related to mode
choice, e.g., the time required for travel, i.e., travel time,
expenses incurred for travel, i.e., travel costs, comfort
during journey, safety, reliability of journey time, stop or
station closer (proximity) to destination, stop or station
closer (proximity) to origin, availability of tickets and
flexible schedule. The respondents were asked to choose
between intercity train and intercity bus mode for LDT
in the questions related to each of the features.
Figures 1 and 2 show the distribution of respondents
in terms of the travel frequency and gender. It is
observed from Figure 1 that 59.86 % of respondents
regularly travel while 40.14% are occasional travelers
and among them, 73.24 % are male and 26.76 % are
female respondents (ref. Figure 2). Female passengers
in Bangladesh rarely travel long distances alone, which
explains the less dominance of female respondents in
the survey.
According to monthly household income and
origin-destination of the journey, the distributions of
respondents are represented in Figures 3 and 4. Among
the income group, 38.50 %of the respondents have
a monthly income of less than 20,000 Bangladeshi Taka
(BDT) (equivalent to 212 USD, currency conversion
rate as of 16 July, 2022) and 37.09 % have a monthly
income between 50,000 BDT (equivalent to 578 USD) to
1,00,000 BDT (equivalent to 1,156 USD), 19.13 % earn
20,000 BDT (equivalent to 231 USD) to 50,000 BDT
(equivalent to 532 USD) on a monthly basis and only
5.28 % have a monthly household income over 1,00,000
BDT (equivalent to 1,064 USD).
From Figure 4 can be observed that the portion
of respondents traveling from Dhaka to four major
metropolitan cities of Bangladesh in descending order
often thought to have a lower level of explanatory power.
Furthermore, the ML models are termed as hard to be
explainable due to their inability to facilitate behavioral
interpretation [42]. However, a development has been
made recently in the ML domain to facilitate decision-
making with the availability of various interpretation
tools which can be applied in extracting knowledge from
these uninterpretable models [43-44].
Variable importance is being commonly used as an
aid to ML tools for modeling the mode preferences for
travel [8, 10, 12]. Recently, Hagenauer and Helbich [12]
distinguished the variable importance results between
the ML methods and the multinomial logit model.
Cheng et al. [8] have assessed the relative value of
the explanatory variables of RF model by using the
variable importance tool to formulate transportation
policies. Therefore, it is clear that the analysis of the
variable outputs of ML models can show which factors
drive prediction decisions. This research focuses on
identifying the attributes affecting travel mode choice
for LDT in Bangladesh.
3 Methodology
3.1 Data collection
In this study, four routes have been considered to
understand the LDT mode choice behavior. The origin
node of the routes selected for this study is Dhaka, the
capital city of Bangladesh and the destination nodes
are four other major metropolitans of Bangladesh, i.e.,
Chittagong, Rajshahi, Khulna and Sylhet. The distances
between Dhaka and Chittagong, Rajshahi, Khulna
and Sylhet are 244 kilometers, 247.7 kilometers, 270.3
kilometers and 240.5 kilometers, respectively; therefore,
these trips can be considered as long-distance trips
according to the Bureau of Transportation Statistics
[18]. A total of 852 responses have been collected, out of
which 302 responses were collected through an online
questionnaire survey circulated via google forms and
the remaining 550 responses were collected in person by
a group of enumerators from different bus stands and
Figure 1 Frequency of travel on the route Figure 2 Gender
Paraphrase This Document
Need a fresh take? Get an instant paraphrase of this document with our AI Paraphraser
A190 M O M I N e t a l .
C O M M U N I C A T I O N S 4 / 2 0 2 2 V O L U M E 2 4
dataset has been used in ML algorithms for further
analysis.
3.3 Travel mode choice classification model
development
A labeled dataset of 852 participants is used to
classify travel mode choice to train different supervised
ML algorithms, i.e., NB, SVM, DT, RF and KNN.
NB, based on Bayes’ theorem [47], is a classification
strategy that predicts the probability of an occurrence
on the basis of past knowledge about associated factors
[48]. It works best in two scenarios: features that are
fully independent and features that are functionally
dependent [49]. The DT classifier creates a tree-like
structure by categorizing the data set into smaller
nodes, with terminal nodes indicating decision outcomes
[48, 50]. The RF is an ensemble classifier that is made
up of numerous DTs, similar to a forest being made up
of many trees [51]. Distinct parts of the dataset used
for training are employed to train various DTs of an RF
model. The RF classifier selects the classification that
receives the greatest number of votes if the outcome
is discrete and the mean of all trees is considered
for numeric categorization [48]. In an m-dimensional
space, an SVM generates a separation hyperplane,
where m is the number of features. These hyperplanes
are Rajshahi (31.46 %), Chittagong (30.75 %), Khulna
(19.54 %) and Sylhet (15.89 %).
3.2 Data preprocessing
The collected data stored in google forms is exported
as comma-separated values (.csv) file and then the data
is converted to categorical dummy variables. The travel
mode choice option “Intercity Train” was converted to 0
and “Intercity Bus” was converted to 1, the four different
routes, i.e. Dhaka-Rajshahi, Dhaka-Chittagong, Dhaka-
Khulna and Dhaka-Sylhet, are coded as 0, 1, 2 and 3
respectively, frequency of travel being occasionally or
regularly is converted to 0 and 1, age of the respondents
classified as less than 18 years, 18 to 40 years and
more than 40 years are coded as 0, 1 and 2, males
are coded as 0, in contrast, females are coded as 1,
monthly household income being less than BDT 20,000
is converted to 0 and similarly, income levels of BDT
20,000 to 50,000, BDT 50,000 to 1,00,000 and more than
BDT 1,00,000 are converted to 1, 2 and 3, the occupation
of the respondents classified as service holder, student,
businessman and housewife are coded as 0, 1, 2 and 3.
For training the model, 70 % of the dataset was chosen
randomly and the rest was used for testing purposes.
Using various python libraries, i.e., NumPy, Pandas,
Matplotlib, Seaborn and Scikit-learn, the preprocessed
Figure 3 Monthly household income
Figure 4 Origin-destination of journey
M O D E L I N G T H E B E H A V I O R I N C H O O S I N G T H E T R A V E LM O D E F O R L O N G -D I S T A N C E T R A V E L .. . A191
V O L U M E 2 4 C O M M U N I C A T I O N S 4 / 2 0 2 2
preferred to travel by train. More people choose to travel
by bus than by train as it takes less time for travel and
gives more reliable journey time, safety, availability of
tickets, flexible travel schedules, proximity of stations
to origin and destination. On the other side, in terms
of less travel costs and comfort, traveling by train is
preferred compared to traveling by bus. It is evident from
this analysis that both modes have some advantages
and disadvantages corresponding to different factors
associated with LDT.
4.2 Mode choice classification models
A variety of supervised ML algorithms have been
used to classify the preferencesfor the LDT mode
choice. The accuracy and F1-score achieved by different
methods are depicted in Table 1. It shows that the RF
classifier produces the highest accuracy and F1-score
among all of the methods tested. Hence, the RF classifier
is selected as the best method for classifying mode
choice preferences for LDT considering the F1-score
and accuracy achieved in the testing dataset. Besides
that, the RF method can determine out-of-bag accuracy
by measuring the average prediction accuracy obtained
from the trees whose samples are not considered in the
bootstrap sample. Therefore, the over-fitting problem
can be detected by observing the out-of-bag accuracy.
The out-of-bag accuracy of RF classifier was found to
be 93.12 % which is very high, so it is evident that the
model does not suffer from an over-fitting problem.
Table 1 shows that the accuracy and F1-scores of
various algorithms are very close and Grandini et al.
[54] showed that the accuracy and F1-score might be the
same in some cases.
Furthermore, a random search cross-validation
technique has been utilized to discover the optimum
hyperparameters for refining the RF model’s performance
in order to improve its accuracy. From a grid of a range of
function as decision boundaries for classifying both
linear and non-linear data points. All the data are first
mapped onto an m-dimensional feature space, then the
SVM determines the separation hyperplane having the
maximum margin with minimum classification errors
[48, 52]. The KNN algorithm is a simplified form of the
NB classifier where probability values are not required
[48, 53]. The letter K in the KNN stands for the number
of nearest neighbors who are regarded to be eligible
to receive a ‘vote’ from the algorithm. In some cases,
differing values for the variable K can result in different
categorization results for the same datasets.
To evaluate which model is the best suited to
the datasets used in this study, the accuracy and
F1-score of each model are compared to one another.
The hyperparameters of the model achieving the
highest accuracy and F1-score are tuned to obtain an
optimized model. Furthermore, the receiver operating
characteristic (ROC) curve, F1-score, confusion matrix,
precision, recall and area under the curve (AUC) of
the selected ML model are all examined to evaluate its
overall performance. Additionally, variable importance
scores are computed to identify the most significant
factors in predicting the travel mode choice.
4 Results
4.1 Mode choice preferences
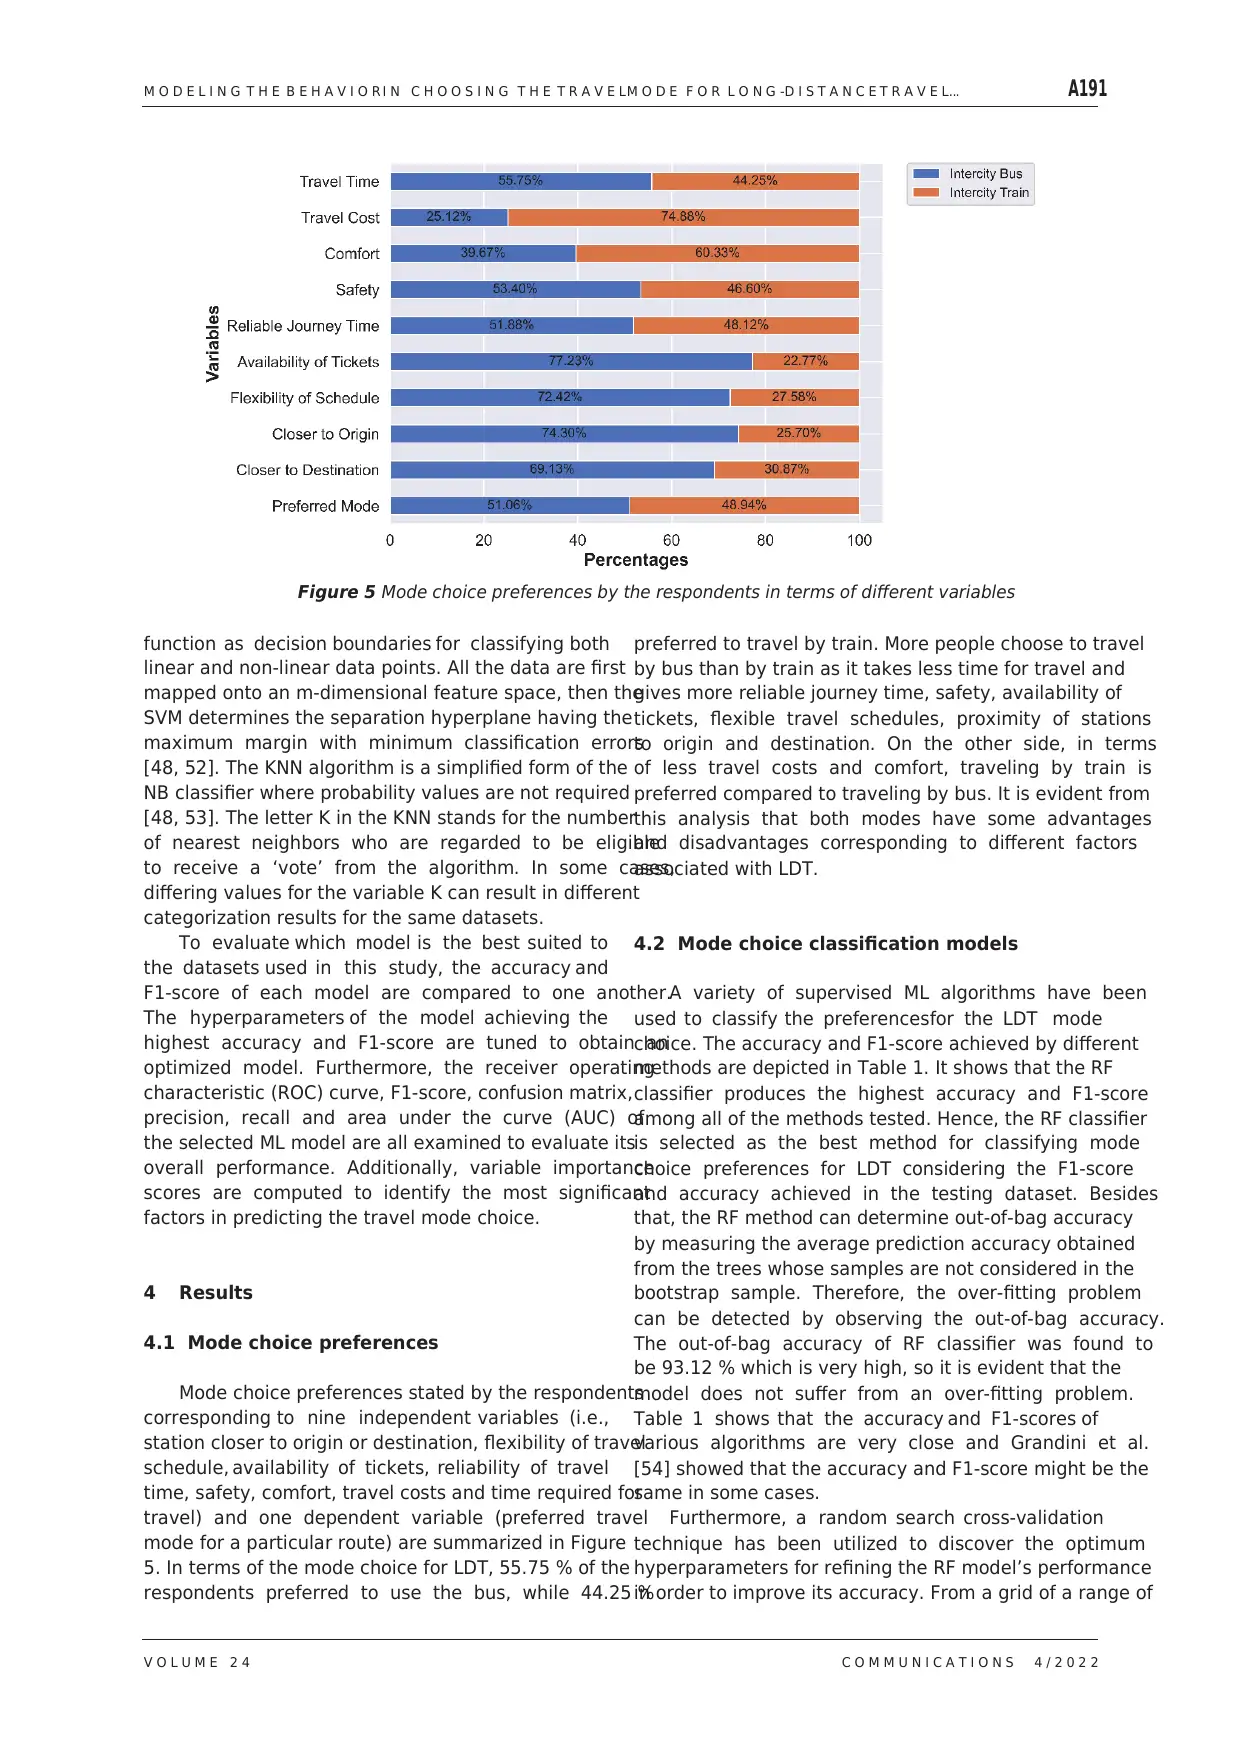
Mode choice preferences stated by the respondents
corresponding to nine independent variables (i.e.,
station closer to origin or destination, flexibility of travel
schedule, availability of tickets, reliability of travel
time, safety, comfort, travel costs and time required for
travel) and one dependent variable (preferred travel
mode for a particular route) are summarized in Figure
5. In terms of the mode choice for LDT, 55.75 % of the
respondents preferred to use the bus, while 44.25 %
Figure 5 Mode choice preferences by the respondents in terms of different variables
V O L U M E 2 4 C O M M U N I C A T I O N S 4 / 2 0 2 2
preferred to travel by train. More people choose to travel
by bus than by train as it takes less time for travel and
gives more reliable journey time, safety, availability of
tickets, flexible travel schedules, proximity of stations
to origin and destination. On the other side, in terms
of less travel costs and comfort, traveling by train is
preferred compared to traveling by bus. It is evident from
this analysis that both modes have some advantages
and disadvantages corresponding to different factors
associated with LDT.
4.2 Mode choice classification models
A variety of supervised ML algorithms have been
used to classify the preferencesfor the LDT mode
choice. The accuracy and F1-score achieved by different
methods are depicted in Table 1. It shows that the RF
classifier produces the highest accuracy and F1-score
among all of the methods tested. Hence, the RF classifier
is selected as the best method for classifying mode
choice preferences for LDT considering the F1-score
and accuracy achieved in the testing dataset. Besides
that, the RF method can determine out-of-bag accuracy
by measuring the average prediction accuracy obtained
from the trees whose samples are not considered in the
bootstrap sample. Therefore, the over-fitting problem
can be detected by observing the out-of-bag accuracy.
The out-of-bag accuracy of RF classifier was found to
be 93.12 % which is very high, so it is evident that the
model does not suffer from an over-fitting problem.
Table 1 shows that the accuracy and F1-scores of
various algorithms are very close and Grandini et al.
[54] showed that the accuracy and F1-score might be the
same in some cases.
Furthermore, a random search cross-validation
technique has been utilized to discover the optimum
hyperparameters for refining the RF model’s performance
in order to improve its accuracy. From a grid of a range of
function as decision boundaries for classifying both
linear and non-linear data points. All the data are first
mapped onto an m-dimensional feature space, then the
SVM determines the separation hyperplane having the
maximum margin with minimum classification errors
[48, 52]. The KNN algorithm is a simplified form of the
NB classifier where probability values are not required
[48, 53]. The letter K in the KNN stands for the number
of nearest neighbors who are regarded to be eligible
to receive a ‘vote’ from the algorithm. In some cases,
differing values for the variable K can result in different
categorization results for the same datasets.
To evaluate which model is the best suited to
the datasets used in this study, the accuracy and
F1-score of each model are compared to one another.
The hyperparameters of the model achieving the
highest accuracy and F1-score are tuned to obtain an
optimized model. Furthermore, the receiver operating
characteristic (ROC) curve, F1-score, confusion matrix,
precision, recall and area under the curve (AUC) of
the selected ML model are all examined to evaluate its
overall performance. Additionally, variable importance
scores are computed to identify the most significant
factors in predicting the travel mode choice.
4 Results
4.1 Mode choice preferences
Mode choice preferences stated by the respondents
corresponding to nine independent variables (i.e.,
station closer to origin or destination, flexibility of travel
schedule, availability of tickets, reliability of travel
time, safety, comfort, travel costs and time required for
travel) and one dependent variable (preferred travel
mode for a particular route) are summarized in Figure
5. In terms of the mode choice for LDT, 55.75 % of the
respondents preferred to use the bus, while 44.25 %
Figure 5 Mode choice preferences by the respondents in terms of different variables
⊘ This is a preview!⊘
Do you want full access?
Subscribe today to unlock all pages.
Trusted by 1+ million students worldwide
A192 M O M I N e t a l .
C O M M U N I C A T I O N S 4 / 2 0 2 2 V O L U M E 2 4
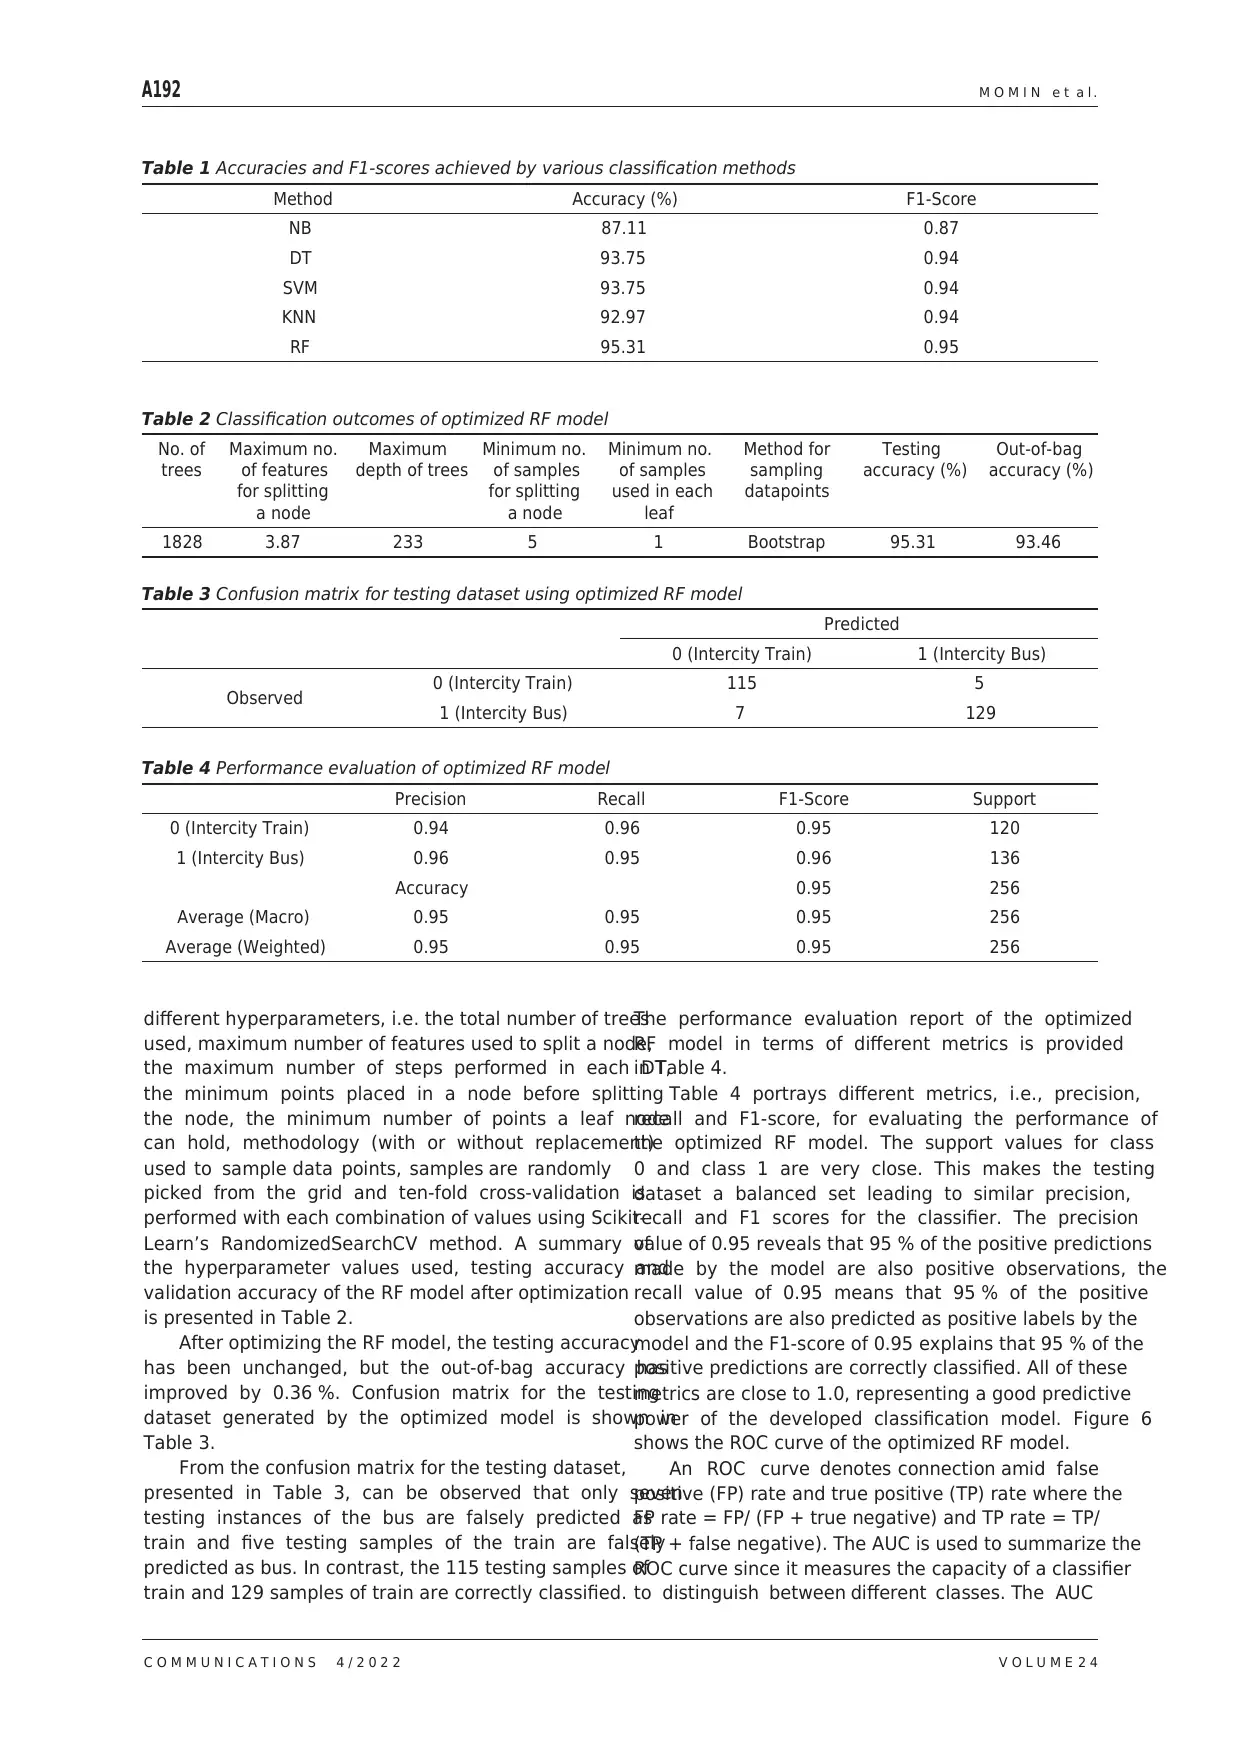
The performance evaluation report of the optimized
RF model in terms of different metrics is provided
in Table 4.
Table 4 portrays different metrics, i.e., precision,
recall and F1-score, for evaluating the performance of
the optimized RF model. The support values for class
0 and class 1 are very close. This makes the testing
dataset a balanced set leading to similar precision,
recall and F1 scores for the classifier. The precision
value of 0.95 reveals that 95 % of the positive predictions
made by the model are also positive observations, the
recall value of 0.95 means that 95 % of the positive
observations are also predicted as positive labels by the
model and the F1-score of 0.95 explains that 95 % of the
positive predictions are correctly classified. All of these
metrics are close to 1.0, representing a good predictive
power of the developed classification model. Figure 6
shows the ROC curve of the optimized RF model.
An ROC curve denotes connection amid false
positive (FP) rate and true positive (TP) rate where the
FP rate = FP/ (FP + true negative) and TP rate = TP/
(TP + false negative). The AUC is used to summarize the
ROC curve since it measures the capacity of a classifier
to distinguish between different classes. The AUC
different hyperparameters, i.e. the total number of trees
used, maximum number of features used to split a node,
the maximum number of steps performed in each DT,
the minimum points placed in a node before splitting
the node, the minimum number of points a leaf node
can hold, methodology (with or without replacement)
used to sample data points, samples are randomly
picked from the grid and ten-fold cross-validation is
performed with each combination of values using Scikit-
Learn’s RandomizedSearchCV method. A summary of
the hyperparameter values used, testing accuracy and
validation accuracy of the RF model after optimization
is presented in Table 2.
After optimizing the RF model, the testing accuracy
has been unchanged, but the out-of-bag accuracy has
improved by 0.36 %. Confusion matrix for the testing
dataset generated by the optimized model is shown in
Table 3.
From the confusion matrix for the testing dataset,
presented in Table 3, can be observed that only seven
testing instances of the bus are falsely predicted as
train and five testing samples of the train are falsely
predicted as bus. In contrast, the 115 testing samples of
train and 129 samples of train are correctly classified.
Table 1 Accuracies and F1-scores achieved by various classification methods
Method Accuracy (%) F1-Score
NB 87.11 0.87
DT 93.75 0.94
SVM 93.75 0.94
KNN 92.97 0.94
RF 95.31 0.95
Table 2 Classification outcomes of optimized RF model
No. of
trees
Maximum no.
of features
for splitting
a node
Maximum
depth of trees
Minimum no.
of samples
for splitting
a node
Minimum no.
of samples
used in each
leaf
Method for
sampling
datapoints
Testing
accuracy (%)
Out-of-bag
accuracy (%)
1828 3.87 233 5 1 Bootstrap 95.31 93.46
Table 3 Confusion matrix for testing dataset using optimized RF model
Predicted
0 (Intercity Train) 1 (Intercity Bus)
Observed 0 (Intercity Train) 115 5
1 (Intercity Bus) 7 129
Table 4 Performance evaluation of optimized RF model
Precision Recall F1-Score Support
0 (Intercity Train) 0.94 0.96 0.95 120
1 (Intercity Bus) 0.96 0.95 0.96 136
Accuracy 0.95 256
Average (Macro) 0.95 0.95 0.95 256
Average (Weighted) 0.95 0.95 0.95 256
C O M M U N I C A T I O N S 4 / 2 0 2 2 V O L U M E 2 4
The performance evaluation report of the optimized
RF model in terms of different metrics is provided
in Table 4.
Table 4 portrays different metrics, i.e., precision,
recall and F1-score, for evaluating the performance of
the optimized RF model. The support values for class
0 and class 1 are very close. This makes the testing
dataset a balanced set leading to similar precision,
recall and F1 scores for the classifier. The precision
value of 0.95 reveals that 95 % of the positive predictions
made by the model are also positive observations, the
recall value of 0.95 means that 95 % of the positive
observations are also predicted as positive labels by the
model and the F1-score of 0.95 explains that 95 % of the
positive predictions are correctly classified. All of these
metrics are close to 1.0, representing a good predictive
power of the developed classification model. Figure 6
shows the ROC curve of the optimized RF model.
An ROC curve denotes connection amid false
positive (FP) rate and true positive (TP) rate where the
FP rate = FP/ (FP + true negative) and TP rate = TP/
(TP + false negative). The AUC is used to summarize the
ROC curve since it measures the capacity of a classifier
to distinguish between different classes. The AUC
different hyperparameters, i.e. the total number of trees
used, maximum number of features used to split a node,
the maximum number of steps performed in each DT,
the minimum points placed in a node before splitting
the node, the minimum number of points a leaf node
can hold, methodology (with or without replacement)
used to sample data points, samples are randomly
picked from the grid and ten-fold cross-validation is
performed with each combination of values using Scikit-
Learn’s RandomizedSearchCV method. A summary of
the hyperparameter values used, testing accuracy and
validation accuracy of the RF model after optimization
is presented in Table 2.
After optimizing the RF model, the testing accuracy
has been unchanged, but the out-of-bag accuracy has
improved by 0.36 %. Confusion matrix for the testing
dataset generated by the optimized model is shown in
Table 3.
From the confusion matrix for the testing dataset,
presented in Table 3, can be observed that only seven
testing instances of the bus are falsely predicted as
train and five testing samples of the train are falsely
predicted as bus. In contrast, the 115 testing samples of
train and 129 samples of train are correctly classified.
Table 1 Accuracies and F1-scores achieved by various classification methods
Method Accuracy (%) F1-Score
NB 87.11 0.87
DT 93.75 0.94
SVM 93.75 0.94
KNN 92.97 0.94
RF 95.31 0.95
Table 2 Classification outcomes of optimized RF model
No. of
trees
Maximum no.
of features
for splitting
a node
Maximum
depth of trees
Minimum no.
of samples
for splitting
a node
Minimum no.
of samples
used in each
leaf
Method for
sampling
datapoints
Testing
accuracy (%)
Out-of-bag
accuracy (%)
1828 3.87 233 5 1 Bootstrap 95.31 93.46
Table 3 Confusion matrix for testing dataset using optimized RF model
Predicted
0 (Intercity Train) 1 (Intercity Bus)
Observed 0 (Intercity Train) 115 5
1 (Intercity Bus) 7 129
Table 4 Performance evaluation of optimized RF model
Precision Recall F1-Score Support
0 (Intercity Train) 0.94 0.96 0.95 120
1 (Intercity Bus) 0.96 0.95 0.96 136
Accuracy 0.95 256
Average (Macro) 0.95 0.95 0.95 256
Average (Weighted) 0.95 0.95 0.95 256
Paraphrase This Document
Need a fresh take? Get an instant paraphrase of this document with our AI Paraphraser
M O D E L I N G T H E B E H A V I O R I N C H O O S I N G T H E T R A V E LM O D E F O R L O N G -D I S T A N C E T R A V E L .. . A193
V O L U M E 2 4 C O M M U N I C A T I O N S 4 / 2 0 2 2
can be considered as effective in distinguishing between
two classes.
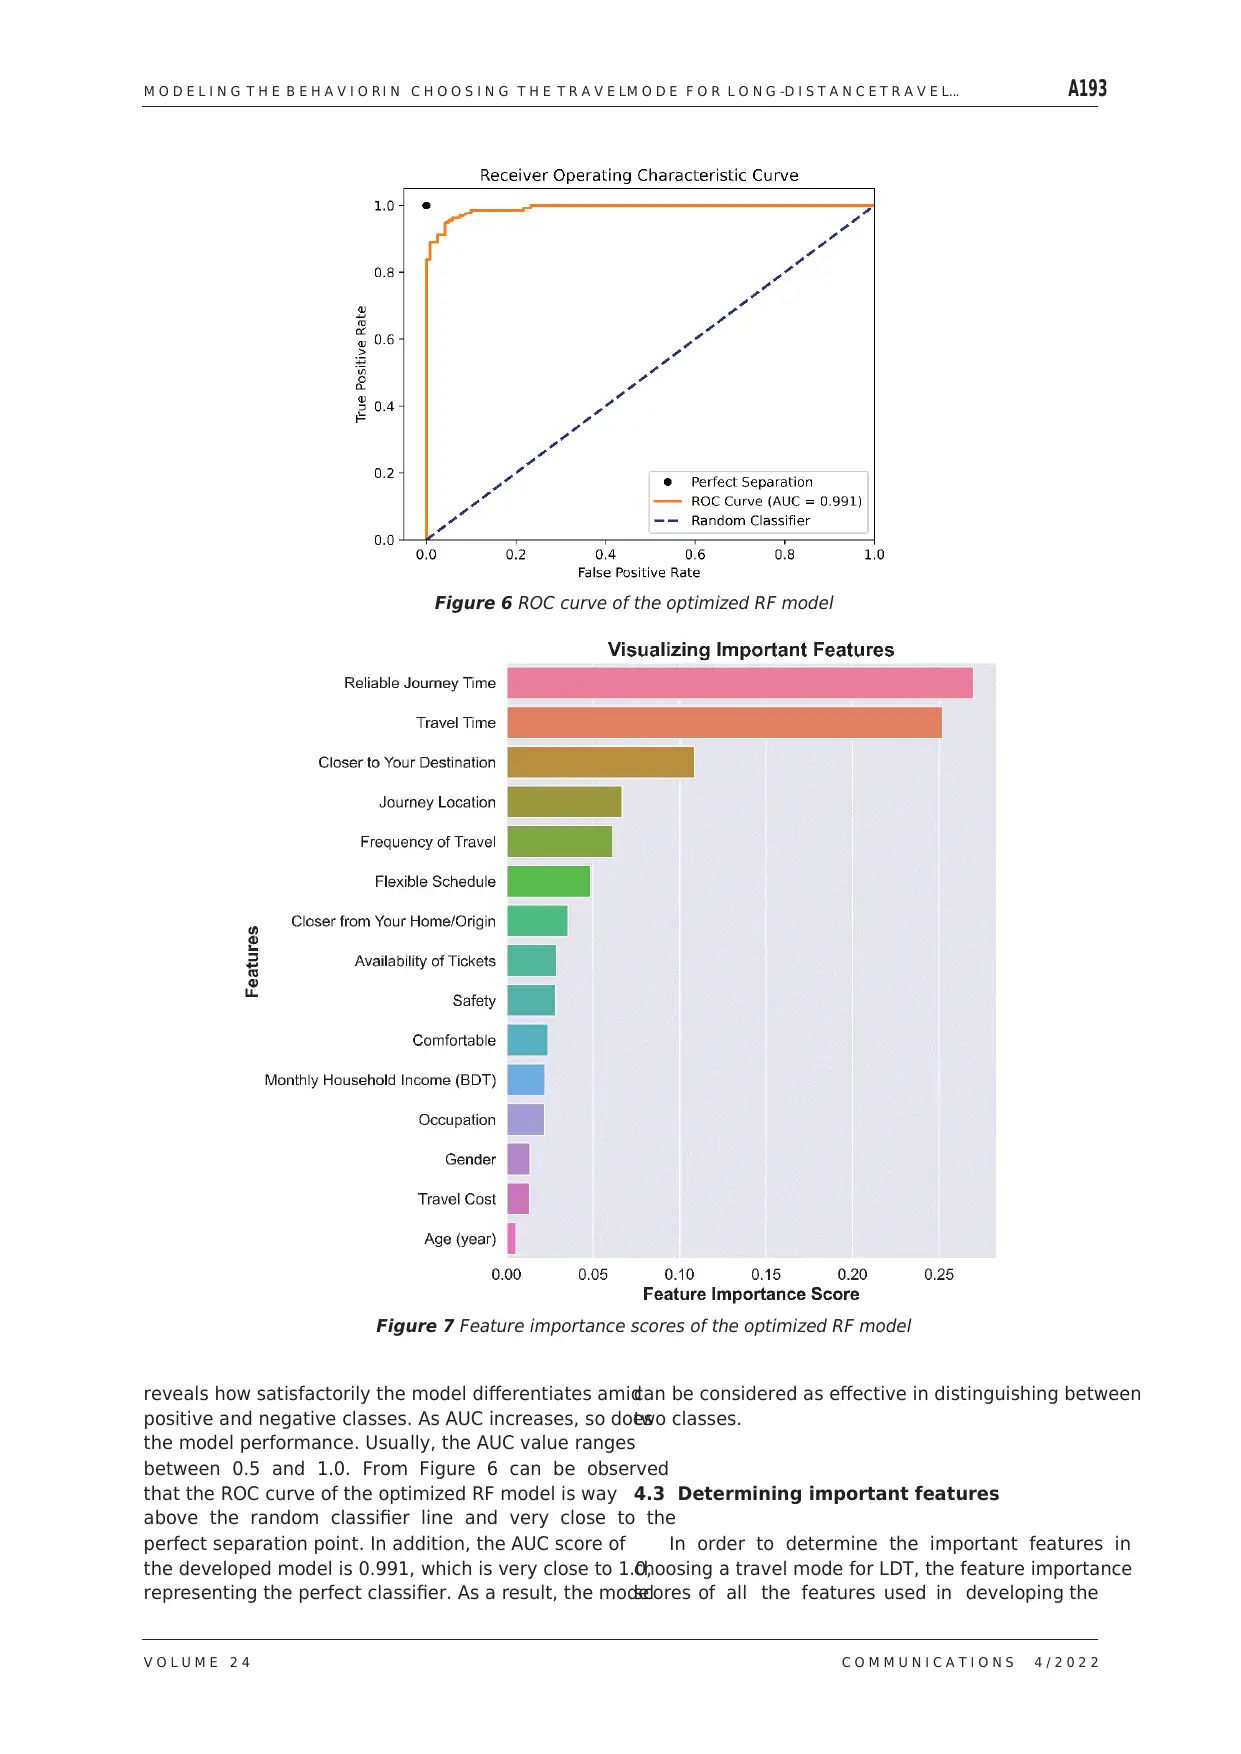
4.3 Determining important features
In order to determine the important features in
choosing a travel mode for LDT, the feature importance
scores of all the features used in developing the
reveals how satisfactorily the model differentiates amid
positive and negative classes. As AUC increases, so does
the model performance. Usually, the AUC value ranges
between 0.5 and 1.0. From Figure 6 can be observed
that the ROC curve of the optimized RF model is way
above the random classifier line and very close to the
perfect separation point. In addition, the AUC score of
the developed model is 0.991, which is very close to 1.0,
representing the perfect classifier. As a result, the model
Figure 6 ROC curve of the optimized RF model
Figure 7 Feature importance scores of the optimized RF model
V O L U M E 2 4 C O M M U N I C A T I O N S 4 / 2 0 2 2
can be considered as effective in distinguishing between
two classes.
4.3 Determining important features
In order to determine the important features in
choosing a travel mode for LDT, the feature importance
scores of all the features used in developing the
reveals how satisfactorily the model differentiates amid
positive and negative classes. As AUC increases, so does
the model performance. Usually, the AUC value ranges
between 0.5 and 1.0. From Figure 6 can be observed
that the ROC curve of the optimized RF model is way
above the random classifier line and very close to the
perfect separation point. In addition, the AUC score of
the developed model is 0.991, which is very close to 1.0,
representing the perfect classifier. As a result, the model
Figure 6 ROC curve of the optimized RF model
Figure 7 Feature importance scores of the optimized RF model
A194 M O M I N e t a l .
C O M M U N I C A T I O N S 4 / 2 0 2 2 V O L U M E 2 4
long-distance travel by airways and waterways can be
considered as a future scope of the study. Besides, only
machine learning models have been used to model the
mode choice preferences. As an extension of this study,
discrete choice modeling techniques can be used and
compared to the performance of the machine learning
models.
6 Conclusions
This study investigates travelers’ alternative
mode choice behavior between the intercity trains
and intercity buses for the LDT. Data related to
demographics, socioeconomic status of the respondents
and various features of mode choice are collected from
a questionnaire survey conducted on various groups
of people in the capital city, Dhaka, in Bangladesh.
Among the features considered for modeling travel mode
choice, time required for travel, costs associated with
travel, the proximity of origin or destination from stop
or station, comfort, safety, reliability of journey time,
availability of tickets and flexibility of schedule have
been considered. Using the acquired data, several ML
algorithms are used to predict the travel mode choice
behavior. Considering the model accuracy and F1-score,
the RF model outperformed all the others, with 95.31 %
accuracy and 0.95 F1-score. Further, the model has
been optimized by tuning different hyper-parameters,
which led to an unchanged accuracy but an increased
out-of-bag accuracy of 93.46 %. The feature importance
score determined from the model revealed that reliable
journey time, time required for travel, stop or station
closer to destination, journey location and frequency of
travel are the most critical features in forecasting travel
mode choice.
Nomenclature
AUC Area Under the Curve
DT Decision Tree
FP False Positive
KNN K-Nearest Neighbors
LDT Long Distance Travel
ML Machine Learning
MLP Multi-Layer Perceptron
MNL Multinomial Logit
NB Naive Bayes
RBF Radial Basis Functions
RF Random Forest
ROC Receiver Operating Characteristic
SVM Support Vector Machine
TP True Positive
UK United Kingdom
USA United States of America
XGB Extreme Gradient Boosting
classification model are plotted in Figure 7. The feature
importance score represents the contribution of the
feature in making the decision regarding the travel
mode choice for LDT.
In the RF classification model, Gini importance,
or mean decrease in impurity, is used to measure the
importance of features [55]. The features shown in
Figure 7 are ranked as per decreasing importance score.
Reliable journey time is the most important feature
for the proposed LDT mode choice, time required for
travel, stop or station closer to destination, journey
location and frequency of travel are the second, third,
fourth and fifth most important features. The other
features, deemed important in deciding on the travel
mode, are flexible schedule, stop or station closer to
the origin, availability of tickets, safety, comfortability,
monthly household income, occupation, gender, travel
costs and age of the respondent in descending order of
importance.
So, it is evident that for the LDT, travelers
in Bangladesh emphasize more the reliable journey
time, time required for travel, stop or station closer
to destination, journey location and frequency of
travel compared to other factors. On the other hand,
flexible schedule, stop or station closer to the origin,
availability of tickets, safety, comfortability, monthly
household income, occupation, gender, travel costs and
age of the respondent have less influence in choosing
travel mode for LDT. Although the intercity trains are
more preferable to intercity buses in terms of comfort
and travel costs, buses are more preferred by the
respondents in overall (see Figure 5). This is because
these two factors contribute less in deciding on the
travel mode in comparison to other factors. Hence,
the intercity bus is the preferred mode of LDT over
intercity train in Bangladesh, especially due to less
reliable journey time, time required for travel, stop
or station closer to destination, journey location and
frequency of travel. However, it is to be kept in mind
that flexible roads have been found to deteriorate early
in Bangladesh [56-57], if such situation continues to
degrade in the future, people’s mode choice in the LDT
might get changed.
5 Limitations of the study
One of the limitations of this study is that it only
considered two modes of the long-distance travel, i.e., bus
and train. There are two other modes of transportation
available for long-distance travel in Bangladesh, i.e.,
airways and waterways. The railway network in
Bangladesh covers approximately 2877.10 kilometers
connecting 44 of the 64 districts, whereas only eight
districts are connected by air and only a few districts in
the Barishal division have waterways (launch) for long-
distance travel. So, buses and trains represent most
of the long-distance travel in Bangladesh, while the
⊘ This is a preview!⊘
Do you want full access?
Subscribe today to unlock all pages.
Trusted by 1+ million students worldwide
M O D E L I N G T H E B E H A V I O R I N C H O O S I N G T H E T R A V E LM O D E F O R L O N G -D I S T A N C E T R A V E L .. . A195
V O L U M E 2 4 C O M M U N I C A T I O N S 4 / 2 0 2 2
Acknowledgments
The authors of this paper would like to thank the
Department of Civil Engineering, Daffodil International
University, for the technical assistance in conducting
this research.
Declaration of competing interests
The authors declare that they have no known
competing financial interests or personal relationships
that could have appeared to influence the work reported
in this paper.
References
[1] SPRUMONT, F., VITI, F., CARUSO, G., KONIG, A. Workplace relocation and mobility changes in
a transnational metropolitan area: the case of the University of Luxembourg. Transportation Research
Procedia [online]. 2014, 4, p. 286-299. ISSN 2352-1465.Available from: https://doi.org/10.1016/j.
trpro.2014.11.022
[2] ARBELAEZ, O. Modeling the choice of public and private bicycles in cities / Modelacion de la eleccion
de la bicicleta publica y privada en ciudades (in Spanish). MSc. Thesis. Medellin: Department of Civil
Engineering, Universidad Nacional de Colombia, 2015.
[3] BOCKER, L., VAN AMEN, P., HELBICH, M. Elderly travel frequencies and transport mode choices in
greater Rotterdam, the Netherlands. Transportation [online]. 2016, 44(4) p. 831-852. ISSN 0049-4488,
eISSN 1572-9435. Available from: https://doi.org/10.1007/s11116-016-9680-z
[4] MANDOKI, P., LAKATOS, A. Quality evaluation of the long-distance bus and train transportation in
Hungary. Transportation Research Procedia [online]. 2017, 27, p. 365-372. ISSN 2352-1465. Available
from: https://doi.org/10.1016/j.trpro.2017.12.086
[5] VEENEMAN, W. W., VAN DE VELDE, D. M., SCHIPHOLT, L. L. The value of bus and train: public values
in public transport. In: European Transport Conference: proceedings. 2006. p. 18-20.
[6] KAMPF, R., GASPARIK, J., KUDLACKOVA, N. Application of different forms of transport in relation
to the process of transport user value creation. Periodica Polytechnica Transportation Engineering
[online]. 2012, 40(2), p. 71-75. ISSN 0303-7800, eISSN 1587-3811. Available from: https://doi.org/10.3311/
pp.tr.2012-2.05
[7] MCFADDEN, D. Conditional logit analysis of qualitative choice behavior. In: Frontiers in Econometrics.
ZAREMBKA, P. (ed.). NY: Academic Press, 1973. ISBN 978-0127761503.
[8] CHENG, L., CHEN, X., DE VOS, J., LAI, X., WITLOX, F. Applying a random forest method approach
to model travel mode choice behavior. Travel Behaviour and Society [online]. 2019, 14, p. 1-10.
ISSN 2214-367X. Available from: https://doi.org/10.1016/j.tbs.2018.09.002
[9] ZHAO, X., YAN, X., YU, A., VAN HENTENRYCK, P. Prediction and behavioral analysis of travel mode
choice: A comparison of machine learning and logit models. Travel Behaviour and Society [online]. 2020,
20, p. 22-35. ISSN 2214-367X. Available from: https://doi.org/10.1016/j.tbs.2020.02.003
[10] ZHAO, X., ZHOU, Z., YAN, X., VAN HENTENRYCK, P. Distilling black-box travel mode choice model for
behavioral interpretation. ArXiv [online]. 2019, arXiv:1910.13930. Available from: https://doi.org/10.48550/
arXiv.1910.13930
[11] LINDNER, A., PITOMBO, C. S., CUNHA, A. L. Estimating motorized travel mode choice using classifiers:
an application for high-dimensional multicollinear data. Travel Behaviour and Society [online]. 2017, 6,
p. 100-109. eISSN 2214-367X. Available from: https://doi.org/10.1016/j.tbs.2016.08.003
[12] HAGENAUER, J., HELBICH, M. A comparative study of machine learning classifiers for modeling travel
mode choice. Expert Systems with Applications [online]. 2017, 78, p. 273-282. ISSN 0957-4174. Available
from: https://doi.org/10.1016/j.eswa.2017.01.057
[13] GOLSHANI, N., SHABANPOUR, R., MAHMOUDIFARD, S. M., DERRIBLE, S., MOHAMMADIAN, A.
Modeling travel mode and timing decisions: comparison of artificial neural networks and copula-based
joint model. Travel Behaviour and Society [online]. 2018, 10, p. 21-32. ISSN 2214-367X. Available from:
https://doi.org/10.1016/j.tbs.2017.09.003
[14] CHEN, J., LI, S. Mode choice model for public transport with categorized latent variables. Mathematical
Problems in Engineering [online]. 2017, 2017, 7861945. ISSN 1024-123X, eISSN 1563-5147. Available
from: https://doi.org/10.1155/2017/7861945
[15] ZHANG, R., YE, X., WANG, K., LI, D., ZHU, J. Development of commute mode choice model by integrating
actively and passively collected travel data. Sustainability [online]. 2019, 11(10), 2730. eISSN 2071-1050.
Available from: https://doi.org/10.3390/su11102730
[16] VAN ACKER, V., KESSELS, R., PALHAZI CUERVO, D., LANNOO, S., WITLOX, F. Preferences for
long-distance coach transport: evidence from a discrete choice experiment. Transportation Research
Paraphrase This Document
Need a fresh take? Get an instant paraphrase of this document with our AI Paraphraser
A196 M O M I N e t a l .
C O M M U N I C A T I O N S 4 / 2 0 2 2 V O L U M E 2 4
Part A: Policy and Practice [online]. 2020, 132(C), p. 759-779. ISSN 0965-8564.Available from:
https://doi.org/10.1016/j.tra.2019.11.028
[17] BROG, W., ERL, E., SAMMER, G., SCHULZE, B. Design and application of a travel survey for long-
distance trips based on an international network of expertise - concept and methodology. In: 10th
International Conference on Travel Behaviour Research: proceedings. 2003.
[18] Long-distance travel - Bureau of transportation statistics [online]. 2017. Available from: https://www.bts.
gov/bts/archive/publications/highlights_of_the_2001_national_household_travel_survey/section_03
[19] BASTARIANTO, F. F., IRAWAN, M. Z., CHOUDHURY, C., PALMA, D., MUTHOHAR, I. A tour-based mode
choice model for commuters in Indonesia. Sustainability [online]. 2019, 11(3), 788. eISSN 2071-1050. Available
from: https://doi.org/10.3390/su11030788
[20] WANG, Y., YAN, X., ZHOU, Y., XUE, Q. Influencing mechanism of potential factors on passengers’ long-
distance travel mode choices based on structural equation modeling. Sustainability [online]. 2017, 9(11), 1943.
eISSN 2071-1050. Available from: https://doi.org/10.3390/su9111943
[21] NAM, D., KIM, H., CHO, J., JAYAKRISHNAN, R. A model based on deep learning for predicting travel mode
choice. In: 96th Annual Meeting Transportation Research Board: proceedings. 2017. p. 8-12.
[22] HASEGAWA, H., NAITO, T., ARIMURA, M., TAMURA, T. Modal choice analysis using ensemble learning
methods (in Japanese). Journal of Japan Society of Civil Engineering [online], 2012, 68(5), p. 773-780.
eISSN 2185-6540. Available from: https://doi.org/10.2208/jscejipm.68.I_773
[23] ABDULJABBAR, R., DIA, H., LIYANAGE, S., BAGLOEE, S. Applications of artificial intelligence in transport:
an overview. Sustainability [online]. 2019, 11(1), 189. eISSN 2071-1050. Available from: https://doi.org/10.3390/
su11010189
[24] BHAVSAR, P., SAFRO, I., BOUAYNAYA, N., POLIKAR, R., DERA, D. Machine learning in transportation data
analytics. In: Data analytics for intelligent transportation system [online]. CHOWDHURY, M., APON, A., DEY,
K. (eds.). Elsevier, 2017. ISBN 978-0-12-809715-1, p. 283-307. Available from: https://doi.org/10.1016/B978-0-12-
809715-1.00012-2
[25] PULUGURTA, S., ARUN, A., ERRAMPALLI, M. Use of artificial intelligence for mode choice analysis and
comparison with traditional multinomial logit model. Procedia - Social and Behavioral Sciences [online]. 2013,
104, p. 583-592. ISSN 1877-0428. Available from: https://doi.org/10.1016/j.sbspro.2013.11.152
[26] TANG, L., XIONG, C., ZHANG, L. Decision tree method for modeling travel mode switching in a dynamic
behavioral process. Transportation Planning and Technology [online]. 2015, 38(3), p. 833-850. ISSN 0308-1060,
eISSN 1029-0354. Available from: https://doi.org/10.1080/03081060.2015.1079385
[27] MOECKEL, R., FUSSELL, R., DONNELLY, R. Mode choice modeling for long-distance travel. Transportation
Letters [online]. 2015, 7(1), p. 35-46. ISSN 1942-7867, eISSN 1942-7875. Available from: https://doi.org/10.1179/1
942787514y.0000000031
[28] SHEN, J. Latent class model or mixed logit model? A comparison by transport mode choice data.
Applied Economics [online]. 2009, 41(22), p. 2915-2924. ISSN 0003-6846, eISSN 1466-4283. Available from:
https://doi.org/10.1080/00036840801964633
[29] DE BOK, M., COSTA, A., MELO, S., PALMA, V., FRIAS, R. Estimation of a mode choice model for long distance
travel in Portugal. In: World Conference of Transport Research: proceedings. 2010.
[30] ROHR, C., DALY, A., PATRUNI, B., TSANG, F. The importance of frequency and destination choice effects in
long-distance travel behaviour: what choice models can tell us. In: International Choice Modelling Conference:
proceedings. 2009.
[31] MVA. The specification of the long distance travel model. Final project report. Rotterdam: Dutch Ministry of
Transports and Public Works, 1985.
[32] DE JONG, G., GUNN, H. Recent evidence on car cost and time elasticities of travel demand in Europe. Journal
of Transport Economics and Policy (JTEP) [online]. 2001, 35(2), p. 137-160. eISSN 0022-5258.
[33] MANDEL, B, GAUDRY, M., ROTHENGATTER, W. A disaggregate Box-Cox logit mode choice model of intercity
passenger travel in Germany and its implications for high-speed rail demand forecasts. The Annals of Regional
Science [online]. 1997, 31, p. 99-120. ISSN 0570-1864, eISSN 1432-0592. Available from: http://dx.doi.org/10.1007/
s001680050041
[34] RAVE. Study of demand in the corridors of the high-speed rail network / Estudo da procura nos corredores da
rede ferroviaria de alta velocidade (in Spanish). Study for high speed rail network / Study for rede ferroviaria de
alta velocidade. Lisbon: AT Kearney, 2003.
[35] GASPARIK, J., MESKO, P., ZAHUMENSKA, Z. Methodology for tendering the performances in long distance
rail passenger transport. Periodica Polytechnica Transportation Engineering [online]. 2019, 47(1), p. 19-24.
ISSN 0303-7800, eISSN 1587-3811. Available from: https://doi.org/10.3311/PPtr.11192
M O D E L I N G T H E B E H A V I O R I N C H O O S I N G T H E T R A V E LM O D E F O R L O N G -D I S T A N C E T R A V E L .. . A197
V O L U M E 2 4 C O M M U N I C A T I O N S 4 / 2 0 2 2
[36] LHERITIER, A., BOCAMAZO, M., DELAHAYE, T., ACUNA-AGOST, R. Airline itinerary choice modeling using
machine learning. Journal of Choice Modelling [online]. 2018, 31, p. 198-209. ISSN 1755-5345. Available from:
https://doi.org/10.1016/j.jocm.2018.02.002
[37] BISHOP, CH. M. Pattern recognition and machine learning. Vol. 4. New York: Springer-Verlag, 2006.
ISBN 978-1-4939-3843-8.
[38] MULLAINATHAN, S. SPIESS, J. Machine learning: an applied econometric approach. Journal of Economic
Perspectives [online]. 2017, 31(2), p. 87-106. ISSN 0895-3309, eISSN ISSN 1944-7965. Available from: https://doi.
org/10.1257/jep.31.2.87
[39] WANG, F., ROSS, C. L. Machine learning travel mode choices: comparing the performance of an extreme
gradient boosting model with a multinomial logit model. Transportation Research Record [online]. 2018,
2672(47), p. 35-45. ISSN 0361-1981, eISSN 2169-4052. Available from: https://doi.org/10.1177/0361198118773556
[40] OMRANI, H. Predicting travel mode of individuals by machine learning. Transportation Research Procedia
[online]. 2015, 10, p. 840-849. ISSN 2352-1465. Available from: https://doi.org/10.1016/j.trpro.2015.09.037
[41] CHERCHI, E., CIRILLO, C. Validation and forecasts in models estimated from multiday travel survey.
Transportation Research Record [online]. 2010, 2175(1), p. 57-64. ISSN 0361-1981, eISSN 2169-4052. Available
from: https://doi.org/10.3141/2175-07
[42] KARLAFTIS, M. G., VLAHOGIANNI, E. I. Statistical methods versus neural networks in transportation
research: differences, similarities and some insights. Transportation Research Part C: Emerging Technologies
[online]. 2011, 19(3), p. 387-399. ISSN 0968-090X. Available from: https://doi.org/10.1016/j.trc.2010.10.004
[43] ATHEY, S. Beyond prediction: using big data for policy problems. Science [online]. 2017, 355(6324), p. 483-485.
ISSN 0036-8075. Available from: https://doi.org/10.1126/science.aal4321
[44] MOLNAR, C. Interpretable machine learning: a guide for making black box models explainable [online].
2. ed. Independently published, 2022. ISBN 979-8411463330. Available from: https://christophm.github.io/
interpretable-ml-book/
[45] DE PALMA, A., ROCHAT, D. Mode choices for trips to work in Geneva: an empirical analysis. Journal of
Transport Geography [online]. 2000, 8(1), p. 43-51. ISSN 0966-6923. Available from: https://doi.org/10.1016/
s0966-6923(99)00026-5
[46] ASHALATHA, R., MANJU, V. S., ZACHARIA, A. B. Mode choice behavior of commuters in Thiruvananthapuram
City. Journal of Transportation Engineering [online]. 2013, 139(5), p. 494-502. ISSN 2473-2907, eISSN 2473-
2893. Available from: https://doi.org/10.1061/(asce)te.1943-5436.0000533
[47] LINDLEY, D. V. Fiducial distributions and Bayes’ theorem. Journal of the Royal Statistical Society:
Series B (Methodological) [online]. 1958, 20(1), p. 102-107. eISSN 1467-9868. Available from: https://doi.
org/10.1111/j.2517-6161.1958.tb00278.x
[48] UDDIN, S., KHAN, A., HOSSAIN, M. E., MONI, M. A. Comparing different supervised machine learning
algorithms for disease prediction. BMC Medical Informatics and Decision Making [online]. 2019, 19(1), 281.
ISSN 1472-6947. Available from: https://doi.org/10.1186/s12911-019-1004-8
[49] RISH, I. An empirical study of the naive Bayes classifier. In: Workshop on Empirical Methods in Artificial
Intelligence IJCAI 2001: proceedings. 2001. p.41-46.
[50] QUINLAN, J. R. Induction of decision trees. Machine Learning [online]. 1986, 1(1), p. 81-106. ISSN 0885-6125,
eISSN 1573-0565. Available from: https://doi.org/10.1007/bf00116251
[51] BREIMAN, L. Random forests. Machine Learning [online]. 2001, 45, p. 5-32. ISSN 0885-6125, eISSN 1573-0565.
Available from: https://doi.org/10.1023/A:1010933404324
[52] JOACHIMS, T. Making large-scale SVM learning practical [online]. Technical report no. 1998,28. Dortmund:
University Dortmund, 1998. ISSN 0943-4135. Available from: http://hdl.handle.net/10419/77178
[53] COVER, T., HART, P. Nearest neighbor pattern classification. IEEE Transactions on Information Theory [online].
1967, 13(1), p. 21-27. ISSN 0018-9448, eISSN 1557-9654. Available from: https://doi.org/10.1109/TIT.1967.1053964
[54] GRANDINI, M., BAGLI, E., VISANI, G. Metrics for multi-class classification: an overview. ArXiv [online]. 2020,
abs/2008.05756. Available from: https://doi.org/10.48550/arXiv.2008.05756
[55] KANG, K., RYU, H. Predicting types of occupational accidents at construction sites in Korea using random forest
model. Safety Science [online]. 2019, 120, p. 226-236. ISSN 0925-7535. Available from: https://doi.org/10.1016/j.
ssci.2019.06.034
[56] HAMIM, O. F., HOQUE, M. S. Prediction of pavement life of flexible pavements under the traffic loading
conditions of Bangladesh. In: International Airfield and Highway Pavements Conference: proceedings [online].
2019. ISBN 9780784482452. Available from: https://doi.org/10.1061/9780784482452.003
[57] HAMIM, O. F., ANINDA, S. S., HOQUE, M. S., HADIUZZAMAN, M. Suitability of pavement type for developing
countries from an economic perspective using life cycle cost analysis. International Journal of Pavement Research
and Technology [online]. 2021, 14, p. 259-266. ISSN 1996-6814, eISSN 1997-1400. Available from: https://doi.
org/10.1007/s42947-020-0107-z
View publication stats
⊘ This is a preview!⊘
Do you want full access?
Subscribe today to unlock all pages.
Trusted by 1+ million students worldwide
1 out of 12
Your All-in-One AI-Powered Toolkit for Academic Success.
+13062052269
info@desklib.com
Available 24*7 on WhatsApp / Email
![[object Object]](/_next/static/media/star-bottom.7253800d.svg)
Unlock your academic potential
Copyright © 2020–2026 A2Z Services. All Rights Reserved. Developed and managed by ZUCOL.