University Supply Chain Modelling and Design: Cost Minimization
VerifiedAdded on 2021/04/17
|9
|1278
|71
Project
AI Summary
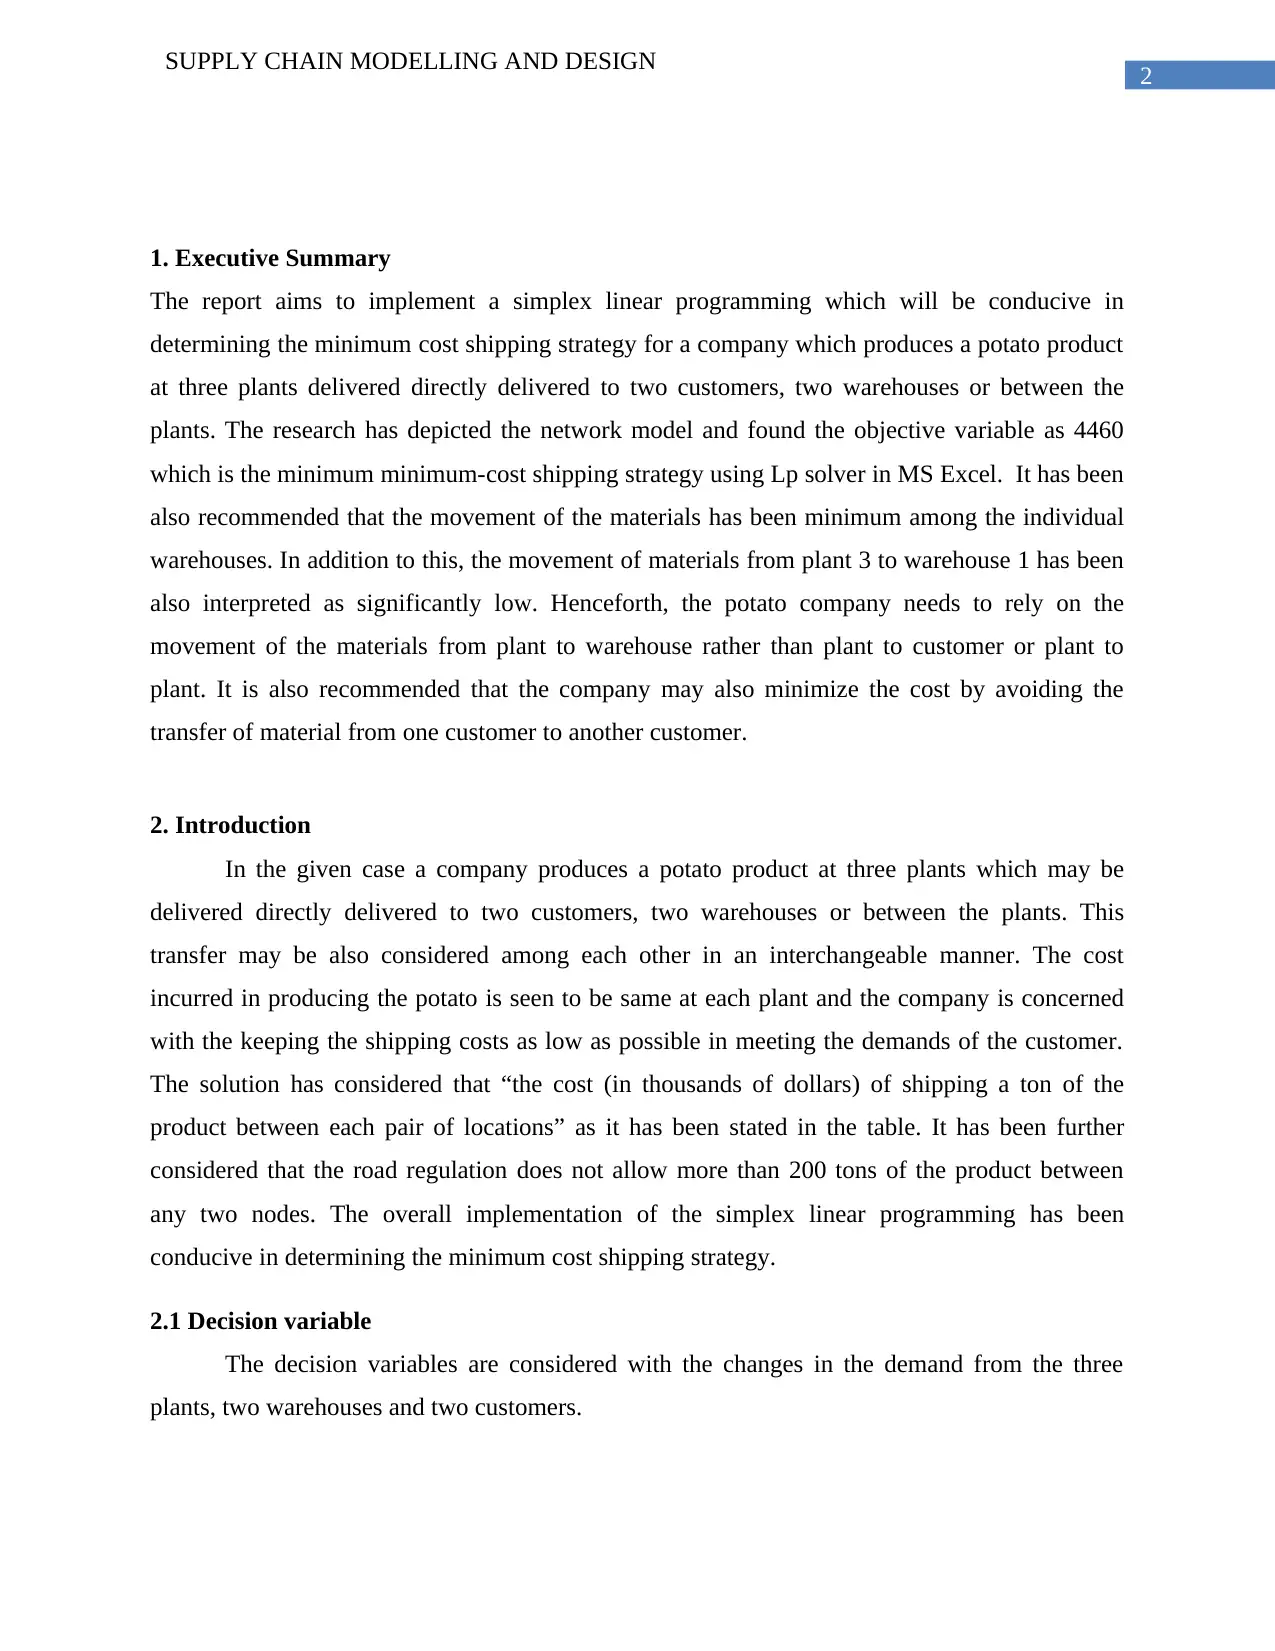
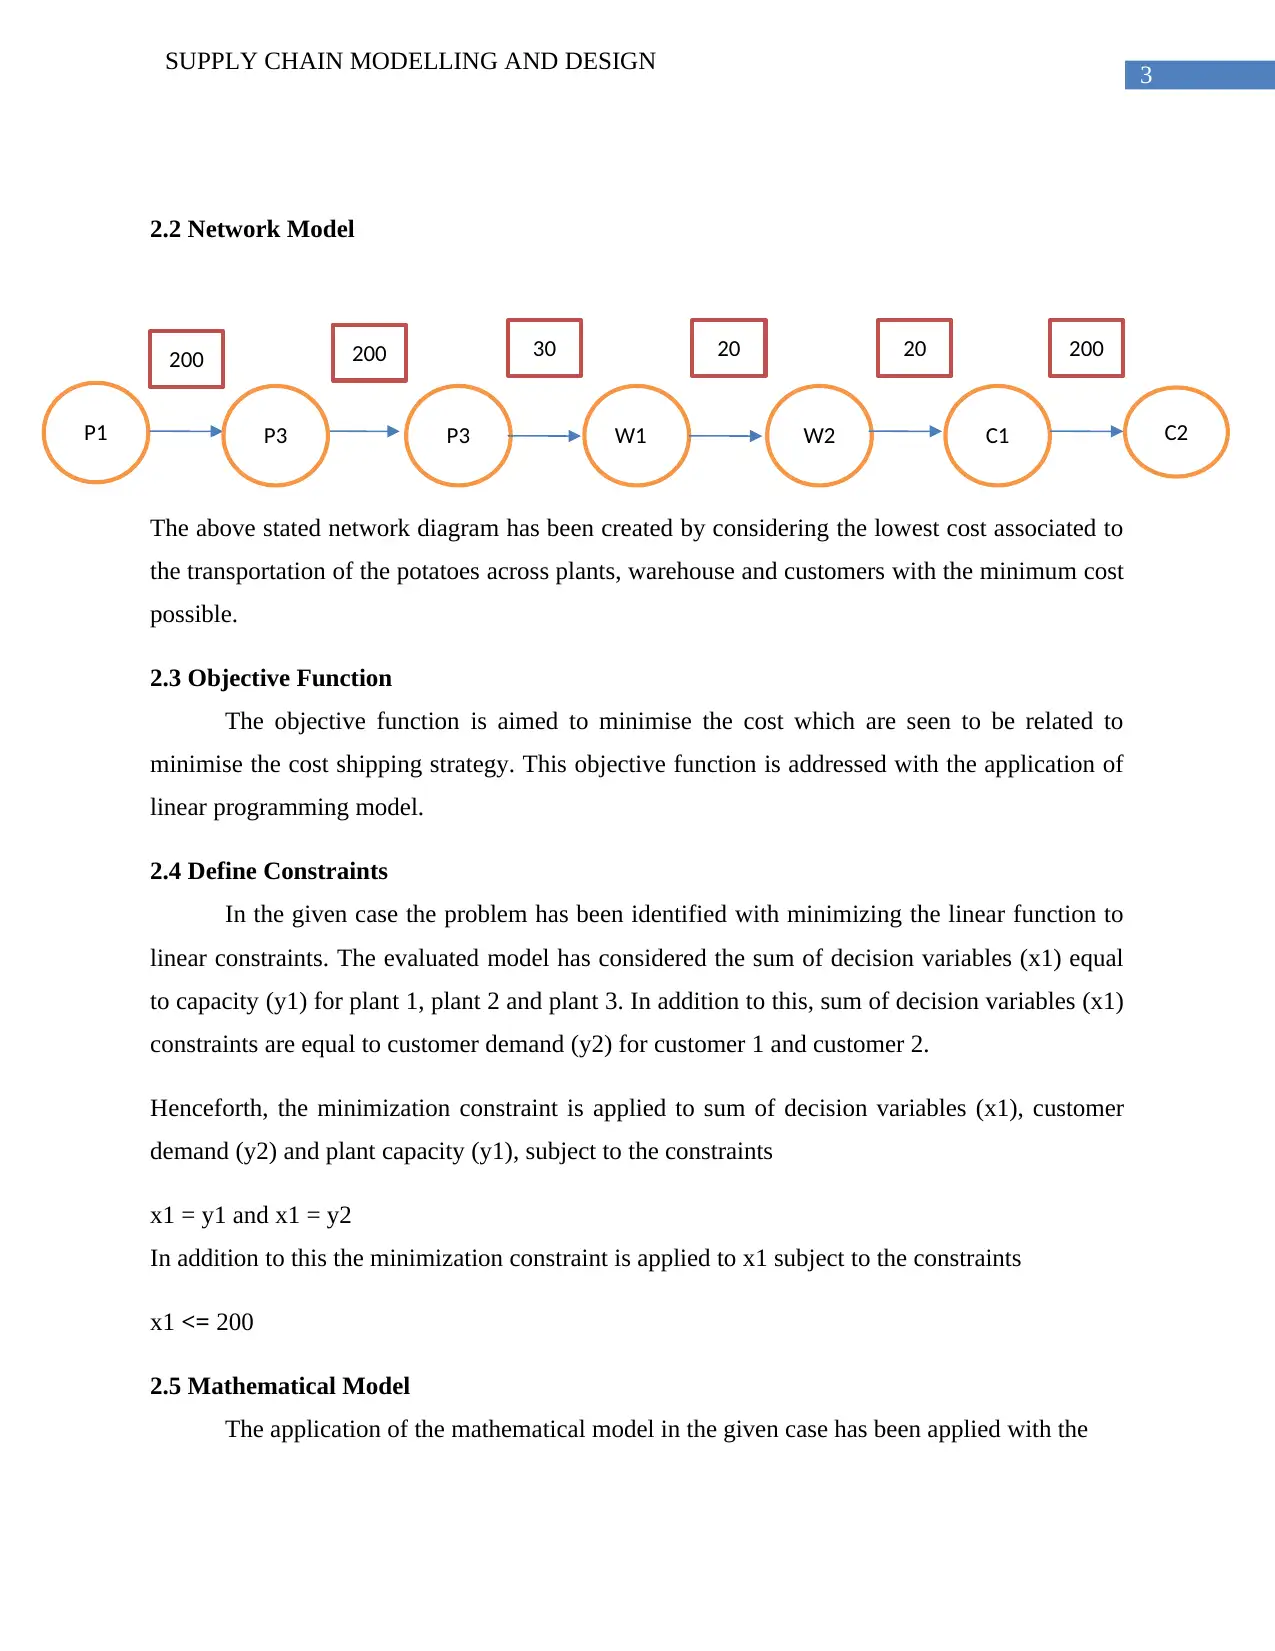
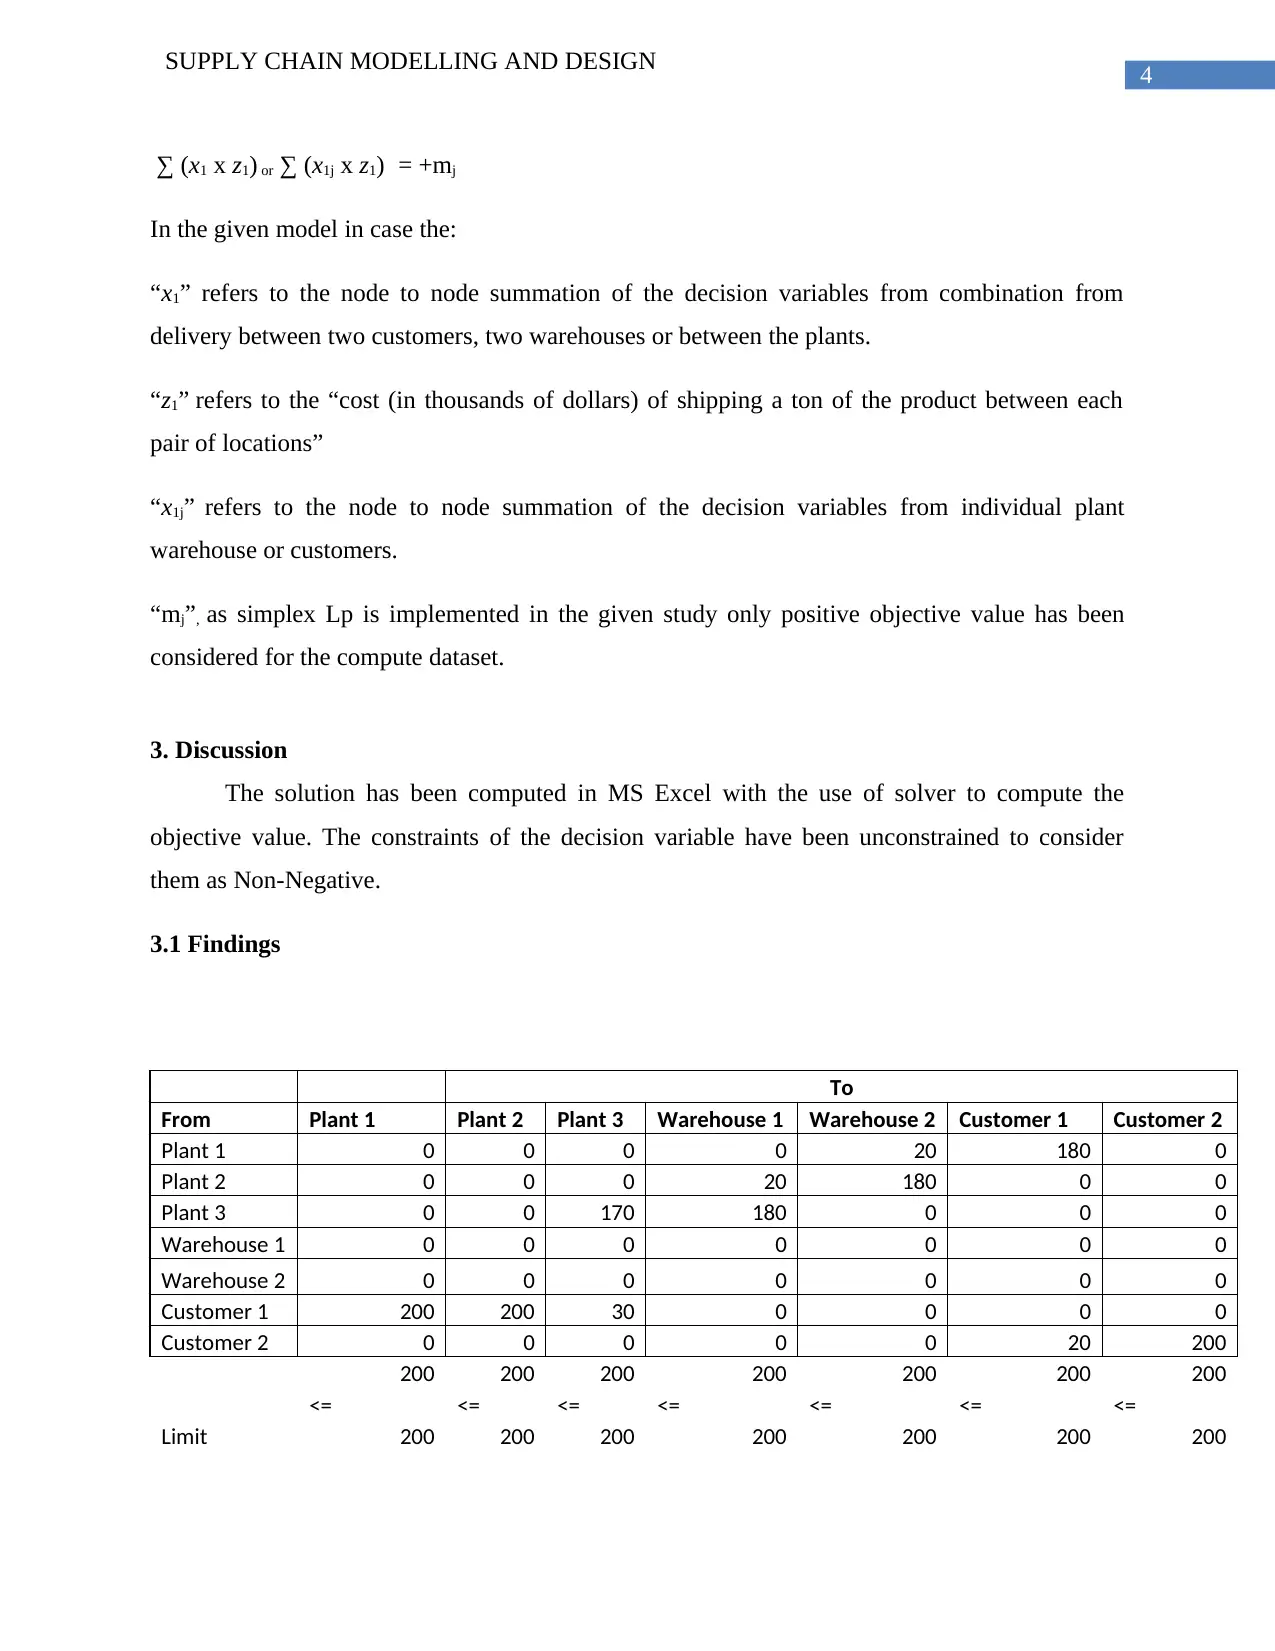
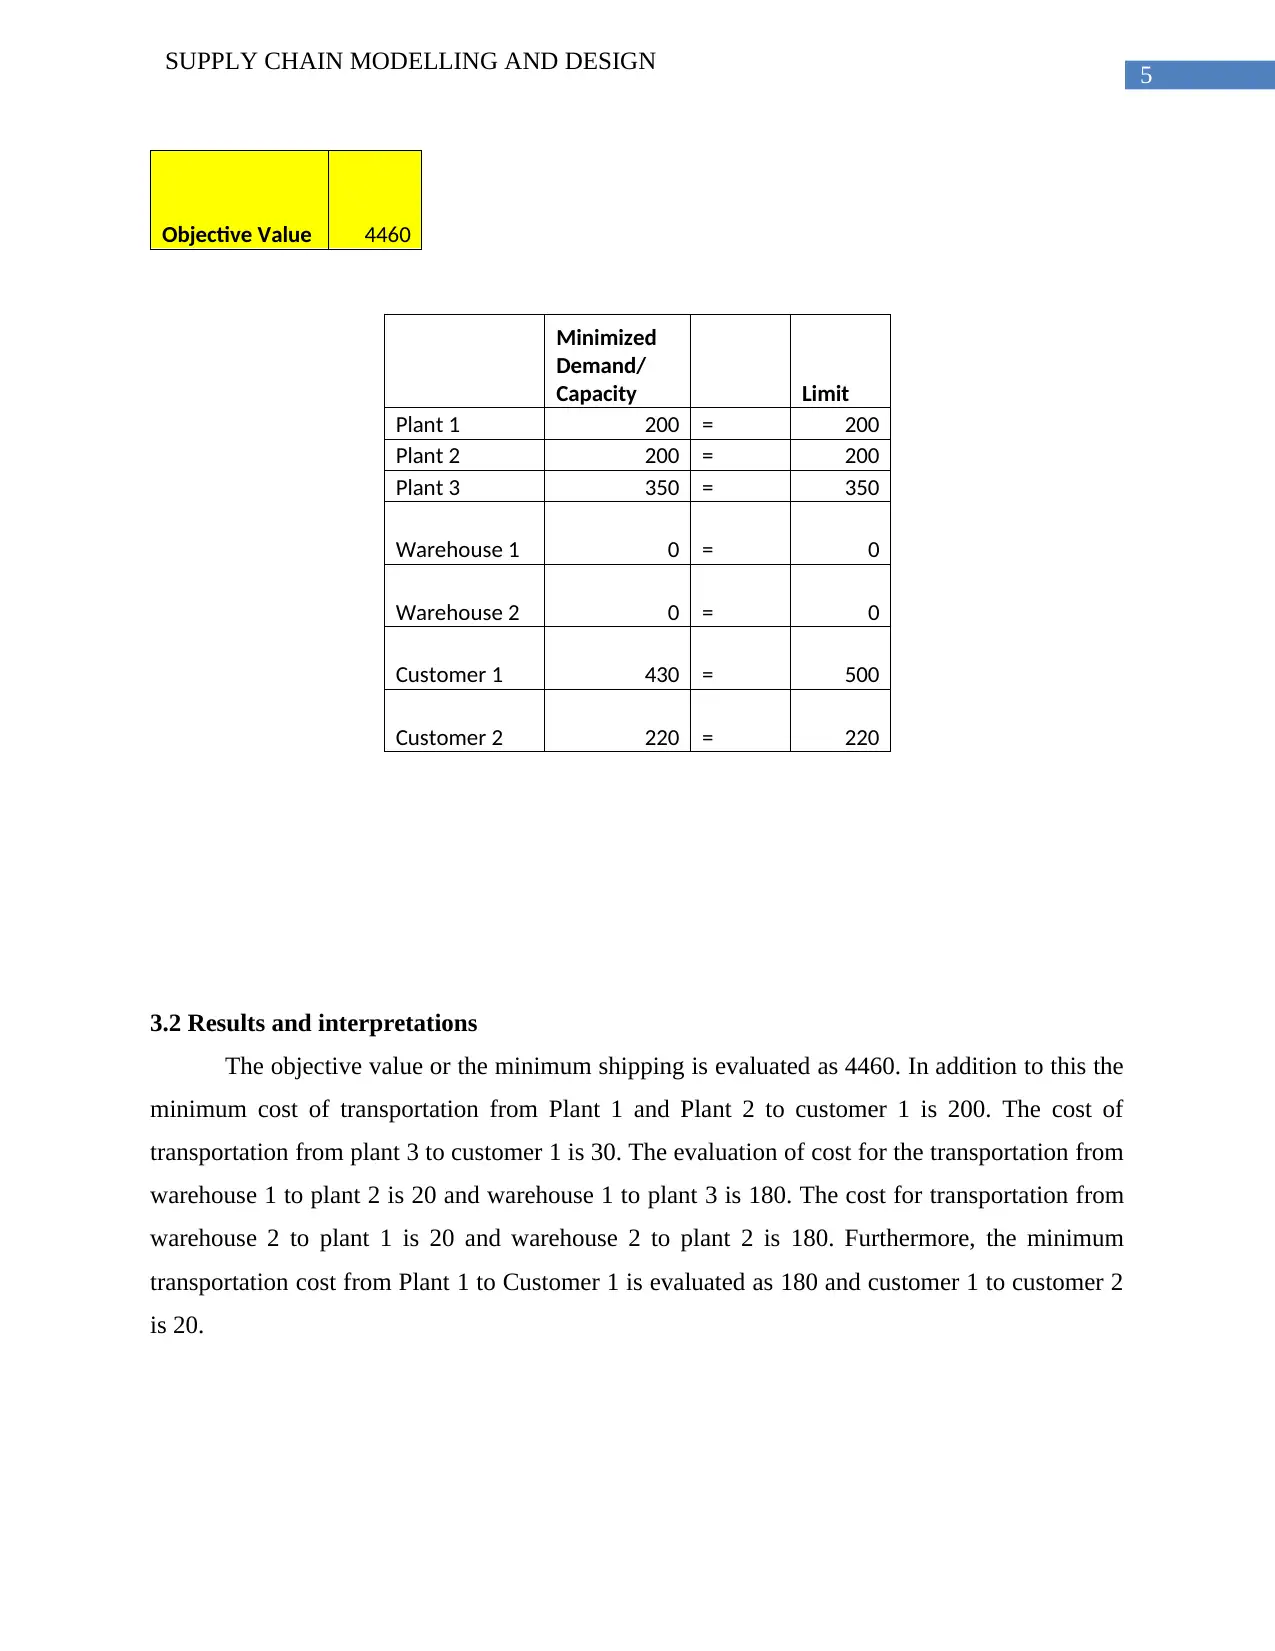
This project report focuses on supply chain modeling and design, specifically employing simplex linear programming to determine the minimum cost shipping strategy for a potato product company. The company operates three plants supplying two customers and two warehouses. The analysis involves defining decision variables, constructing a network model, establishing an objective function to minimize shipping costs, and setting constraints based on production capacities and customer demands. The mathematical model utilizes the MS Excel solver to find an objective value of 4460, representing the minimum shipping cost. The findings highlight optimal material flow between plants, warehouses, and customers, recommending minimal movement between warehouses and focusing on plant-to-warehouse shipments. Furthermore, the study suggests minimizing transfers between customers. The report provides detailed findings, results, and recommendations for cost optimization within the supply chain.

Running head: SUPPLY CHAIN MODELLING AND DESIGN
Supply Chain Modelling and Design
Name of Student:
Name of University:
Author’s Note:
Supply Chain Modelling and Design
Name of Student:
Name of University:
Author’s Note:
Secure Best Marks with AI Grader
Need help grading? Try our AI Grader for instant feedback on your assignments.

1
SUPPLY CHAIN MODELLING AND DESIGN
Table of Contents
1. Executive Summary.....................................................................................................................2
2. Introduction ................................................................................................................................2
2.1 Decision variable...................................................................................................................2
2.2 Network Model......................................................................................................................2
2.3 Objective Function.................................................................................................................3
2.4 Define Constraints.................................................................................................................3
x1 = y1 and x1 = y2.....................................................................................................................3
2.5 Mathematical Model..............................................................................................................3
3. Discussion ................................................................................................................................4
3.1 Findings.................................................................................................................................4
3.2 Results and interpretations.....................................................................................................5
4. Recommendations........................................................................................................................5
5. Bibliography................................................................................................................................7

2
SUPPLY CHAIN MODELLING AND DESIGN
1. Executive Summary
The report aims to implement a simplex linear programming which will be conducive in
determining the minimum cost shipping strategy for a company which produces a potato product
at three plants delivered directly delivered to two customers, two warehouses or between the
plants. The research has depicted the network model and found the objective variable as 4460
which is the minimum minimum-cost shipping strategy using Lp solver in MS Excel. It has been
also recommended that the movement of the materials has been minimum among the individual
warehouses. In addition to this, the movement of materials from plant 3 to warehouse 1 has been
also interpreted as significantly low. Henceforth, the potato company needs to rely on the
movement of the materials from plant to warehouse rather than plant to customer or plant to
plant. It is also recommended that the company may also minimize the cost by avoiding the
transfer of material from one customer to another customer.
2. Introduction
In the given case a company produces a potato product at three plants which may be
delivered directly delivered to two customers, two warehouses or between the plants. This
transfer may be also considered among each other in an interchangeable manner. The cost
incurred in producing the potato is seen to be same at each plant and the company is concerned
with the keeping the shipping costs as low as possible in meeting the demands of the customer.
The solution has considered that “the cost (in thousands of dollars) of shipping a ton of the
product between each pair of locations” as it has been stated in the table. It has been further
considered that the road regulation does not allow more than 200 tons of the product between
any two nodes. The overall implementation of the simplex linear programming has been
conducive in determining the minimum cost shipping strategy.
2.1 Decision variable
The decision variables are considered with the changes in the demand from the three
plants, two warehouses and two customers.

3
SUPPLY CHAIN MODELLING AND DESIGN
2.2 Network Model
The above stated network diagram has been created by considering the lowest cost associated to
the transportation of the potatoes across plants, warehouse and customers with the minimum cost
possible.
2.3 Objective Function
The objective function is aimed to minimise the cost which are seen to be related to
minimise the cost shipping strategy. This objective function is addressed with the application of
linear programming model.
2.4 Define Constraints
In the given case the problem has been identified with minimizing the linear function to
linear constraints. The evaluated model has considered the sum of decision variables (x1) equal
to capacity (y1) for plant 1, plant 2 and plant 3. In addition to this, sum of decision variables (x1)
constraints are equal to customer demand (y2) for customer 1 and customer 2.
Henceforth, the minimization constraint is applied to sum of decision variables (x1), customer
demand (y2) and plant capacity (y1), subject to the constraints
x1 = y1 and x1 = y2
In addition to this the minimization constraint is applied to x1 subject to the constraints
x1 <= 200
2.5 Mathematical Model
The application of the mathematical model in the given case has been applied with the
C2P1 P3 P3 W1 W2 C1
200 30 20 20200 200
Secure Best Marks with AI Grader
Need help grading? Try our AI Grader for instant feedback on your assignments.

4
SUPPLY CHAIN MODELLING AND DESIGN
∑ (x1 x z1) or ∑ (x1j x z1) = +mj
In the given model in case the:
“x1” refers to the node to node summation of the decision variables from combination from
delivery between two customers, two warehouses or between the plants.
“z1” refers to the “cost (in thousands of dollars) of shipping a ton of the product between each
pair of locations”
“x1j” refers to the node to node summation of the decision variables from individual plant
warehouse or customers.
“mj”, as simplex Lp is implemented in the given study only positive objective value has been
considered for the compute dataset.
3. Discussion
The solution has been computed in MS Excel with the use of solver to compute the
objective value. The constraints of the decision variable have been unconstrained to consider
them as Non-Negative.
3.1 Findings
To
From Plant 1 Plant 2 Plant 3 Warehouse 1 Warehouse 2 Customer 1 Customer 2
Plant 1 0 0 0 0 20 180 0
Plant 2 0 0 0 20 180 0 0
Plant 3 0 0 170 180 0 0 0
Warehouse 1 0 0 0 0 0 0 0
Warehouse 2 0 0 0 0 0 0 0
Customer 1 200 200 30 0 0 0 0
Customer 2 0 0 0 0 0 20 200
200 200 200 200 200 200 200
<= <= <= <= <= <= <=
Limit 200 200 200 200 200 200 200

5
SUPPLY CHAIN MODELLING AND DESIGN
Objective Value 4460
Minimized
Demand/
Capacity Limit
Plant 1 200 = 200
Plant 2 200 = 200
Plant 3 350 = 350
Warehouse 1 0 = 0
Warehouse 2 0 = 0
Customer 1 430 = 500
Customer 2 220 = 220
3.2 Results and interpretations
The objective value or the minimum shipping is evaluated as 4460. In addition to this the
minimum cost of transportation from Plant 1 and Plant 2 to customer 1 is 200. The cost of
transportation from plant 3 to customer 1 is 30. The evaluation of cost for the transportation from
warehouse 1 to plant 2 is 20 and warehouse 1 to plant 3 is 180. The cost for transportation from
warehouse 2 to plant 1 is 20 and warehouse 2 to plant 2 is 180. Furthermore, the minimum
transportation cost from Plant 1 to Customer 1 is evaluated as 180 and customer 1 to customer 2
is 20.

6
SUPPLY CHAIN MODELLING AND DESIGN
4. Recommendations
The main depictions made from the mathematical model have shown that cost between
the movement of the materials has been minimum among the individual warehouses. In addition
to this, the movement of materials from plant 3 to warehouse 1 has been also interpreted as
significantly low. The company may also minimize the cost by avoiding the transfer of material
from one customer to another customer.
Paraphrase This Document
Need a fresh take? Get an instant paraphrase of this document with our AI Paraphraser

7
SUPPLY CHAIN MODELLING AND DESIGN
5. Bibliography
Solow, D., 2014. Linear programming: An introduction to finite improvement algorithms.
Courier Corporation.
Wan, S.P., Wang, F., Lin, L.L. and Dong, J.Y., 2015. An intuitionistic fuzzy linear programming
method for logistics outsourcing provider selection. Knowledge-Based Systems, 82, pp.80-94.

8
SUPPLY CHAIN MODELLING AND DESIGN
1 out of 9

Your All-in-One AI-Powered Toolkit for Academic Success.
+13062052269
info@desklib.com
Available 24*7 on WhatsApp / Email
Unlock your academic potential
© 2024 | Zucol Services PVT LTD | All rights reserved.