Analysis of Customer Complaints and Supply Chain Analytics: A Report

Verified

Added on  2020/03/07

|7
|1279
|75
Report
AI Summary
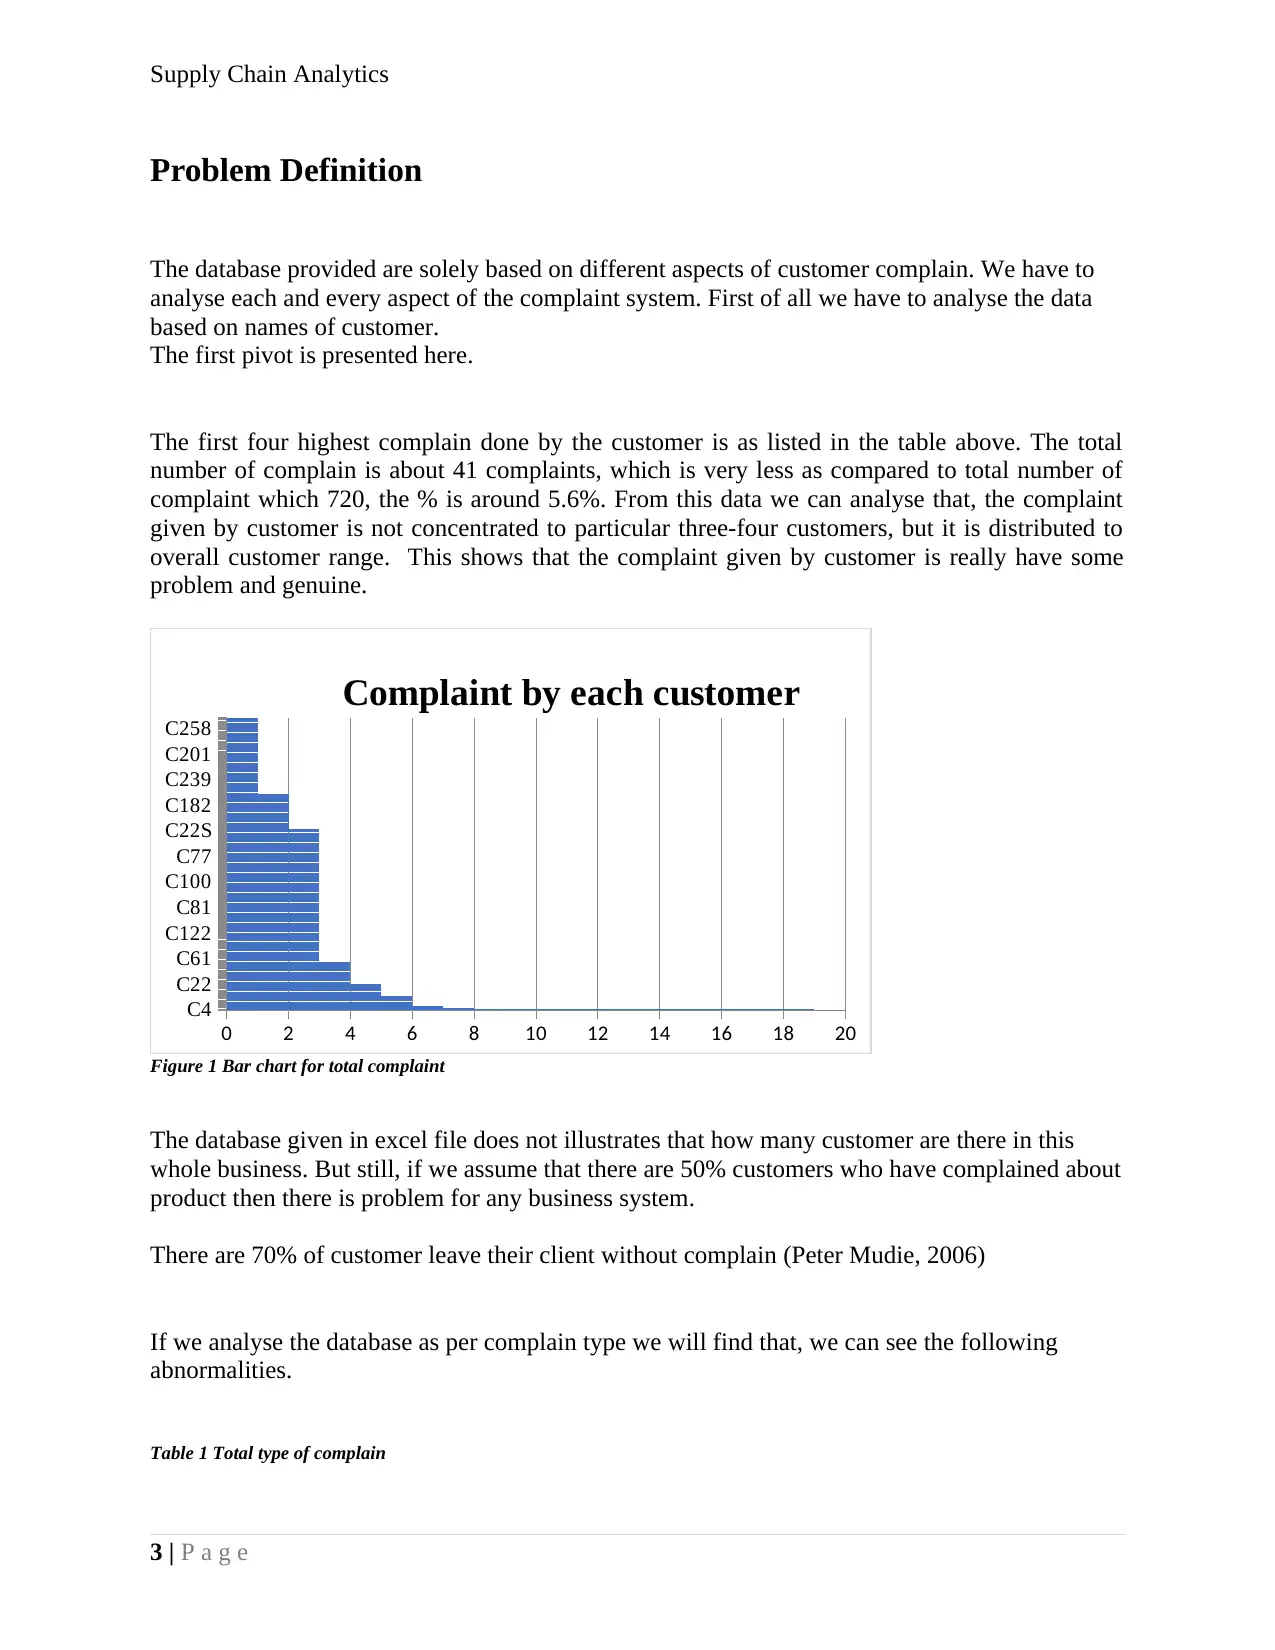
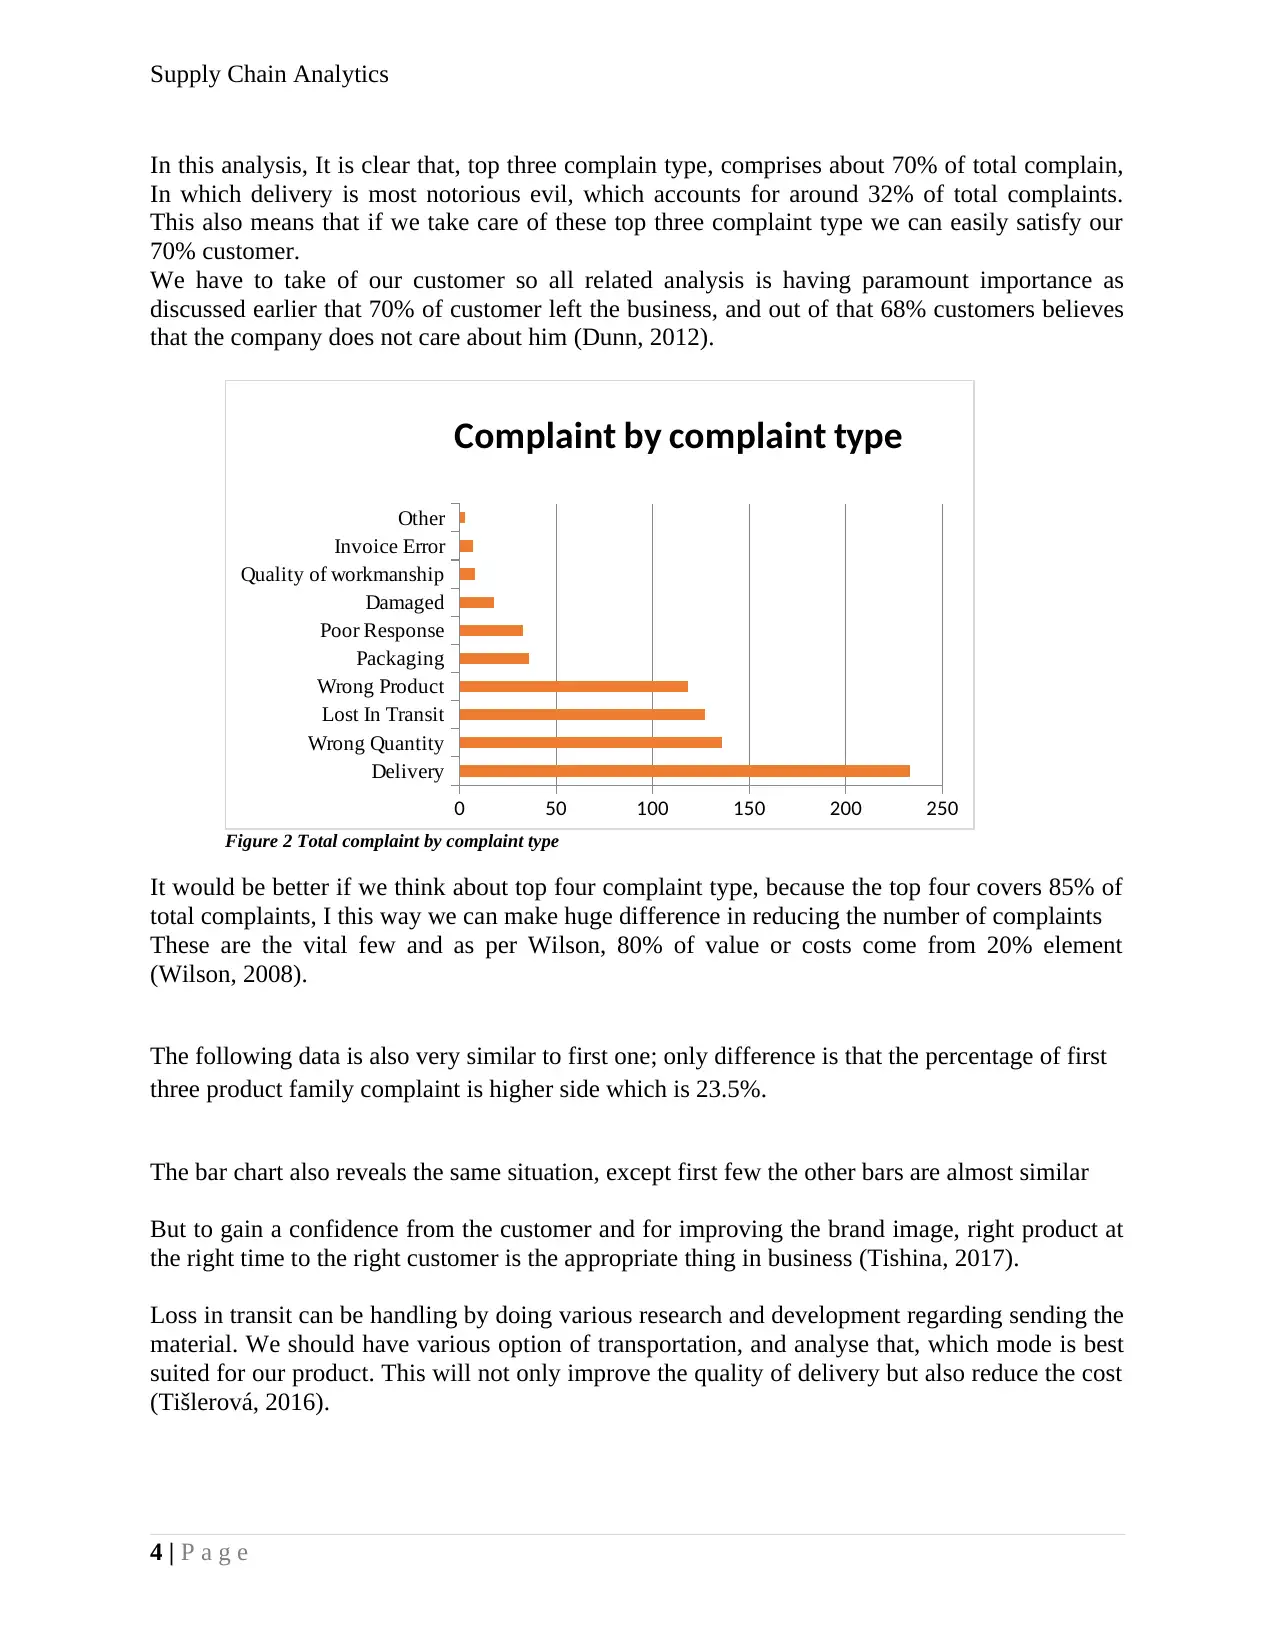
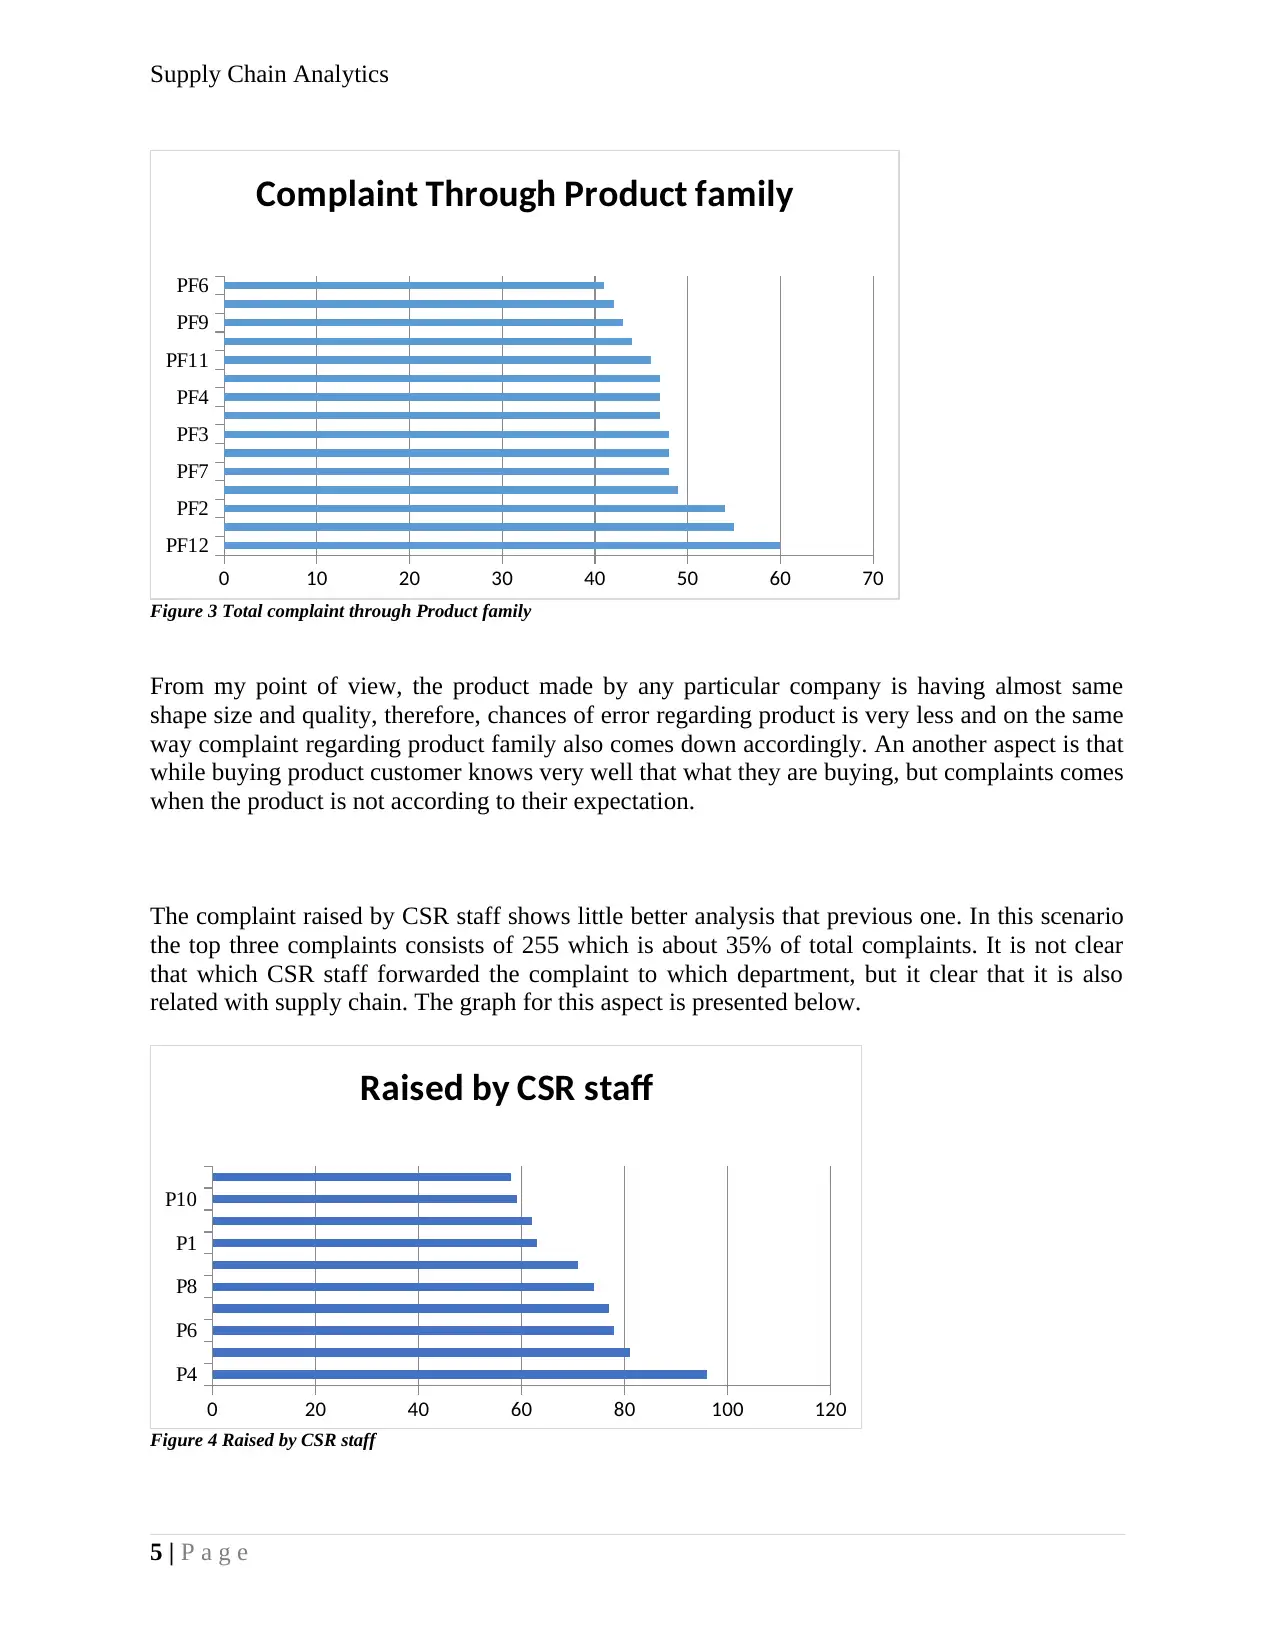
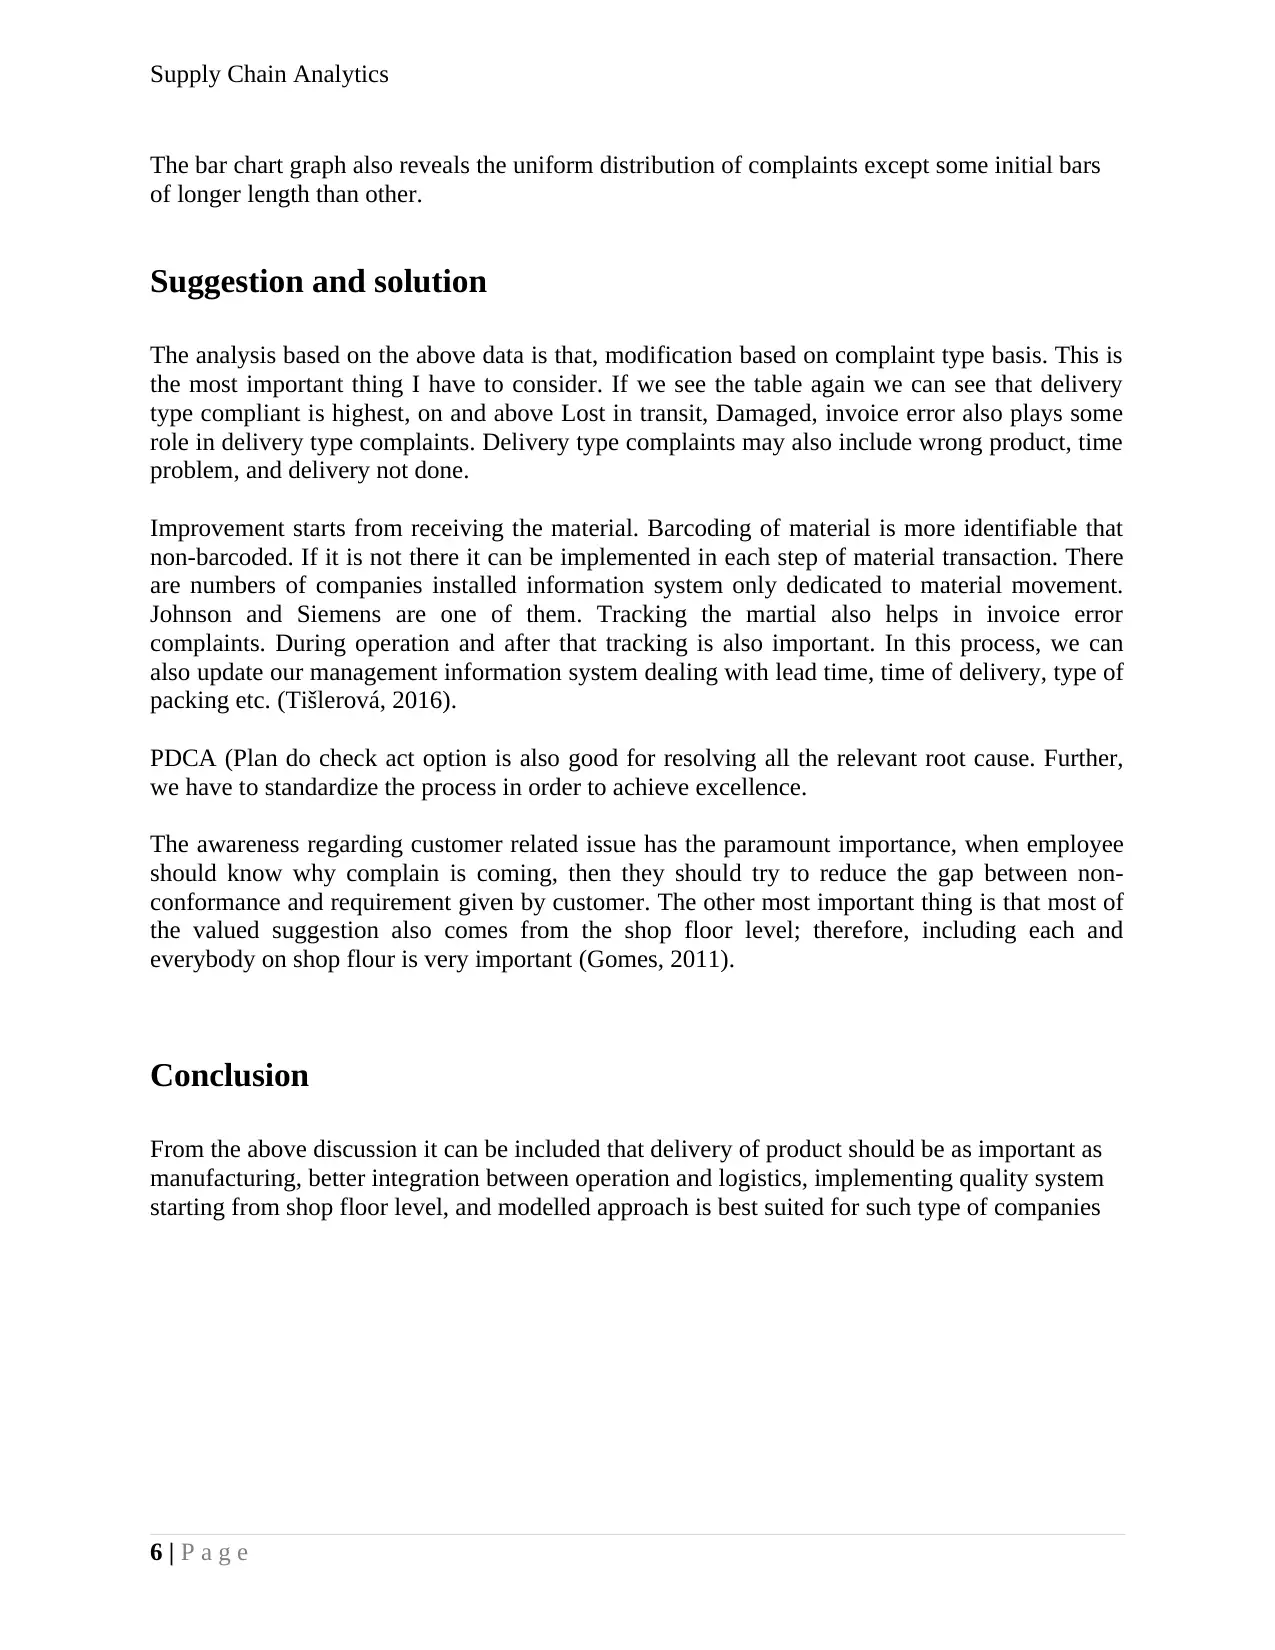
This report presents an analysis of customer complaints within a supply chain context, examining various aspects of the complaint system. The analysis begins by assessing customer-specific complaints, revealing that complaints are distributed across a wide customer base, suggesting genuine issues. The report then delves into complaint types, highlighting that delivery-related issues constitute a significant portion of total complaints. Further investigation into product families and CSR staff-related complaints provides additional insights into the root causes of customer dissatisfaction. The report suggests solutions based on the data analysis, emphasizing modifications based on complaint type, particularly delivery-related issues. Recommendations include improvements in material handling, tracking systems, and the implementation of quality systems. The report concludes by emphasizing the importance of integrating operations and logistics, and adopting a modeled approach for resolving customer complaints.
Document Page
Supply Chain Analytics
1 | P a g e
Value chain engineering systems
tabler-icon-diamond-filled.svg

Secure Best Marks with AI Grader

Need help grading? Try our AI Grader for instant feedback on your assignments.
Document Page
Supply Chain Analytics
Contents
Problem Definition..........................................................................................................................2
Suggestion and solution...................................................................................................................6
Conclusion.......................................................................................................................................6
Bibliography....................................................................................................................................7
2 | P a g e
Document Page
Supply Chain Analytics
Problem Definition
The database provided are solely based on different aspects of customer complain. We have to
analyse each and every aspect of the complaint system. First of all we have to analyse the data
based on names of customer.
The first pivot is presented here.
The first four highest complain done by the customer is as listed in the table above. The total
number of complain is about 41 complaints, which is very less as compared to total number of
complaint which 720, the % is around 5.6%. From this data we can analyse that, the complaint
given by customer is not concentrated to particular three-four customers, but it is distributed to
overall customer range. This shows that the complaint given by customer is really have some
problem and genuine.
C4
C22
C61
C122
C81
C100
C77
C22S
C182
C239
C201
C258
0 2 4 6 8 10 12 14 16 18 20
Complaint by each customer
Figure 1 Bar chart for total complaint
The database given in excel file does not illustrates that how many customer are there in this
whole business. But still, if we assume that there are 50% customers who have complained about
product then there is problem for any business system.
There are 70% of customer leave their client without complain (Peter Mudie, 2006)
If we analyse the database as per complain type we will find that, we can see the following
abnormalities.
Table 1 Total type of complain
3 | P a g e
Document Page
Supply Chain Analytics
In this analysis, It is clear that, top three complain type, comprises about 70% of total complain,
In which delivery is most notorious evil, which accounts for around 32% of total complaints.
This also means that if we take care of these top three complaint type we can easily satisfy our
70% customer.
We have to take of our customer so all related analysis is having paramount importance as
discussed earlier that 70% of customer left the business, and out of that 68% customers believes
that the company does not care about him (Dunn, 2012).
Delivery
Wrong Quantity
Lost In Transit
Wrong Product
Packaging
Poor Response
Damaged
Quality of workmanship
Invoice Error
Other
0 50 100 150 200 250
Complaint by complaint type
Figure 2 Total complaint by complaint type
It would be better if we think about top four complaint type, because the top four covers 85% of
total complaints, I this way we can make huge difference in reducing the number of complaints
These are the vital few and as per Wilson, 80% of value or costs come from 20% element
(Wilson, 2008).
The following data is also very similar to first one; only difference is that the percentage of first
three product family complaint is higher side which is 23.5%.
The bar chart also reveals the same situation, except first few the other bars are almost similar
But to gain a confidence from the customer and for improving the brand image, right product at
the right time to the right customer is the appropriate thing in business (Tishina, 2017).
Loss in transit can be handling by doing various research and development regarding sending the
material. We should have various option of transportation, and analyse that, which mode is best
suited for our product. This will not only improve the quality of delivery but also reduce the cost
(Tišlerová, 2016).
4 | P a g e
tabler-icon-diamond-filled.svg

Secure Best Marks with AI Grader

Need help grading? Try our AI Grader for instant feedback on your assignments.
Document Page
Supply Chain Analytics
PF12
PF2
PF7
PF3
PF4
PF11
PF9
PF6
0 10 20 30 40 50 60 70
Complaint Through Product family
Figure 3 Total complaint through Product family
From my point of view, the product made by any particular company is having almost same
shape size and quality, therefore, chances of error regarding product is very less and on the same
way complaint regarding product family also comes down accordingly. An another aspect is that
while buying product customer knows very well that what they are buying, but complaints comes
when the product is not according to their expectation.
The complaint raised by CSR staff shows little better analysis that previous one. In this scenario
the top three complaints consists of 255 which is about 35% of total complaints. It is not clear
that which CSR staff forwarded the complaint to which department, but it clear that it is also
related with supply chain. The graph for this aspect is presented below.
P4
P6
P8
P1
P10
0 20 40 60 80 100 120
Raised by CSR staff
Figure 4 Raised by CSR staff
5 | P a g e
Document Page
Supply Chain Analytics
The bar chart graph also reveals the uniform distribution of complaints except some initial bars
of longer length than other.
Suggestion and solution
The analysis based on the above data is that, modification based on complaint type basis. This is
the most important thing I have to consider. If we see the table again we can see that delivery
type compliant is highest, on and above Lost in transit, Damaged, invoice error also plays some
role in delivery type complaints. Delivery type complaints may also include wrong product, time
problem, and delivery not done.
Improvement starts from receiving the material. Barcoding of material is more identifiable that
non-barcoded. If it is not there it can be implemented in each step of material transaction. There
are numbers of companies installed information system only dedicated to material movement.
Johnson and Siemens are one of them. Tracking the martial also helps in invoice error
complaints. During operation and after that tracking is also important. In this process, we can
also update our management information system dealing with lead time, time of delivery, type of
packing etc. (Tišlerová, 2016).
PDCA (Plan do check act option is also good for resolving all the relevant root cause. Further,
we have to standardize the process in order to achieve excellence.
The awareness regarding customer related issue has the paramount importance, when employee
should know why complain is coming, then they should try to reduce the gap between non-
conformance and requirement given by customer. The other most important thing is that most of
the valued suggestion also comes from the shop floor level; therefore, including each and
everybody on shop flour is very important (Gomes, 2011).
Conclusion
From the above discussion it can be included that delivery of product should be as important as
manufacturing, better integration between operation and logistics, implementing quality system
starting from shop floor level, and modelled approach is best suited for such type of companies
6 | P a g e
Document Page
Supply Chain Analytics
Bibliography
Dunn, P, 2012, The Firm of the Future. 1st ed. 2012: Wiley.
Gomes, R., 2011, Physical Distribution Service. Jams, 1(1), pp. 1-10.
Gulc, A, 2017, Models and Methods of Measuring the Quality of Logistic Service. Project, and
Production Management, 255(264), pp. 1-10.
Peter Mudie, A. C, 2006, The Management and Marketing of Services. 3rd ed. Oxford:
Butterworth-Heinemann.
Tishina, 2017, The management level of logistics. icie 2017, 1(6), pp. 1-6.
Tišlerová, K, 2016. Management of Customer Service in Terms of. Research Article, 1(1), pp. 1-
5.
Wilson, G, 2008, Managing Quality. 2nd ed. New York: Routledge.
7 | P a g e
chevron_up_icon
1 out of 7
circle_padding
hide_on_mobile
zoom_out_icon
logo.png

Your All-in-One AI-Powered Toolkit for Academic Success.

Available 24*7 on WhatsApp / Email

[object Object]