Supply Chain, Demand, and Elasticity Analysis: BEO1105 Assignment

Verified

Added on  2022/10/19

|11
|1606
|18
Homework Assignment
AI Summary
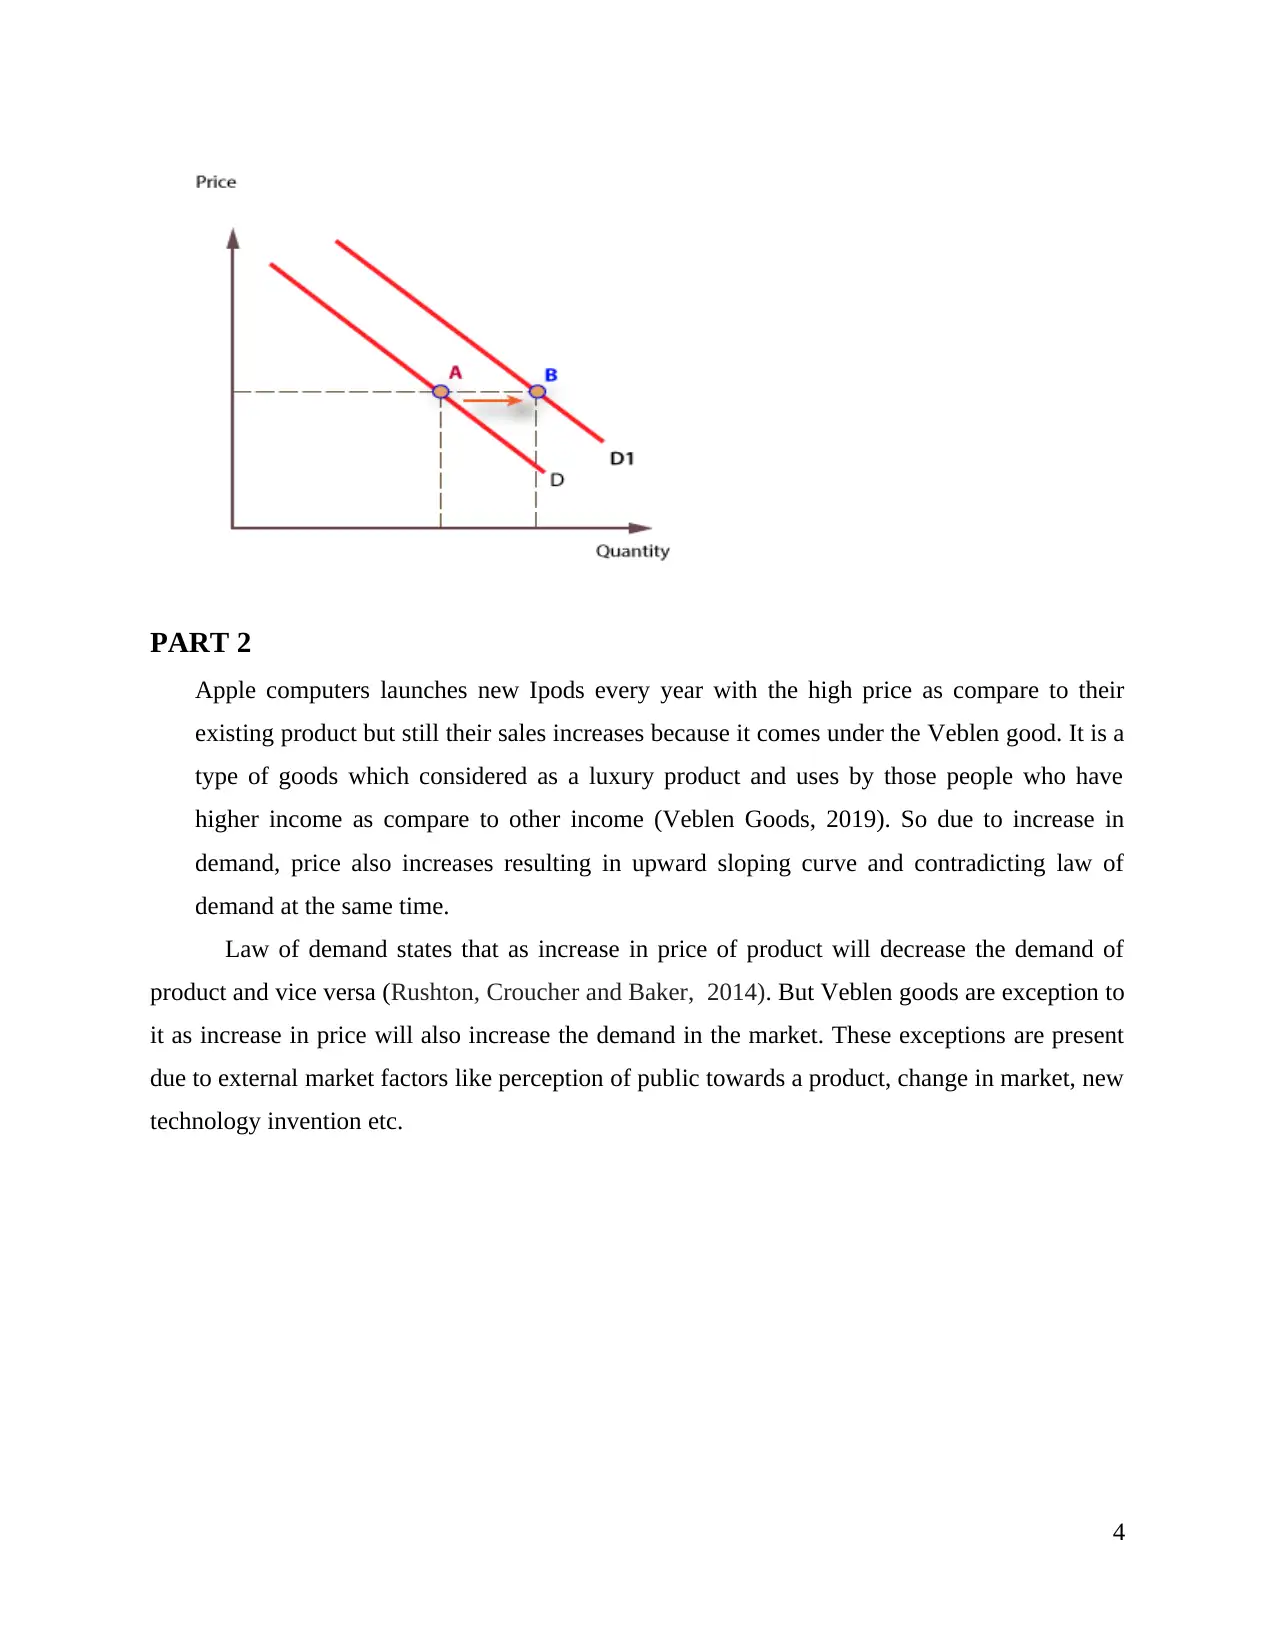
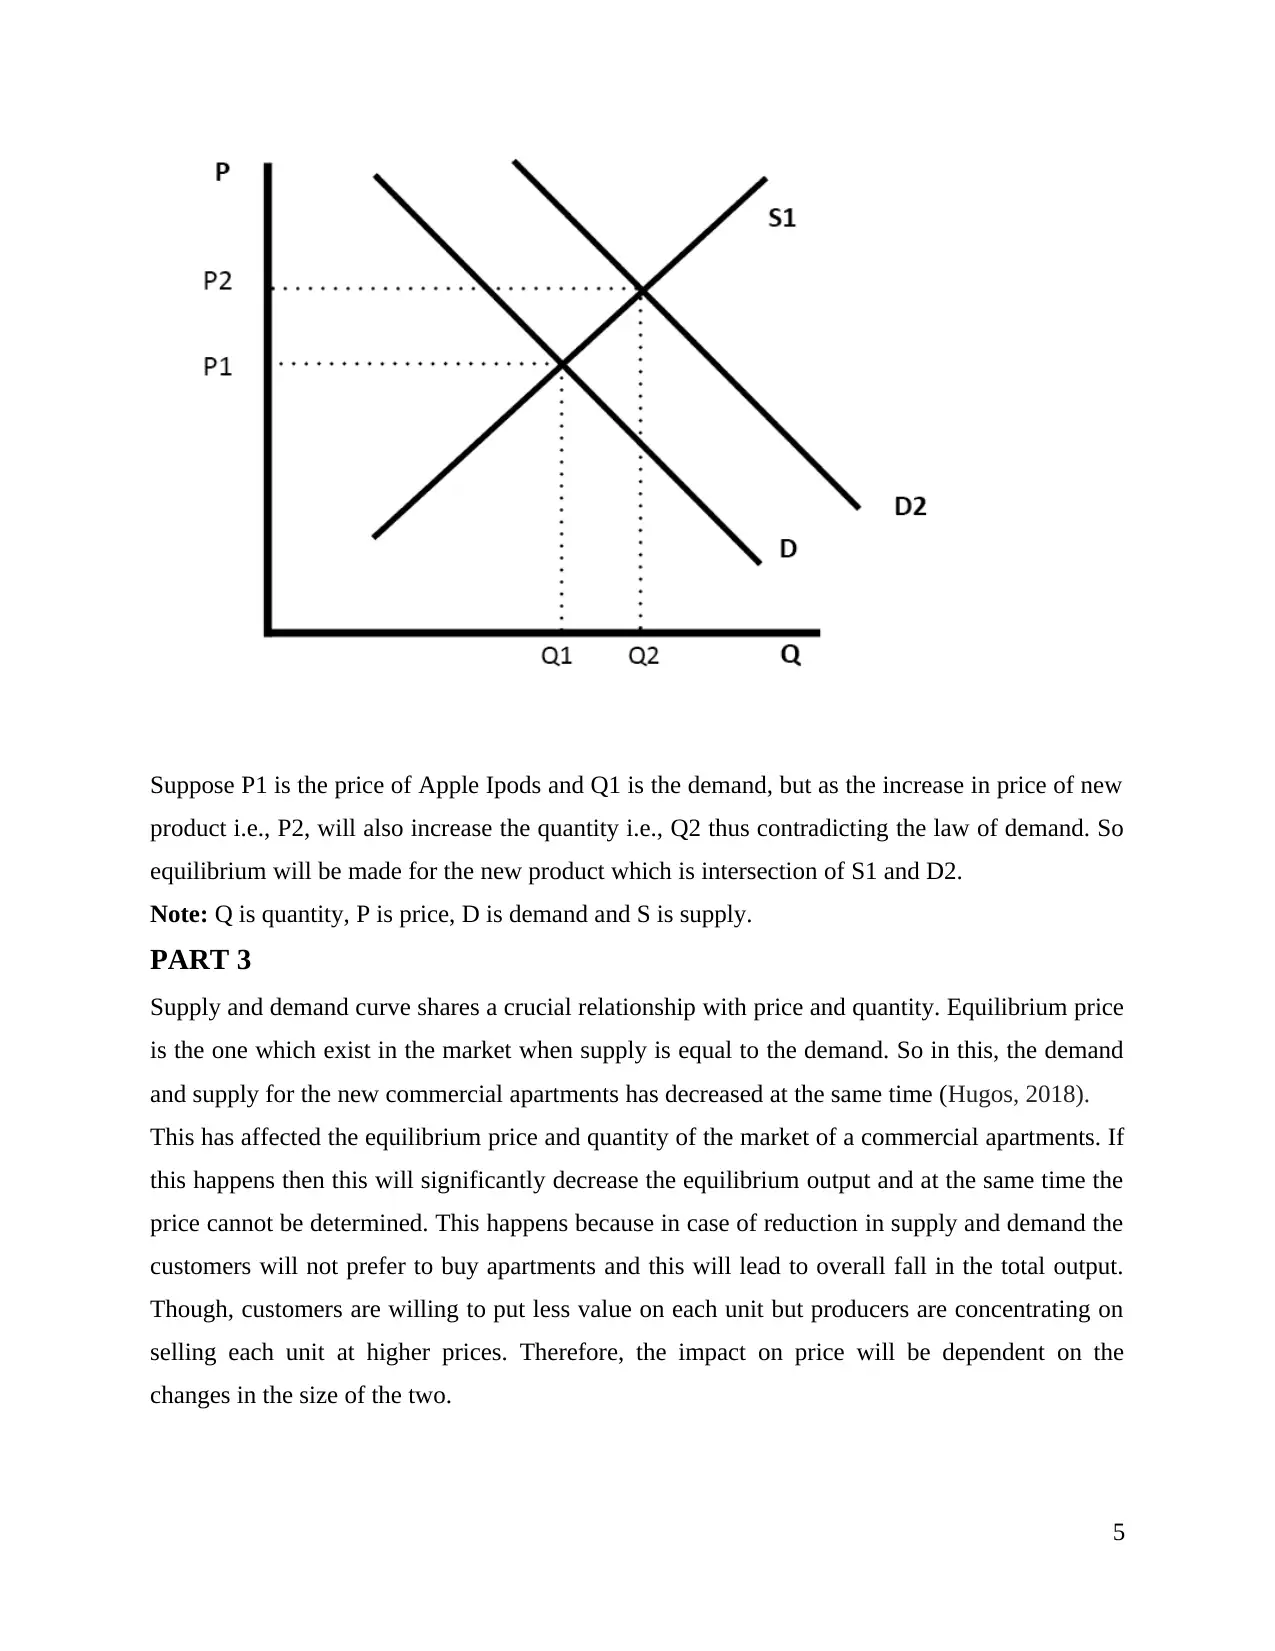
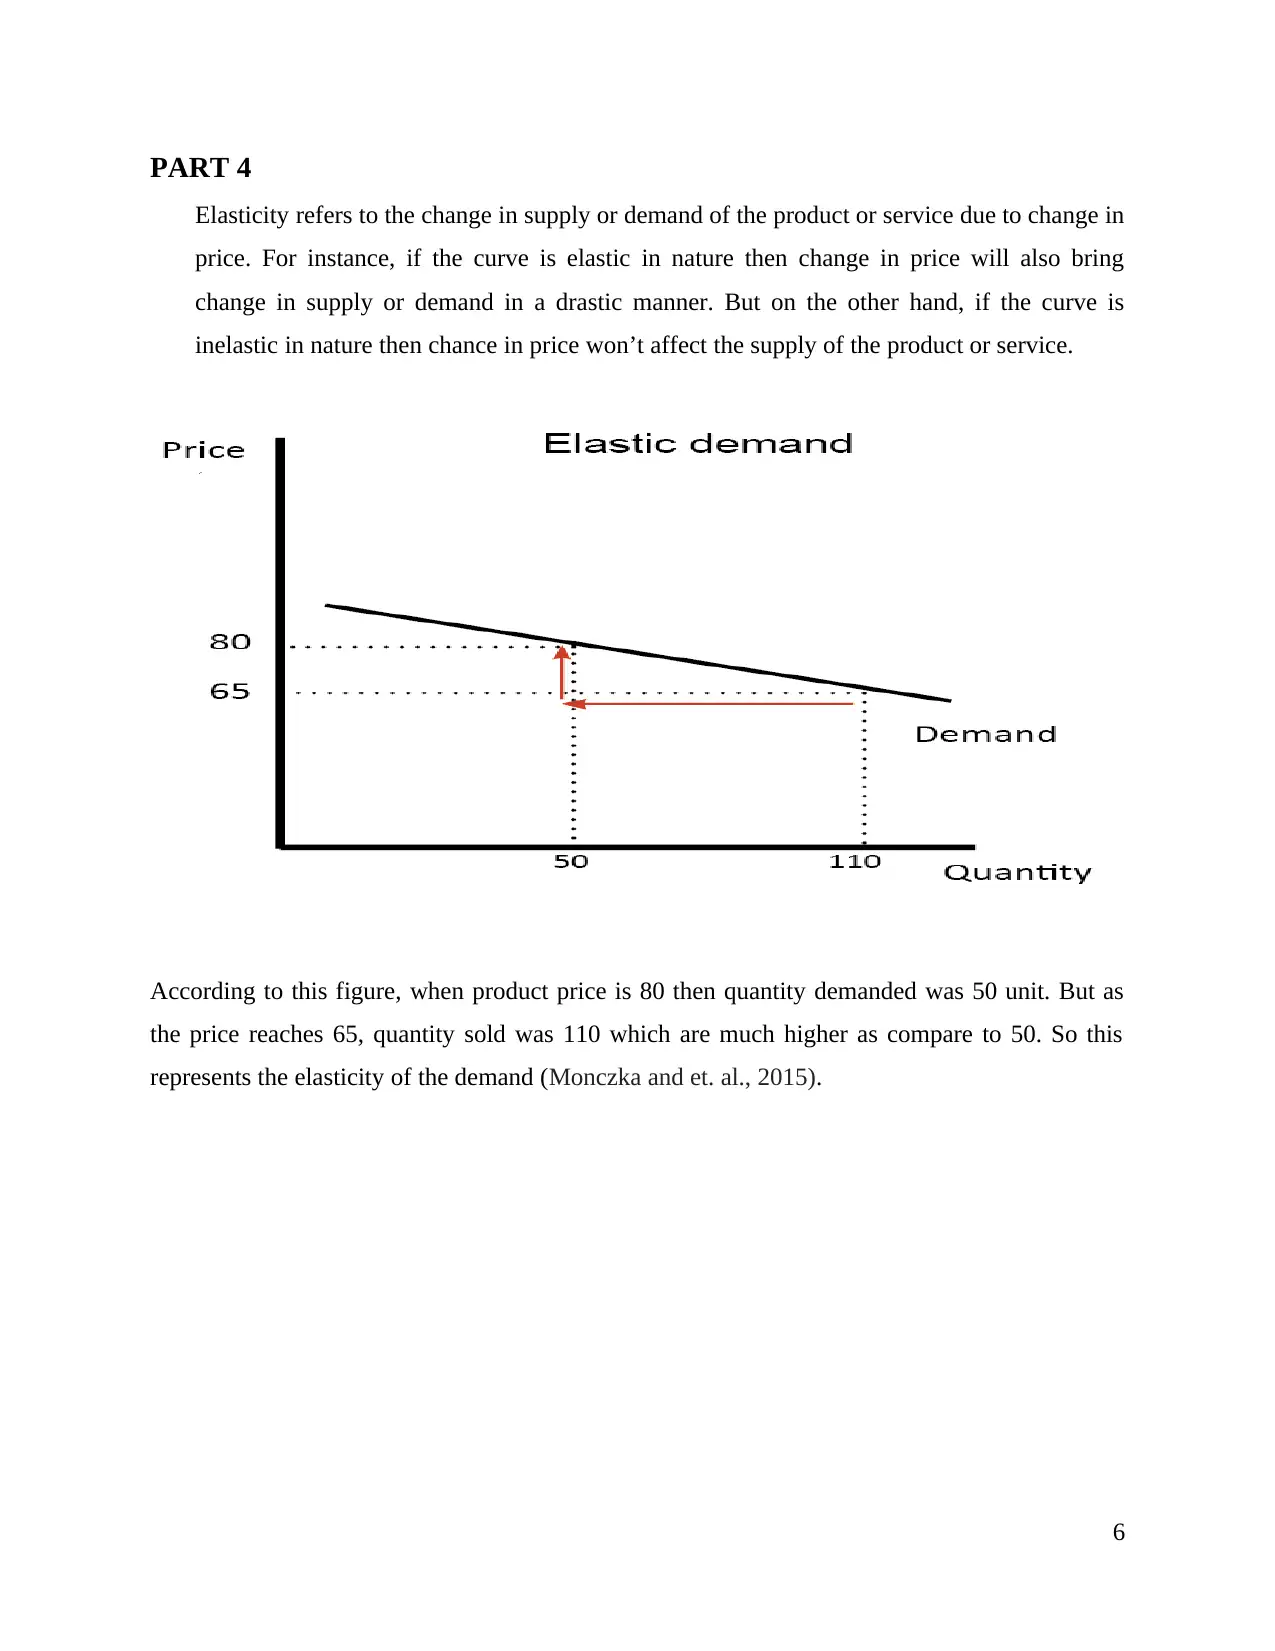
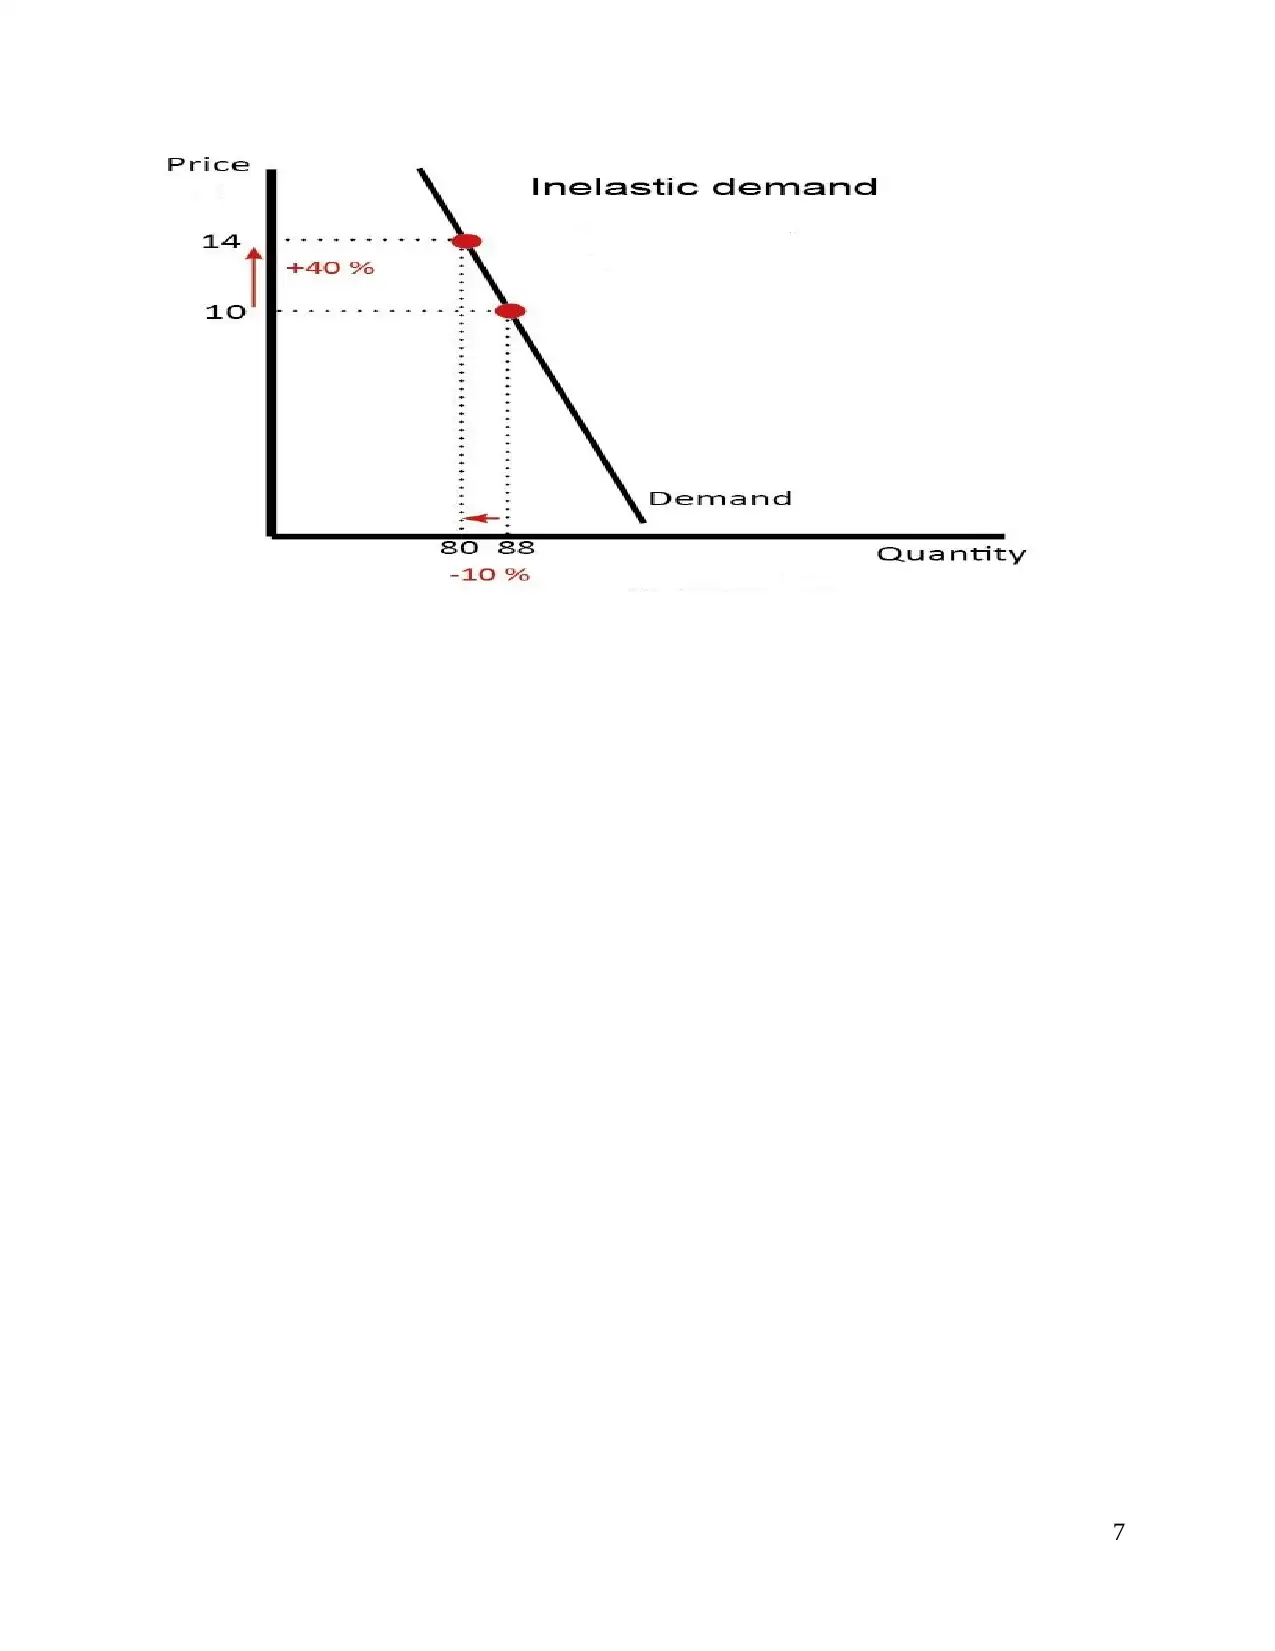
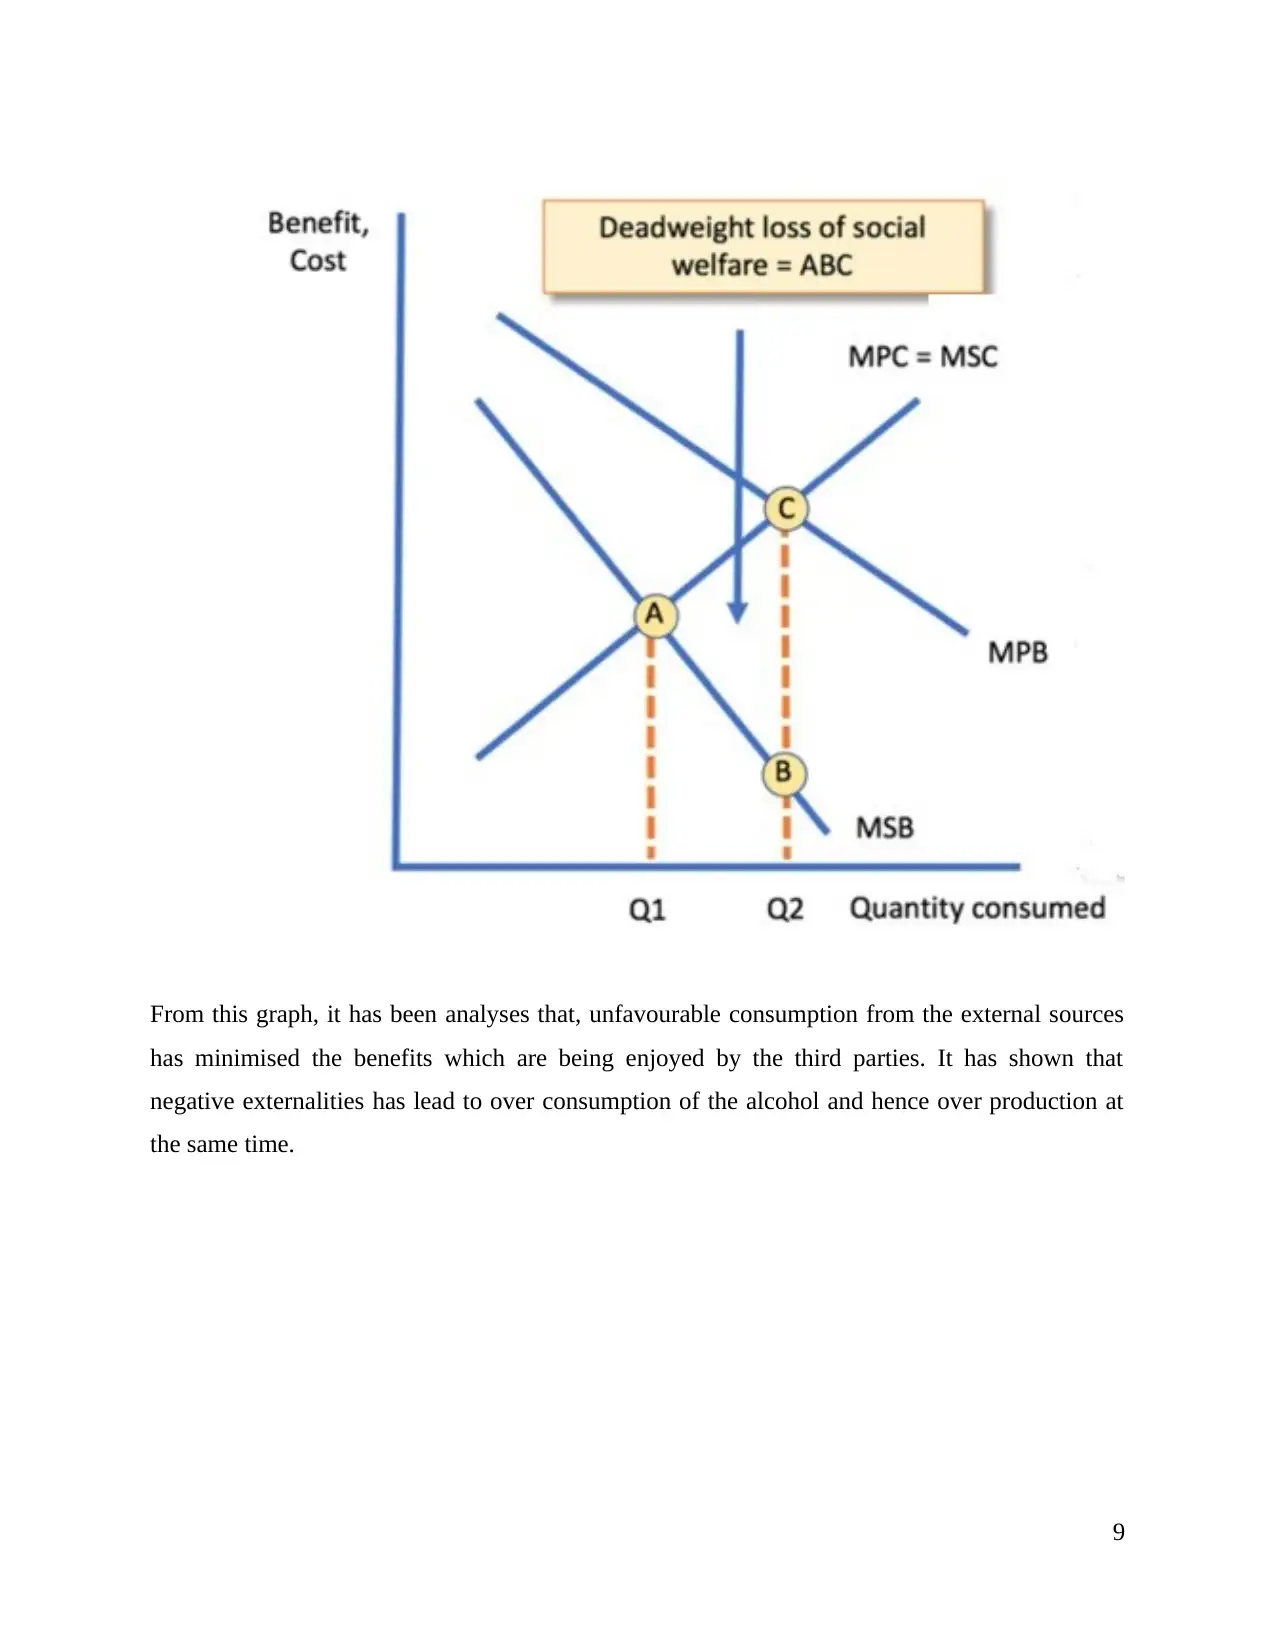
This assignment analyzes supply chain dynamics, demand and supply principles, and elasticity concepts through several real-world examples. The report begins by examining the impact of a poor French wine grape harvest on both the French and Australian wine markets, including shifts in demand and the resulting changes in market equilibrium. It then explores the concept of Veblen goods using Apple's iPods as an example, demonstrating how the law of demand can be contradicted in certain market conditions. The assignment also delves into the relationship between supply and demand curves, specifically addressing how simultaneous decreases in both affect market equilibrium. Further, it covers price elasticity, showing both elastic and inelastic demand curves through examples and calculations. Finally, the assignment considers the potential impact of government intervention, such as setting minimum prices on alcohol, to address market failures and negative externalities, providing a comprehensive overview of economic principles.
Document Page
SUPPLY CHAIN
1
tabler-icon-diamond-filled.svg

Paraphrase This Document

Need a fresh take? Get an instant paraphrase of this document with our AI Paraphraser
Document Page
Contents
SUPPLY CHAIN.............................................................................................................................1
INTRODUCTION...........................................................................................................................3
PART 1............................................................................................................................................3
PART 2............................................................................................................................................4
PART 3............................................................................................................................................5
PART 4............................................................................................................................................6
PART 5............................................................................................................................................8
CONCLUSION..............................................................................................................................10
REFERENCE................................................................................................................................11
2
Document Page
INTRODUCTION
Demand and supply of the product or service is inversely proportionate to each other as if
one rises then other will decrease with the same rate (Wisner, Tan and et. al., 2014). In this
report, different cases will be considered to explain the concept of demand and supply and
how it changes according to the circumstances. Besides this, various examples and
calculation will be used to determine law of demand and it changes its elasticity according to
customers and external environment.
PART 1
Market of French wines
According to sources, 71% of total grape produced in the world is used for making wines
which shows the importance of grapes while producing wines (Grapes, 2019). Due to bad harvest
of grape, taste and intoxication level of wines affected in a bad way which leads to decrease in
sales of French wines. Due to bad harvest, consumers are switching their brands to Australian
wines due to which sales of French wines have decreased to a certain level.
French wine affect Australian wine
As mentioned in the article, poor wine grape harvest leads to phenomenon called scarcity
principle in which equilibrium changes due to increase in limited supply of goods and high
demands results in mismatch between both the components. For instance, people who are using
French wine will shift to Australian wine due to poor quality of grape which leads to increase in
demand of Australian wine. Instance increase in demand of wine will shift the demand curve to
the right which would also increase price of the product (Brandenburg and et. al., 2014).
As mentioned in the picture, Equilibrium before the market was on point A, but due to increase
in demand D points reaches D1 resulting in new formation of equilibrium at point B . So it can
be summarise in the last that poor harvesting of grape has increase demand of Australian wine as
well as their prices.
3
Document Page
PART 2
Apple computers launches new Ipods every year with the high price as compare to their
existing product but still their sales increases because it comes under the Veblen good. It is a
type of goods which considered as a luxury product and uses by those people who have
higher income as compare to other income (Veblen Goods, 2019). So due to increase in
demand, price also increases resulting in upward sloping curve and contradicting law of
demand at the same time.
Law of demand states that as increase in price of product will decrease the demand of
product and vice versa (Rushton, Croucher and Baker, 2014). But Veblen goods are exception to
it as increase in price will also increase the demand in the market. These exceptions are present
due to external market factors like perception of public towards a product, change in market, new
technology invention etc.
4
tabler-icon-diamond-filled.svg

Paraphrase This Document

Need a fresh take? Get an instant paraphrase of this document with our AI Paraphraser
Document Page
Suppose P1 is the price of Apple Ipods and Q1 is the demand, but as the increase in price of new
product i.e., P2, will also increase the quantity i.e., Q2 thus contradicting the law of demand. So
equilibrium will be made for the new product which is intersection of S1 and D2.
Note: Q is quantity, P is price, D is demand and S is supply.
PART 3
Supply and demand curve shares a crucial relationship with price and quantity. Equilibrium price
is the one which exist in the market when supply is equal to the demand. So in this, the demand
and supply for the new commercial apartments has decreased at the same time (Hugos, 2018).
This has affected the equilibrium price and quantity of the market of a commercial apartments. If
this happens then this will significantly decrease the equilibrium output and at the same time the
price cannot be determined. This happens because in case of reduction in supply and demand the
customers will not prefer to buy apartments and this will lead to overall fall in the total output.
Though, customers are willing to put less value on each unit but producers are concentrating on
selling each unit at higher prices. Therefore, the impact on price will be dependent on the
changes in the size of the two.
5
Document Page
PART 4
Elasticity refers to the change in supply or demand of the product or service due to change in
price. For instance, if the curve is elastic in nature then change in price will also bring
change in supply or demand in a drastic manner. But on the other hand, if the curve is
inelastic in nature then chance in price won’t affect the supply of the product or service.
According to this figure, when product price is 80 then quantity demanded was 50 unit. But as
the price reaches 65, quantity sold was 110 which are much higher as compare to 50. So this
represents the elasticity of the demand (Monczka and et. al., 2015).
6
Document Page
7
tabler-icon-diamond-filled.svg

Paraphrase This Document

Need a fresh take? Get an instant paraphrase of this document with our AI Paraphraser
Document Page
In the above representation, when the price was 10 then unit demand was 88. But when the price
was increase by 40% i.e., 14 then there is only 10% change in demand of the product i.e., 80.
This shows the inelasticity demand curve.
Price Quantity Total revenue Marginal revenue
20 200 4000 0
18 280 504013 13
16 360 5760 9
14 440 6160 5
12 520 6240 1
10 600 6000 -3
8 680 5440 -7
6 760 4560 -11
For instance, when the price is decrease by 10% i.e., from 20 to 18 per unit, change in demand
was 40% which is drastic as compare to change in price. It shows the elasticity curve. In the
other example, when there is decrease in price by 13 % i.e., from 10 to 8 then fall in price was
only 20% which shows the inelasticity.
PART 5
As the Government of Australia is thinking to set the minimum price on alcohol for the intention
of minimising the risk of illness and health issues. This is important to do because drinking in
excessive quantity is leading to major health issues which leads to market failure and adding
social cost as well (Christopher, Martin and et. al., 2016). It further leads to absenteeism from
work, involving police in social justice and abusive behaviour with families and spouses, etc.
From the below mentioned diagram, it has been elaborated that the negative impact of alcohol
has lead to marginal social cost by exceeding marginal private cost which has lead to burden of
loss of social welfare. So therefore, if minimum prices will be set, then this will lead to less
consumption of alcohol.
8
Document Page
From this graph, it has been analyses that, unfavourable consumption from the external sources
has minimised the benefits which are being enjoyed by the third parties. It has shown that
negative externalities has lead to over consumption of the alcohol and hence over production at
the same time.
9
Document Page
CONCLUSION
From the above information, it can be summarised that companies need to increase their
supply of products and services according to supply as then only it would be possible for
them to enhance their market share as compared to their competitors. The demand and
supply curves are the ones which clearly explains that what impact this will have on certain
equilibrium prices and output of the products. This is very important to take into
consideration because it helps in analysing the market trends and demands.
10
tabler-icon-diamond-filled.svg

Paraphrase This Document

Need a fresh take? Get an instant paraphrase of this document with our AI Paraphraser
Document Page
REFERENCE
Books and Journals
Christopher, Martin. Logistics & supply chain management. Pearson UK, 2016.
Monczka, R.M., Handfield, R.B., Giunipero, L.C. and Patterson, J.L., 2015. Purchasing and
supply chain management. Cengage Learning.
Hugos, M.H., 2018. Essentials of supply chain management. John Wiley & Sons.
Rushton, A., Croucher, P. and Baker, P., 2014. The handbook of logistics and distribution
management: Understanding the supply chain. Kogan Page Publishers.
Brandenburg, M., Govindan, K., Sarkis, J. and Seuring, S., 2014. Quantitative models for
sustainable supply chain management: Developments and directions. European journal of
operational research. 233(2). pp.299-312.
Wisner, J.D., Tan, K.C. and Leong, G.K., 2014. Principles of supply chain management: A
balanced approach. Cengage Learning.
Online
Grapes. 2019. [Online]. Available Through: < https://cuesa.org/food/grapes>
Veblen Goods. 2019. [Online]. Available Through:
<https://corporatefinanceinstitute.com/resources/knowledge/economics/veblen-goods/>
11
chevron_up_icon
1 out of 11
circle_padding
hide_on_mobile
zoom_out_icon
[object Object]