Supply Chain Management Analysis: Food and Road Restaurants Report

Verified

Added on  2023/04/20

|31
|3281
|320
Report
AI Summary
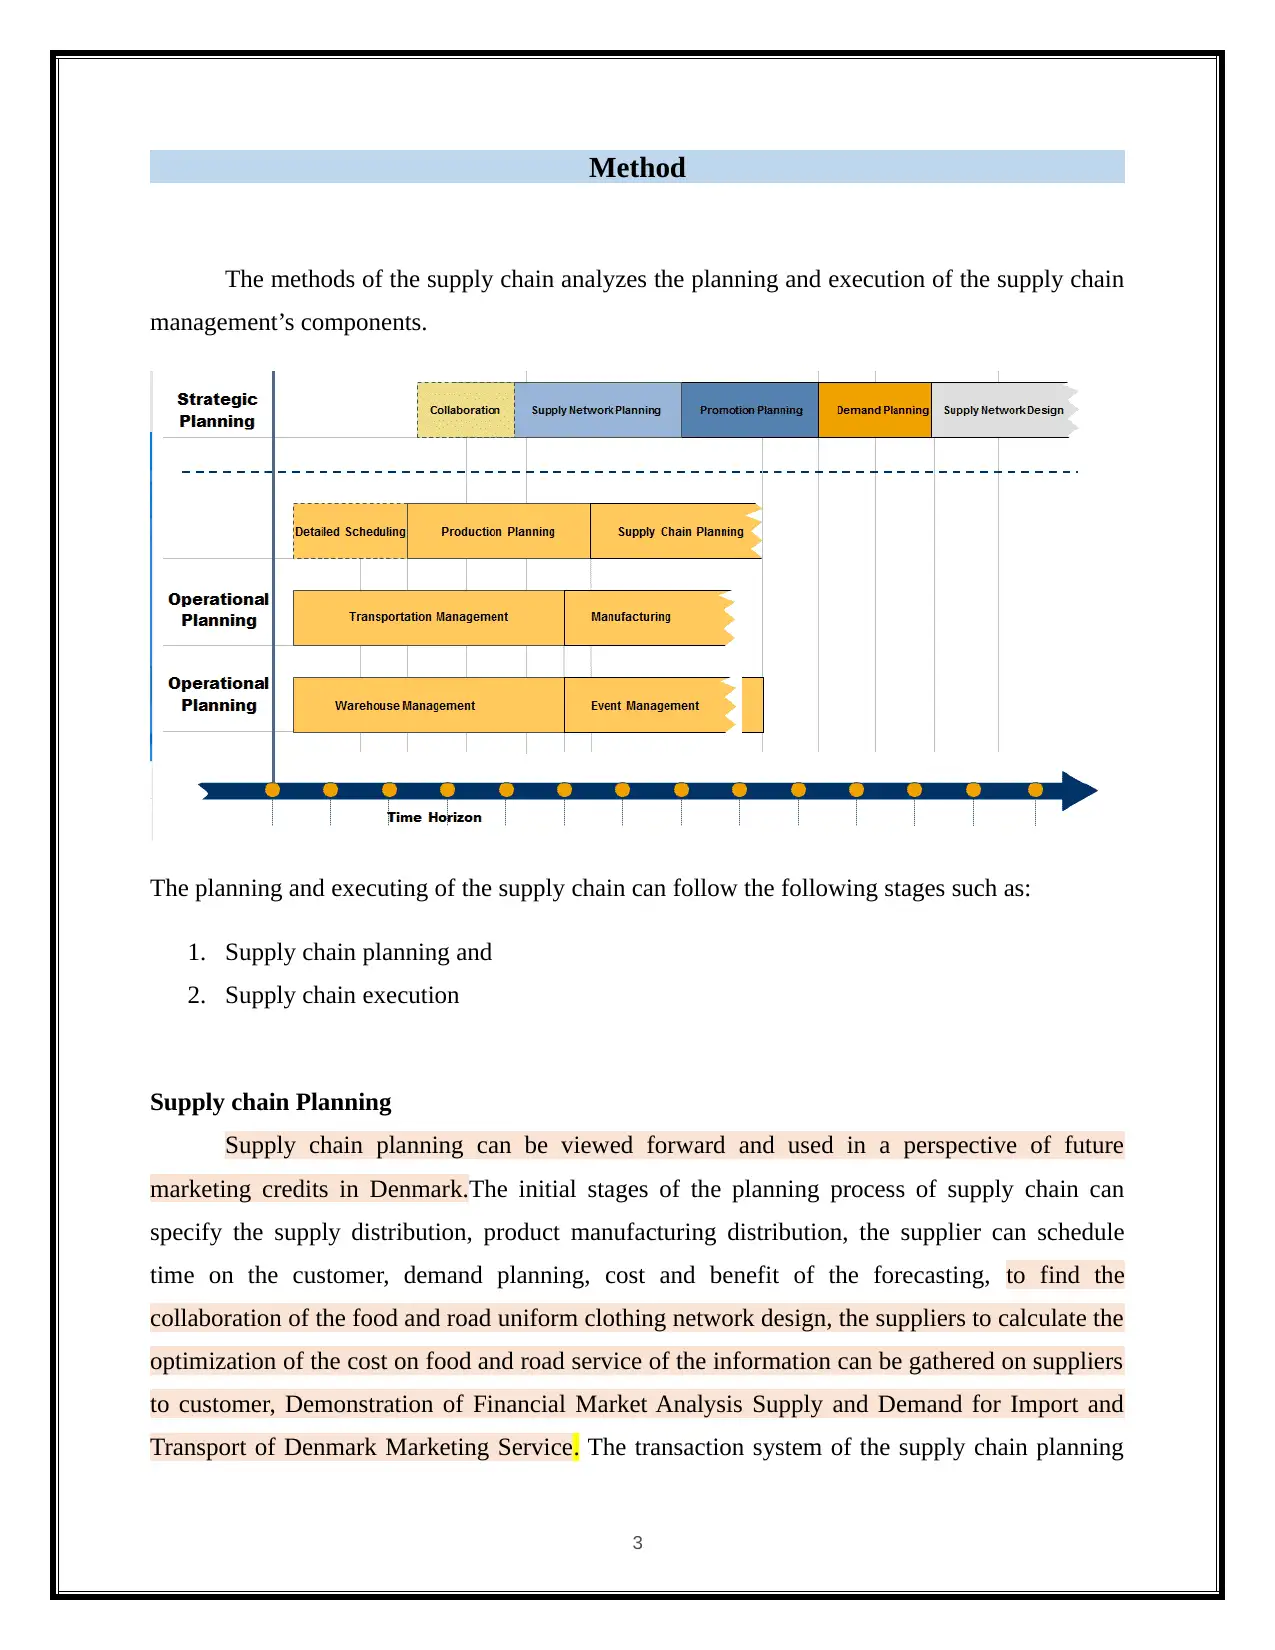
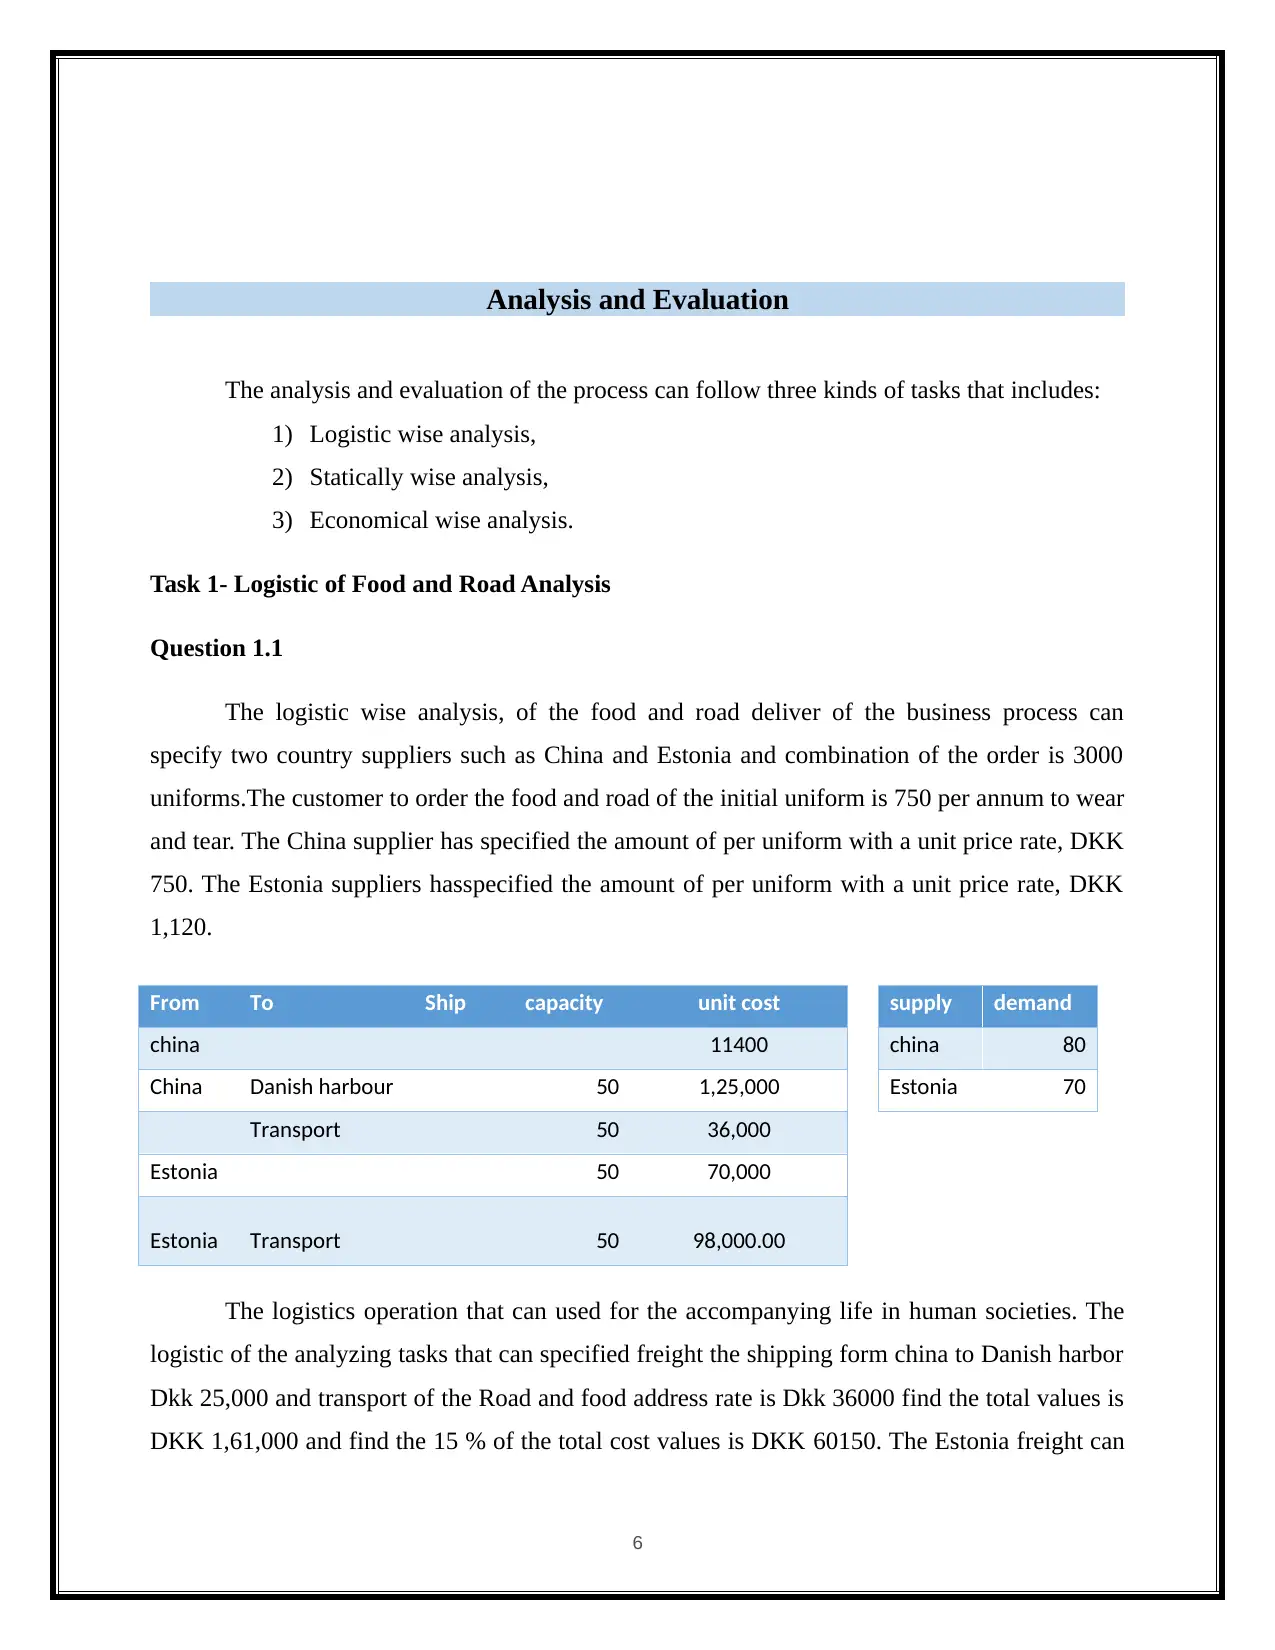
This report presents an analysis of logistics and supply chain management within the context of food and road restaurants. The study delves into various aspects, including the implementation of efficient supply chain systems, the challenges of food quality degradation, and the economic, environmental, and social benefits of effective supply chain operations. The report outlines a structured approach to the problem, encompassing problem definition, methodology, analysis, and evaluation. The methodology includes logistics-wise, statistical-wise, and economical-wise analyses, with a focus on supply chain planning and execution. The analysis involves calculations related to uniform orders from suppliers in China and Estonia, including cost, import calculations, and warehouse management. The report also covers transportation management, manufacturing analysis, and order management, culminating in an integrated supply chain planning and execution process. The findings offer insights into optimizing inventory, transport, and import calculations within a warehousing framework, providing key strategies for enhancing supply chain efficiency and profitability in the food industry.
tabler-icon-diamond-filled.svg

Contribute Materials

Your contribution can guide someone’s learning journey. Share your documents today.
Document Page
Logistics and Supply chain
Management
Name of the student:
Name of school:
Register Number:
Date:
Class/year
Word count:
tabler-icon-diamond-filled.svg

Secure Best Marks with AI Grader

Need help grading? Try our AI Grader for instant feedback on your assignments.
Document Page
Table of Contents
Introductory discussion of the Problem..................................................................................................................1
Problem definition................................................................................................................................................. 2
Method.................................................................................................................................................................. 3
Analysis and Evaluation......................................................................................................................................... 6
Conclusion........................................................................................................................................................... 16
Bibliography........................................................................................................................................................ 17
Attachment.......................................................................................................................................................... 18
Document Page
Introductory discussion of the Problem
The aim of this project is to implement logistics and supply chain management system in
the food and road restaurants, for delivering the foods to the customer. In food industry, the
quality of food product declines over time and should be addressed in the supply chain operation
management system. The delivery of food and managing the supply chains process operation and
management methods not only generates economic benefits, but also contributes to
environmental and social benefits. The process of managing and controlling signals provides
efficient and effective perspective. Additionally, it provides reviewing and planning of goods,
transportation and service information to meet the needs of the consumers and helps todeliver the
food to the consumers.The organization of business development and analysis of supply chain
management process can followthree methods which includes, the Logistic wise analysis,
Statistical wise analysis and Economical wise analysis. All these analyses will be investigated.
1
Document Page
Problem definition
Thechain management is able to take precautionary measures to move the suppliers and
customers into joint relationships for mutual benefit. Business workers who want to make
substantial impact on the efficiency or profitability of competitive companies need to know more
about its value for supply chain management, and the companies operating in a competitive
global marketin Denmark. The analysis of the segment of supply chain management system is
used for two purposes that includes, planning and execution components. The planning of the
supply chain activities such as schedule and planning of the operation manufacturing services,
supplier establishment, developing forecast demands, developingthe operation on the key
performance of efficient and cost effective Denmark’s the supply chain management. The
identification of the problem definition includes the following three ways:
Namely supplier(related to procurement),
Manufactures (production)
Retailers (delivery)
Each phase of the Chinese and Estonian companies will provide many facilities that are
uniformly distributed to supplier of logistic supply chain model. The supply chain management
roles can define the uniforms on Andorran designers related to the clothing design for food on
the roads, where the customer need to buy totally 3,000 uniforms. The analysis of the postal
service of the distribution of the market in Denmark has been used for a wide variety of services,
such an express delivery (to ensure that the delivery of the product is not delayed), courier
services, facility service, and mostly used on the electrical mail box.Supply chain strategic and
tactics have been implementing in the future Denmark analysis which specified the month wise,
year wise, week wise of the supply chain process management system.
The strategic supply chain planning and execution follows different kinds of operation
servicesrelated to the management system such as, the warehouse, transportation, manufacturing,
order list management and integrated supply chain management.
2
tabler-icon-diamond-filled.svg

Secure Best Marks with AI Grader

Need help grading? Try our AI Grader for instant feedback on your assignments.
Document Page
Method
The methods of the supply chain analyzes the planning and execution of the supply chain
management’s components.
The planning and executing of the supply chain can follow the following stages such as:
1. Supply chain planning and
2. Supply chain execution
Supply chain Planning
Supply chain planning can be viewed forward and used in a perspective of future
marketing credits in Denmark.The initial stages of the planning process of supply chain can
specify the supply distribution, product manufacturing distribution, the supplier can schedule
time on the customer, demand planning, cost and benefit of the forecasting, to find the
collaboration of the food and road uniform clothing network design, the suppliers to calculate the
optimization of the cost on food and road service of the information can be gathered on suppliers
to customer, Demonstration of Financial Market Analysis Supply and Demand for Import and
Transport of Denmark Marketing Service. The transaction system of the supply chain planning
3
Document Page
application analyzes the capabilities and finds the real-time demand commitments. The planning
of the supply chain process follows different stages that includes the following:
a) Network design and planning,
b) Capacity planning,
c) Demand cost and benefit planning,
d) Scheduling and manufacturing planning,
e) Distribution and deployment planning.
Supply chain execution
The main propose of the supply chain execution that can used for the gathering the order
and delivery information formcustomer to supplier chains of physical production, products of
raw material warehouse storage and movement, components of deliver products to the customer.
The interface of the supply chain management that are able understanding of the other
management system to resolve the cost and time secluding of the capacity production,
calculating the values of variable capacity requirement of production. The process of the supply
chain execution of the management includes, the order, inventory, warehouse, and transport
using the logistics analysis. The execution of the supply chain can find the gathering information
from all the country’sparties of market service in Denmark.
Warehouse Management
The application of the warehouse management can be used for the distribution center of
the management operation. The process of analyzing warehouse function is receiving the product
of market analysis, inventory operation, put away, calculating the cycle count, interleave,
analysis the financial wave plan graph, allocation of food and road order, packing, shipping,
labor management service, and automated interface of material handling equipment.
Transportation Management
The transportation management specifies all the shipping activities and enterprise system.
The activities of the transportation function can identify different kinds of stages is movement of
procuring freight shipping rates, selection of route an carrier system, operation of freight,
visibility, payment and to audit the financial marketing budgets.
4
Document Page
Manufacture Analysis
The analysis of the manufacturing application that can specified the two or more areas.
The process analysis of the manufacturing to check the freight allocation and status, control of
scheduling details, labor and quality service, maintained process of the management. The
customer to send the feedback to the supplier, analysis the what kind of problem occur and
ratified problem on the management system
ProductOrder Management
For analyzing the order management system of the Denmark analysis of the logistic of
supply chain business process that follow the three stages,
1) CRM (customer Relation management system)
2) ERP (Enterprise resource management)
3) LSCM(logistic supply chain management)
Source and Procurement
The source and procurement that supports the purchasing on the procurement is the
shipping form china to Danish harbor and transform from the harbor to food and road address
which connected to indirect on the transform management system The shipping of the Estonia
that can directly connected on the transform management. Of the way of suppliers.
Integrated supply chain planning and execution process
Nowadays, the business environment of planning the supply chain process and its scope
of capacity is more comprehensive. At the same time, it supports the flexibility of fast market
changing conditions, and evolving process of business market Denmark. The integrated
synchronization of supply chain planning and execution is a real time market in Denmark.
Benefits:
Loss of freight sales reduction.
Working capital requirement is reduced.
Out of stock is reduced.
5
tabler-icon-diamond-filled.svg

Paraphrase This Document

Need a fresh take? Get an instant paraphrase of this document with our AI Paraphraser
Document Page
Analysis and Evaluation
The analysis and evaluation of the process can follow three kinds of tasks that includes:
1) Logistic wise analysis,
2) Statically wise analysis,
3) Economical wise analysis.
Task 1- Logistic of Food and Road Analysis
Question 1.1
The logistic wise analysis, of the food and road deliver of the business process can
specify two country suppliers such as China and Estonia and combination of the order is 3000
uniforms.The customer to order the food and road of the initial uniform is 750 per annum to wear
and tear. The China supplier has specified the amount of per uniform with a unit price rate, DKK
750. The Estonia suppliers hasspecified the amount of per uniform with a unit price rate, DKK
1,120.
From To Ship capacity unit cost supply demand
china 11400 china 80
China Danish harbour 50 1,25,000 Estonia 70
Transport 50 36,000
Estonia 50 70,000
Estonia Transport 50 98,000.00
The logistics operation that can used for the accompanying life in human societies. The
logistic of the analyzing tasks that can specified freight the shipping form china to Danish harbor
Dkk 25,000 and transport of the Road and food address rate is Dkk 36000 find the total values is
DKK 1,61,000 and find the 15 % of the total cost values is DKK 60150. The Estonia freight can
6
Document Page
be directly sent to the Food and road address and can calculating the truck and cost values is
DKK 98,000.
Country Amount (in DKK)
china to Danish 125000
Danish to
Roadfood 36,000
Estoina 98,000
total cost 1,61,000
ship 60150
To find the total cost values of China which is used in the formula of import tax with 15% of the
total amount of cost price transport on the Danish harbor amount.
Question 1.2
As the importer, made in china and Estonia is the good choice of the many products which can
sell locally or online with the good profit. But in fact, too many new to china buyer’s focus only
product of unit price and then get a surprise when have to pay in their destination country, which
they didn't for in the budget.
Import data calculation=china Road and food address value+ Estonia shipping Road and food
address value
7
Document Page
The transport of the calculation has been specified the calculation is,
Landed Cost = EXW/FOB + To-Door Freight + Customs Fees
EXW/FOB paid the customer/supplier
The calculating the transport data is follow the three types
Shipment value amount, quoted by the seller
Shipment freight amount, quoted by company
Shipment customs amount, quoted by customs via customs broker
suppliers cost Transport/import year
uniform 3000
per annum 2937.5
china 712500 605625
Estonia 840000 4200000 -424000
Estonia to Road food 98000
China to Road food 1,61,000.00
Expanse 40,000.00
variable cost -56.67
Remaining income 1,21,000.00
The food and road packages on delivery in market service can change the values over time. The
process suppliers can follow the traditional marketing service which can delivery theuniform
freight in the mail and packages for customer satisfaction. The change of the delivery marketing
service of the years can perform three types of operationssuch as, Business to Business analysis,
Business to customer analysis, customer to business analysis, and customer to customer market
analysis.
Question 1.3
Calculating the uniform order quality of the safe stock value is,
Q= 2 DS
H
Where D is denoted as the annual demand,
8
tabler-icon-diamond-filled.svg

Secure Best Marks with AI Grader

Need help grading? Try our AI Grader for instant feedback on your assignments.
Document Page
S denoted as the ordering cost,
H is denoted as the holding cost.
RR=dL+Zσ
SS=Z σ
To find the total demand calculation is,
Total demand= 750*demand of the day
Calculating the uniform quality service,
Uniform quality service=SQRT (2*total cost*order cost)/holding cost
9
Document Page
China RO=demand days*lead time +china values(1288000)
China Safe stock=Estonia value*demand days.
10
Document Page
Estonia Ro=demand of day*lead time*Estonia values
Estonia safe stock=Estonia values*demand days
11
tabler-icon-diamond-filled.svg

Paraphrase This Document

Need a fresh take? Get an instant paraphrase of this document with our AI Paraphraser
Document Page
•Use your assumptions to calculate how many uniforms there have to be in the Warehouse.
The assumption of the warehouse has contains the china and Estonia uniform and price list,
calculating the number of uniforms is,
12
Document Page
Warehouse=uniform (Estonia unit price+ china unit price)
safe of stock
china 12880000
demand days 9
Estonia 11270000
Lead time 3000
ordering cost 750
holding host 2250
EOQ 6.906786786
RO 12907000
ss 101430000
Ro 11297000
SS 101430000
The standard deviation of the variance values is 100% of the food and Road of the supply chain
can be safe stock. The assuming and calculating of the warehouse can be specified the values of
13
Document Page
DKK 3,80,01,120.00.
uniform in warehouse Column1
uniform price
750 950
750 1,120
3000 40,000.00
uniform list ₹ 3,80,01,120.00
In Logistical wise analysis, which is used for the business process of China and Estonia for the
uniform combination of orders, to find the inventory, transport and import calculation,
warehousing and packaging of the supply chain management system. The process of the logistics
can mainly be used for the storage distribution in warehousing, to analyze the delivery of
marketing the products is good or not.Postal Service Denmark Development Product Customer
Requirements Supply Chain Management.
Task 2- Statistical Tasks
The statistical analysis of the food and road on supply chain management can be used for
the sampling of the inventory control of the management system. The statistics of the inventory
control that can specified the lot of data can be found in the data warehouse of the supply chain,
to find the forecast re-order level, maximum levels, stocks, minimum levels to be maintained.
controlling of the inventory to analysis of the statistics which can specified the chain of the
decisions which can lead to improvement in your supply chain structure and increase the
efficiency.
Question 2.1
Total forecast for the total market of package distribution in Demark is,
suppliers Column2 Column3
forcast
14
tabler-icon-diamond-filled.svg

Secure Best Marks with AI Grader

Need help grading? Try our AI Grader for instant feedback on your assignments.
Document Page
750 712500 605675
950 840000 420000
1,120 56350000 98,000
X:
712500 513419.68
1 2 3
0%
10%
20%
30%
40%
50%
60%
70%
80%
90%
100%
market distribution denmark
Series1 Series2 Series3
Question 2.2
The process of implementing the service level control system that can specified the measure
observation an demand level of the supply chain management that can find the problems of
service level calculation is,
Service level =if(inventory level>=demand, 1, 0)
15
Document Page
To find the total cost of the service level process that can specified the calculation is,
Total cost =number of intentory levels and click the percentage symbol on the toolbar.
The delivery service of contains the name of the day, order date, complete today, delivery date of
16
Document Page
the supply chain management,
The calculation of the delivery service which is denotes as,
Delivery service=working day.intl (order date, day of complete, 11)
Find the day =Text(delivery date,”DDD”)
17
tabler-icon-diamond-filled.svg

Paraphrase This Document

Need a fresh take? Get an instant paraphrase of this document with our AI Paraphraser
Document Page
The food and road of the supply chain management system can find the value of the
service level of the inventory management system.
service level Column1
Column
2 Column3
observations
intentory
level demand
service
level
china 712500 750 1
Estina 840000 750 1
Estonia to road
food 98000 50 1
china to Danish 125000 45 1
Danish to road
food 36,000 60 1
-56375 5
50%
Delivery service
18
Document Page
Day name order date
days to
complete delivery date
sat
19-May-
18 5 25-May-18 Fri
Thu
20-May-
18 8 29-May-18 Tue
Tue
21-May-
18 7 29-May-18 Tue
sun
22-May-
18 8 31-May-18 Thu
Fri
23-May-
18 9 02-Jun-18 Sat
wed
24-May-
18 10 05-Jun-18 Tue
1 2 3 4 5 60 0 0 0 0 -56375
712500
840000
98000 125000
36000
750 750 50 45 601 1 1 1 1 50 0 0 0 0 -56375
712500
840000
98000 125000
36000
750 750 50 45 601 1 1 1 1 5
delivery service
service level observations Column1 intentory level Column2 demand Column3 service level
19
Document Page
Task 3-Economic Task
Question 3.1
To find the profitability post Denmark,
Cash flow values china Estoina
year 0 712500 605625 938000
year1 840000 714000 1065500
year 2 967500 822375 1193000
year 3 1095000 930750 98000
discount rate 15% 20%
profitability
index 3.0624337617 1.8903004817
1 2 3 4 5 6
0%
10%
20%
30%
40%
50%
60%
70%
80%
90%
100%
Profitability index
china Estoina
Capital used for the cost investment is represented in the below table.
Column1 Column2 Column3 Column4 Column5
China Estonia
Rate of invest 15% 20%
cost 60,150 161000.00
20
tabler-icon-diamond-filled.svg

Secure Best Marks with AI Grader

Need help grading? Try our AI Grader for instant feedback on your assignments.
Document Page
year 1 605625 938000
year 2 714000 1065500
year 3 822375 1193000
year 4 930750 98000
year 5 930750 -997000
project to be selected
NPV Project
Rs.
26,62,298.50 Rs. 20,19,579.60 China
Cost of
investment 6015000.00% 16100000.00%
The analysis of the key figures is,
Question 3.2
The food and business of the investment equipment of the set of business service to find
21
Document Page
the first 5 years based on the assumptions is presented below.
Rate of invest
cost
year 1
year 2
year 3
year 4
year 5
NPV Project
Cost of investment
-150000000%
-100000000%
-50000000%
0%
50000000%
100000000%
150000000%
200000000%
250000000%
300000000%
cost of investments
China Estonia Series3
22
Document Page
Conclusion
Logistics and supply chain management system to be successful implementing in the
food and road restaurants, the supplier to deliver the food to the customer.The supply chain
management has been following three types of analysis and process evaluation which in turn
follows three kinds of tasks namely, theLogistic wise analysis, statically wise analysis and the
Economical wise analysiswhich are analyzed successfully. The Logistical wise analysis can be
used for specifying the transport and import related calculations, safe chain stock. The warehouse
of the supply chain management is completed. The statistical analysis of the supply chain
management provides the calculations of the values related to implementing the control systems
and finding the service level of the delivery system,to find the total market for packages of the
distribution of the value is 50% of the market Denmark will be completed.The economical
service of the post Denmark can calculate the values of profitability and capital of the investment
for the next 5 years on -198% and -117%.
23
tabler-icon-diamond-filled.svg

Paraphrase This Document

Need a fresh take? Get an instant paraphrase of this document with our AI Paraphraser
Document Page
Bibliography
Owen, G. (2013). Game theory. Bingley: Emerald.
Rapoport, A. (2013). Two-Person Game Theory. Newburyport: Dover Publications.
24
Document Page
Attachment
25
Document Page
26
tabler-icon-diamond-filled.svg

Secure Best Marks with AI Grader

Need help grading? Try our AI Grader for instant feedback on your assignments.
Document Page
27
Document Page
28
Document Page
Rate of invest
cost
year 1
year 2
year 3
year 4
year 5
NPV Project
Cost of investment
-150000000%
-100000000%
-50000000%
0%
50000000%
100000000%
150000000%
200000000%
250000000%
300000000%
cost of investments
China Estonia Series3
29
chevron_up_icon
1 out of 31
circle_padding
hide_on_mobile
zoom_out_icon
logo.png

Your All-in-One AI-Powered Toolkit for Academic Success.

Available 24*7 on WhatsApp / Email

[object Object]