Supply Chain Modelling Report: Dronautics Ltd's Transport Network
VerifiedAdded on 2023/03/17
|21
|4828
|72
Report
AI Summary
This report presents a supply chain model for Dronautics Ltd, a drone manufacturing company with three manufacturing sites in Australia and two distribution centers. The study aims to optimize the transport network, reduce costs, and enhance efficiency. The report begins by modeling the most cost-effective manufacturing site, considering production and transportation costs, and determines that Darwin is the optimal location. It then models the distribution network, deciding on the optimal number of drones to be transported from the Darwin center to the Adelaide and Newcastle distribution centers, and the optimal use of pallets to minimize transportation expenses. Finally, the report models the distribution of drones from the distribution centers to the respective markets, providing an optimal distribution plan to minimize costs. The models, developed using Microsoft Excel Solver, provide detailed insights into the optimal flow of goods, the cost implications of different transport options, and the overall efficiency of the supply chain.
Running head: SUPPLY CHAIN MODELLLING
Supply Chain Modelling
Student Name
Institution Name
1
Supply Chain Modelling
Student Name
Institution Name
1
Paraphrase This Document
Need a fresh take? Get an instant paraphrase of this document with our AI Paraphraser
SUPPLY CHAIN MODELLING
Introduction
The management of the supply chain is assumed to be one of the most vital parts of all
business operations. From the business dictionary it is defined as the management of materials
and information flow in a supply chain to deliver the best degree of customer satisfaction at the
lowest possible cost. An efficient supply chain network can assist a firm to achieve a competitive
advantage which means enhance profitability compared to other industries in the market
(Business Dictionery, 2019). The general assumption in addition to past business experiences do
support the notion that through effective management of a supply chain a business can be able to
turns its story to a success. For instance, the Walmart story of success is greatly built around the
improvement of its supply chain which did enhance customer satisfaction and minimized the
operation costs. Through improvement of their supply chain network, the management of
Walmart were able to drive the company to a position of one of the world largest retailers (Lu,
2014).
The definition by Supply chain Management textbook state that supply chain is a network
comprised of facilities and transportation systems that allow the implementation of procurement
of materials, their assembling into finished commodities as well as the final distribution to the
consumers. Based on this definition supply chain, management can be stated to be the active
management of the listed activities so as to achieve the optimal customer satisfaction at a
minimal cost possible. With this a firm is able to achieve a competitive advantage and hence
increase its overall profitability (Hill, 2010). Supply chain is a complicated process that covers
several activities. These activities are genialized by a term driver of a supply chain. They are
location, inventory, production, information as well as transportation.
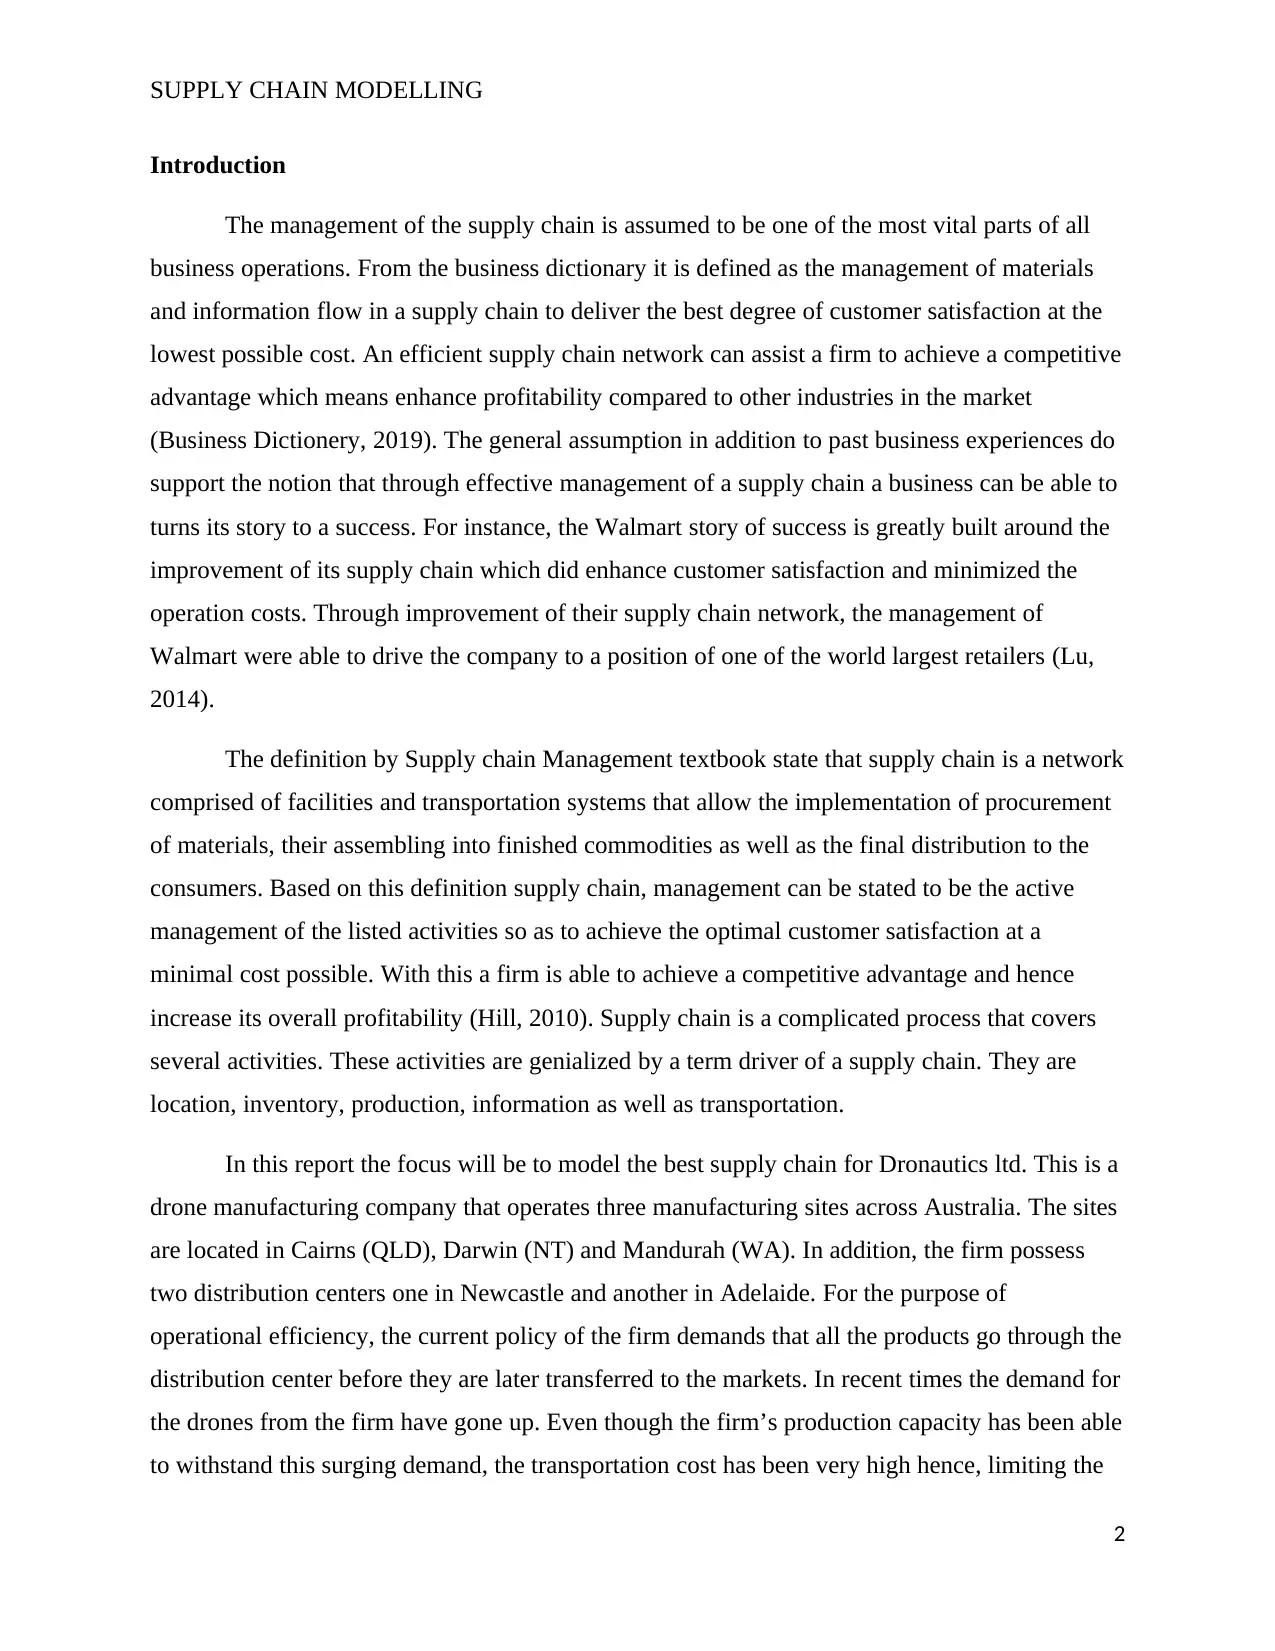
In this report the focus will be to model the best supply chain for Dronautics ltd. This is a
drone manufacturing company that operates three manufacturing sites across Australia. The sites
are located in Cairns (QLD), Darwin (NT) and Mandurah (WA). In addition, the firm possess
two distribution centers one in Newcastle and another in Adelaide. For the purpose of
operational efficiency, the current policy of the firm demands that all the products go through the
distribution center before they are later transferred to the markets. In recent times the demand for
the drones from the firm have gone up. Even though the firm’s production capacity has been able
to withstand this surging demand, the transportation cost has been very high hence, limiting the
2
Introduction
The management of the supply chain is assumed to be one of the most vital parts of all
business operations. From the business dictionary it is defined as the management of materials
and information flow in a supply chain to deliver the best degree of customer satisfaction at the
lowest possible cost. An efficient supply chain network can assist a firm to achieve a competitive
advantage which means enhance profitability compared to other industries in the market
(Business Dictionery, 2019). The general assumption in addition to past business experiences do
support the notion that through effective management of a supply chain a business can be able to
turns its story to a success. For instance, the Walmart story of success is greatly built around the
improvement of its supply chain which did enhance customer satisfaction and minimized the
operation costs. Through improvement of their supply chain network, the management of
Walmart were able to drive the company to a position of one of the world largest retailers (Lu,
2014).
The definition by Supply chain Management textbook state that supply chain is a network
comprised of facilities and transportation systems that allow the implementation of procurement
of materials, their assembling into finished commodities as well as the final distribution to the
consumers. Based on this definition supply chain, management can be stated to be the active
management of the listed activities so as to achieve the optimal customer satisfaction at a
minimal cost possible. With this a firm is able to achieve a competitive advantage and hence
increase its overall profitability (Hill, 2010). Supply chain is a complicated process that covers
several activities. These activities are genialized by a term driver of a supply chain. They are
location, inventory, production, information as well as transportation.
In this report the focus will be to model the best supply chain for Dronautics ltd. This is a
drone manufacturing company that operates three manufacturing sites across Australia. The sites
are located in Cairns (QLD), Darwin (NT) and Mandurah (WA). In addition, the firm possess
two distribution centers one in Newcastle and another in Adelaide. For the purpose of
operational efficiency, the current policy of the firm demands that all the products go through the
distribution center before they are later transferred to the markets. In recent times the demand for
the drones from the firm have gone up. Even though the firm’s production capacity has been able
to withstand this surging demand, the transportation cost has been very high hence, limiting the
2
SUPPLY CHAIN MODELLING
company’s profitability. Due to this high cost of transportation, the management of Dronautics
are interested in revising the transport supply chain to minimize the costs of operation while at
the same time maintaining supply of goods to the respective markets. Furthermore, in the past
Dronautics used to transport the drones as individual units something which the managers are
reconsidering due to the introduction of transportation in pallets. The use of pallets excludes
additional handling and other manual operations hence cutting down on the costs.
Using the data collected by the company’s information office, will develop models to
generate the optimal transport network taking accounts of the various options available to the
management for cutting down the cost of operation.
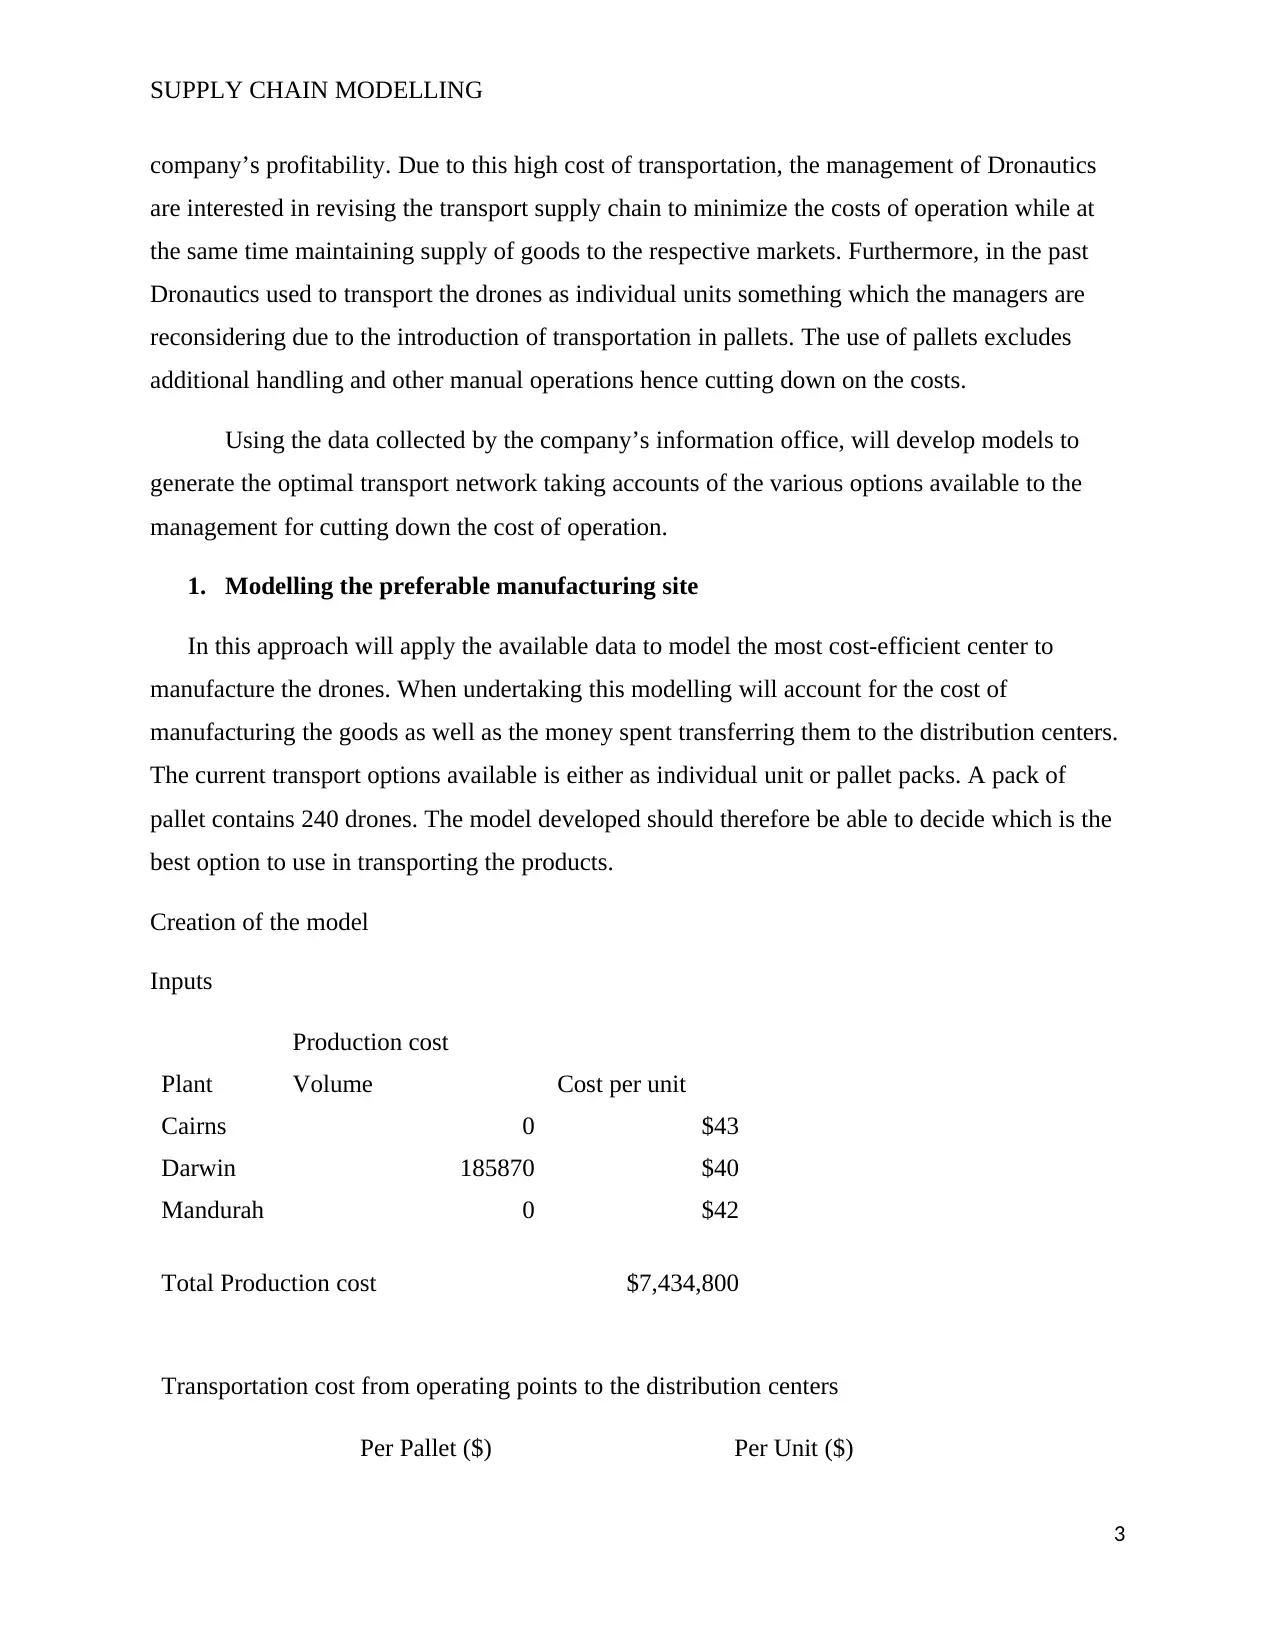
1. Modelling the preferable manufacturing site
In this approach will apply the available data to model the most cost-efficient center to
manufacture the drones. When undertaking this modelling will account for the cost of
manufacturing the goods as well as the money spent transferring them to the distribution centers.
The current transport options available is either as individual unit or pallet packs. A pack of
pallet contains 240 drones. The model developed should therefore be able to decide which is the
best option to use in transporting the products.
Creation of the model
Inputs
Production cost
Plant Volume Cost per unit
Cairns 0 $43
Darwin 185870 $40
Mandurah 0 $42
Total Production cost $7,434,800
Transportation cost from operating points to the distribution centers
Per Pallet ($) Per Unit ($)
3
company’s profitability. Due to this high cost of transportation, the management of Dronautics
are interested in revising the transport supply chain to minimize the costs of operation while at
the same time maintaining supply of goods to the respective markets. Furthermore, in the past
Dronautics used to transport the drones as individual units something which the managers are
reconsidering due to the introduction of transportation in pallets. The use of pallets excludes
additional handling and other manual operations hence cutting down on the costs.
Using the data collected by the company’s information office, will develop models to
generate the optimal transport network taking accounts of the various options available to the
management for cutting down the cost of operation.
1. Modelling the preferable manufacturing site
In this approach will apply the available data to model the most cost-efficient center to
manufacture the drones. When undertaking this modelling will account for the cost of
manufacturing the goods as well as the money spent transferring them to the distribution centers.
The current transport options available is either as individual unit or pallet packs. A pack of
pallet contains 240 drones. The model developed should therefore be able to decide which is the
best option to use in transporting the products.
Creation of the model
Inputs
Production cost
Plant Volume Cost per unit
Cairns 0 $43
Darwin 185870 $40
Mandurah 0 $42
Total Production cost $7,434,800
Transportation cost from operating points to the distribution centers
Per Pallet ($) Per Unit ($)
3
⊘ This is a preview!⊘
Do you want full access?
Subscribe today to unlock all pages.
Trusted by 1+ million students worldwide
SUPPLY CHAIN MODELLING
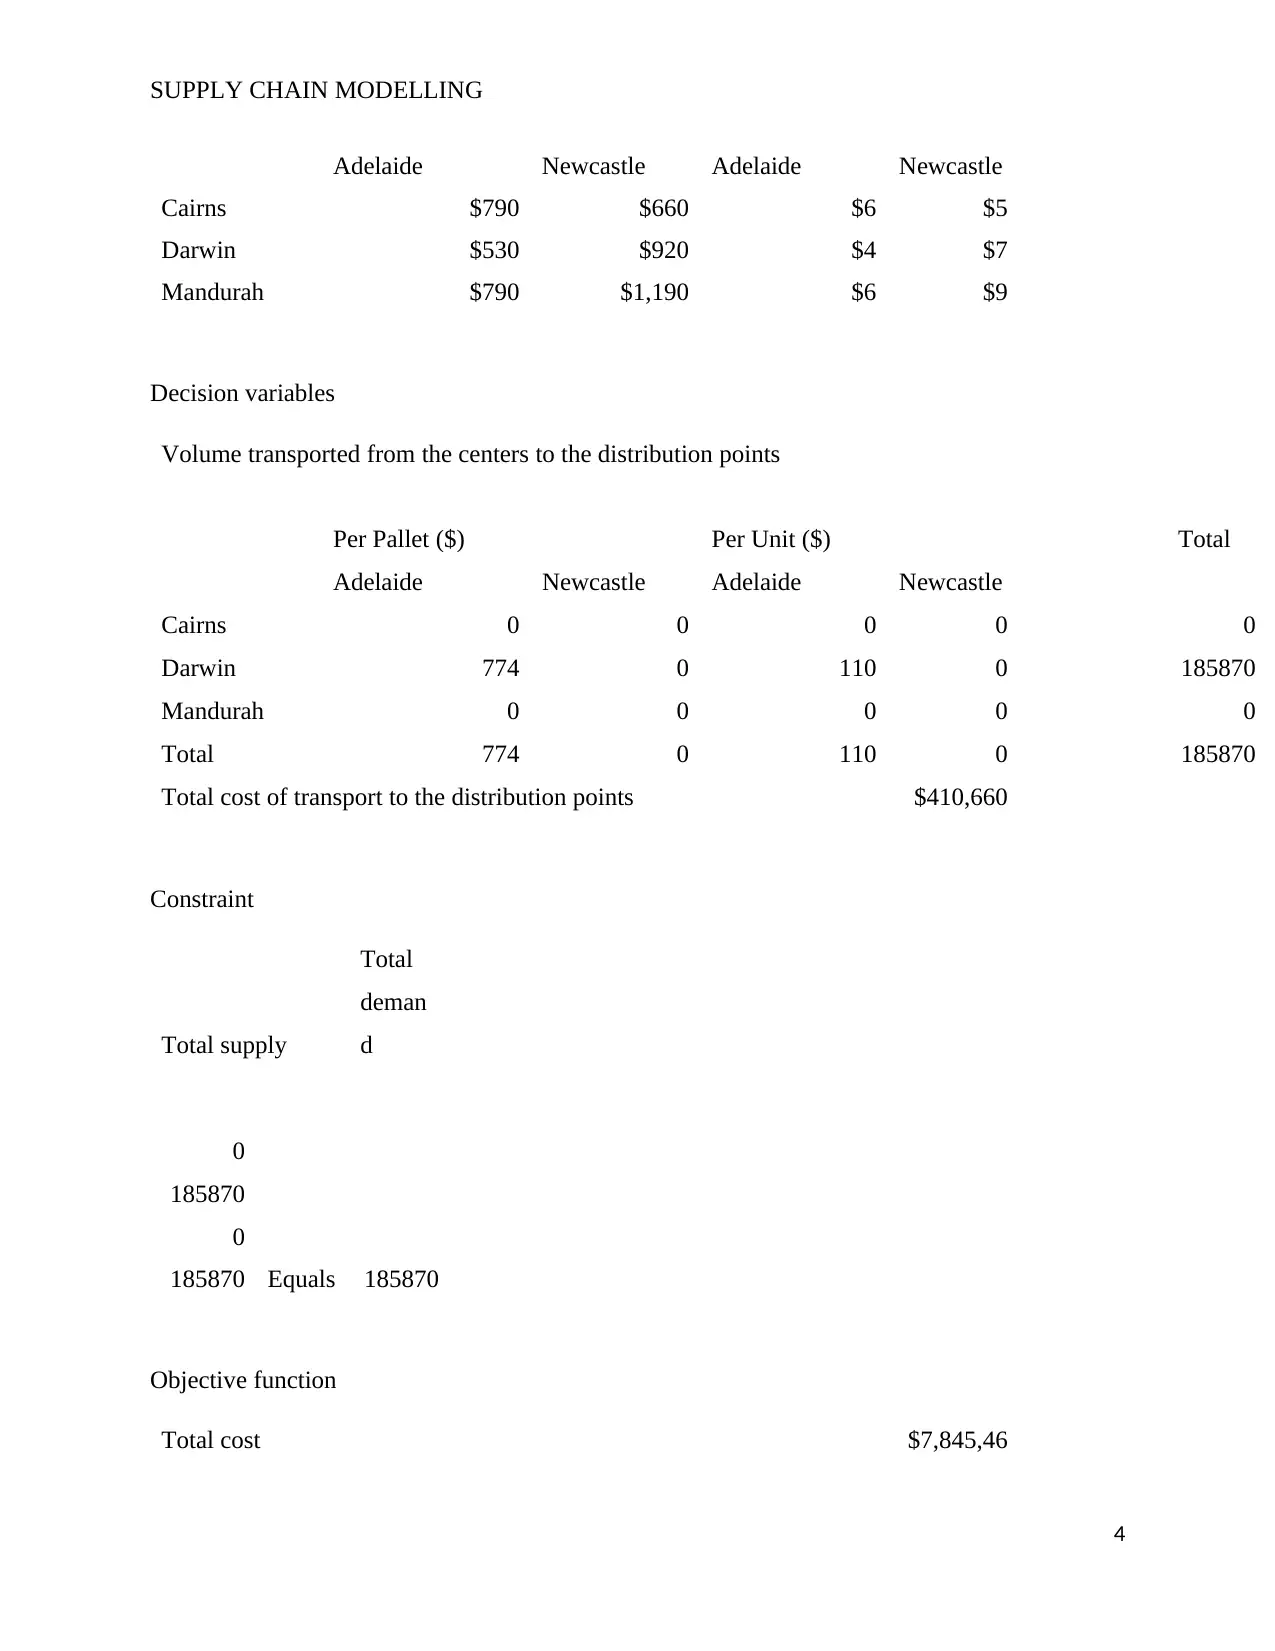
Adelaide Newcastle Adelaide Newcastle
Cairns $790 $660 $6 $5
Darwin $530 $920 $4 $7
Mandurah $790 $1,190 $6 $9
Decision variables
Volume transported from the centers to the distribution points
Per Pallet ($) Per Unit ($) Total
Adelaide Newcastle Adelaide Newcastle
Cairns 0 0 0 0 0
Darwin 774 0 110 0 185870
Mandurah 0 0 0 0 0
Total 774 0 110 0 185870
Total cost of transport to the distribution points $410,660
Constraint
Total supply
Total
deman
d
0
185870
0
185870 Equals 185870
Objective function
Total cost $7,845,46
4
Adelaide Newcastle Adelaide Newcastle
Cairns $790 $660 $6 $5
Darwin $530 $920 $4 $7
Mandurah $790 $1,190 $6 $9
Decision variables
Volume transported from the centers to the distribution points
Per Pallet ($) Per Unit ($) Total
Adelaide Newcastle Adelaide Newcastle
Cairns 0 0 0 0 0
Darwin 774 0 110 0 185870
Mandurah 0 0 0 0 0
Total 774 0 110 0 185870
Total cost of transport to the distribution points $410,660
Constraint
Total supply
Total
deman
d
0
185870
0
185870 Equals 185870
Objective function
Total cost $7,845,46
4
Paraphrase This Document
Need a fresh take? Get an instant paraphrase of this document with our AI Paraphraser
SUPPLY CHAIN MODELLING
0
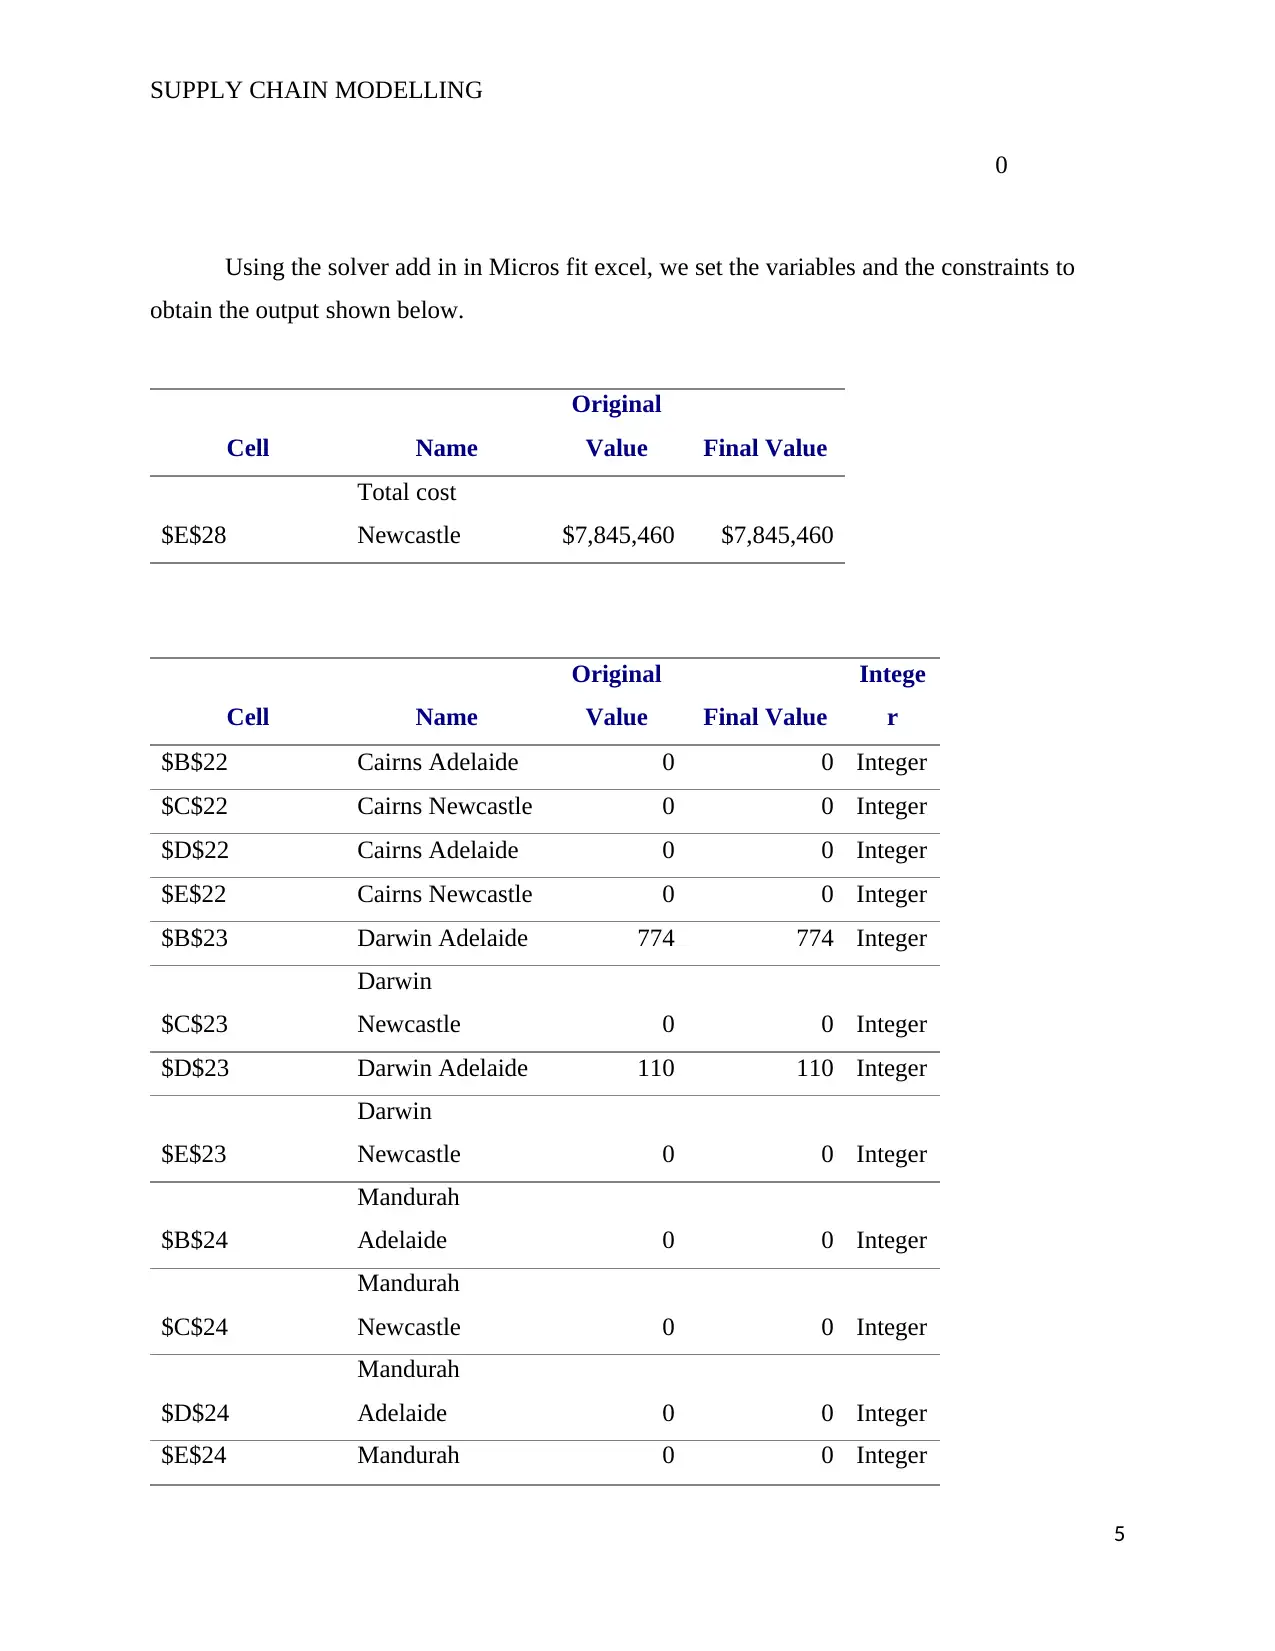
Using the solver add in in Micros fit excel, we set the variables and the constraints to
obtain the output shown below.
Cell Name
Original
Value Final Value
$E$28
Total cost
Newcastle $7,845,460 $7,845,460
Cell Name
Original
Value Final Value
Intege
r
$B$22 Cairns Adelaide 0 0 Integer
$C$22 Cairns Newcastle 0 0 Integer
$D$22 Cairns Adelaide 0 0 Integer
$E$22 Cairns Newcastle 0 0 Integer
$B$23 Darwin Adelaide 774 774 Integer
$C$23
Darwin
Newcastle 0 0 Integer
$D$23 Darwin Adelaide 110 110 Integer
$E$23
Darwin
Newcastle 0 0 Integer
$B$24
Mandurah
Adelaide 0 0 Integer
$C$24
Mandurah
Newcastle 0 0 Integer
$D$24
Mandurah
Adelaide 0 0 Integer
$E$24 Mandurah 0 0 Integer
5
0
Using the solver add in in Micros fit excel, we set the variables and the constraints to
obtain the output shown below.
Cell Name
Original
Value Final Value
$E$28
Total cost
Newcastle $7,845,460 $7,845,460
Cell Name
Original
Value Final Value
Intege
r
$B$22 Cairns Adelaide 0 0 Integer
$C$22 Cairns Newcastle 0 0 Integer
$D$22 Cairns Adelaide 0 0 Integer
$E$22 Cairns Newcastle 0 0 Integer
$B$23 Darwin Adelaide 774 774 Integer
$C$23
Darwin
Newcastle 0 0 Integer
$D$23 Darwin Adelaide 110 110 Integer
$E$23
Darwin
Newcastle 0 0 Integer
$B$24
Mandurah
Adelaide 0 0 Integer
$C$24
Mandurah
Newcastle 0 0 Integer
$D$24
Mandurah
Adelaide 0 0 Integer
$E$24 Mandurah 0 0 Integer
5
SUPPLY CHAIN MODELLING
Newcastle
Cell Name Cell Value Formula Status
Slac
k
$G$25 Total 185870
$G$25=$H$
25
Bindin
g 0
$B$22:
$E$24=Integer
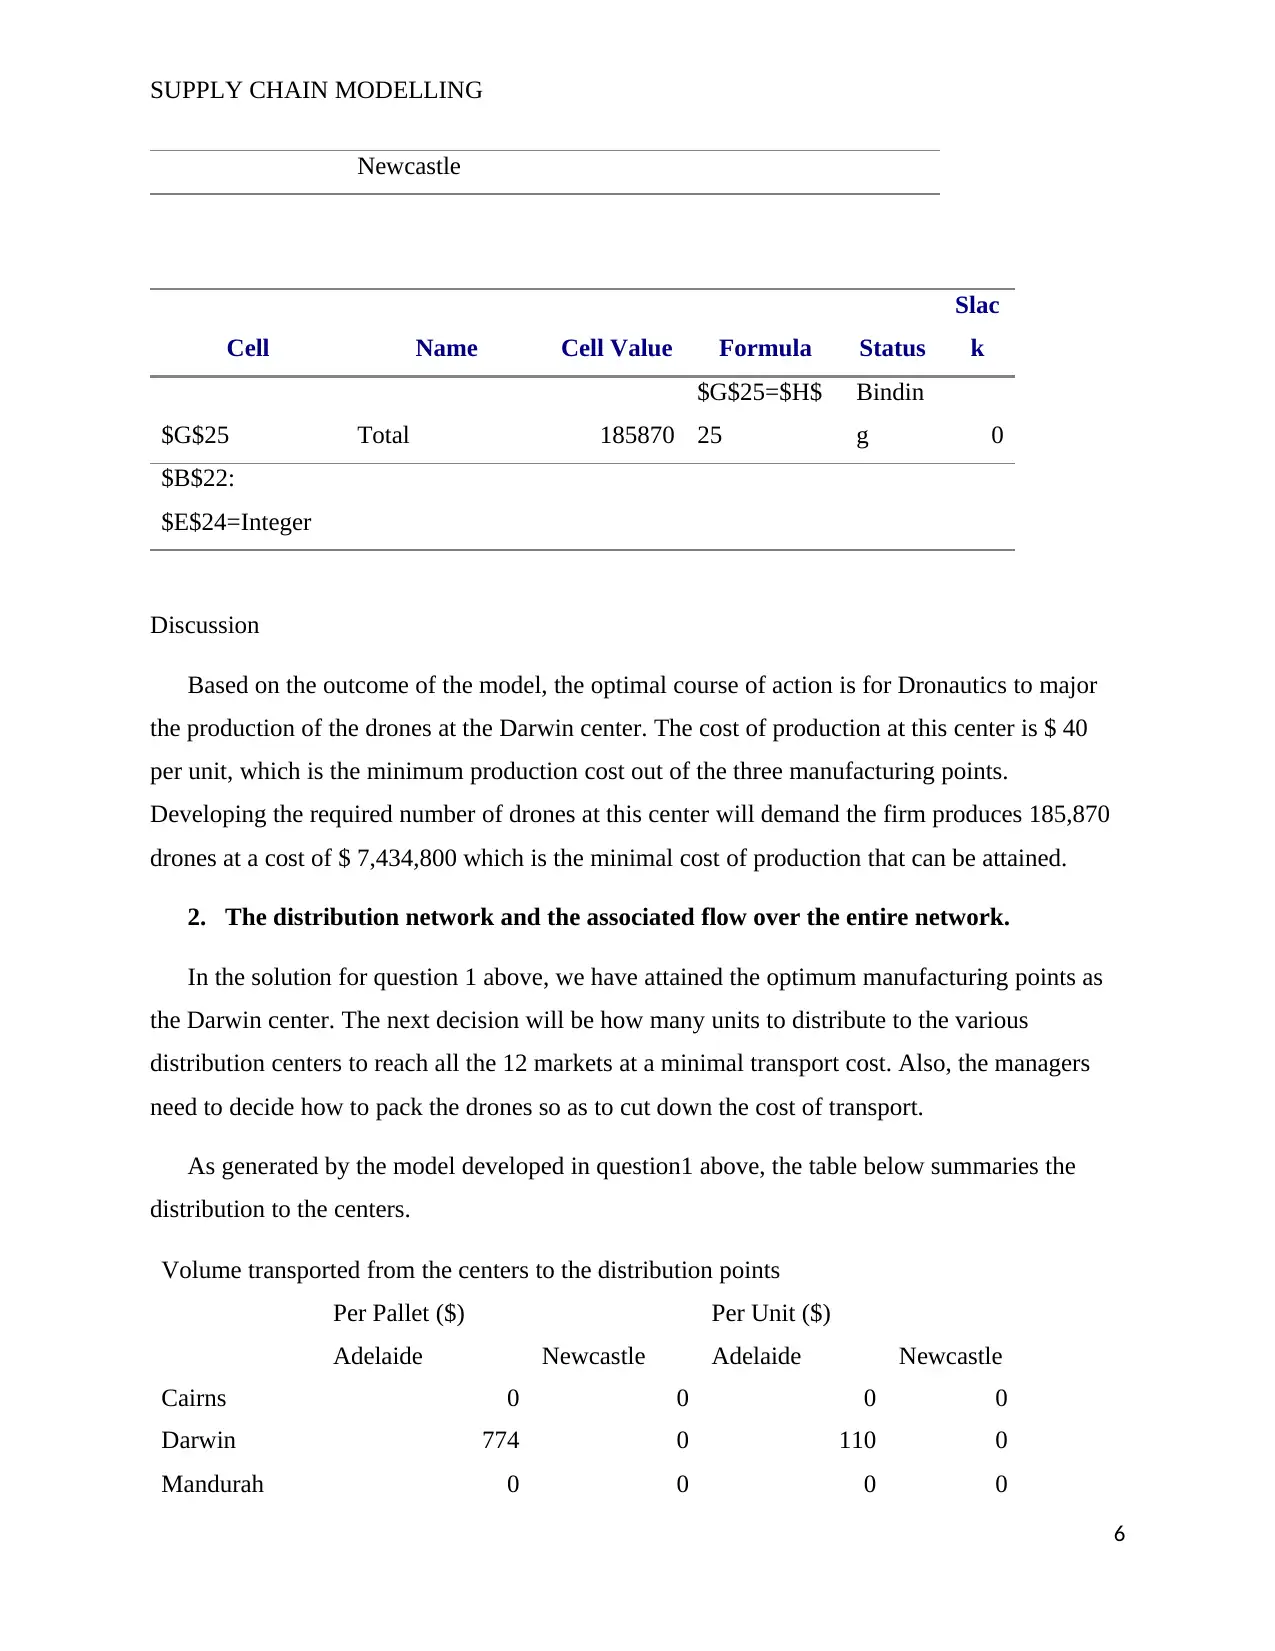
Discussion
Based on the outcome of the model, the optimal course of action is for Dronautics to major
the production of the drones at the Darwin center. The cost of production at this center is $ 40
per unit, which is the minimum production cost out of the three manufacturing points.
Developing the required number of drones at this center will demand the firm produces 185,870
drones at a cost of $ 7,434,800 which is the minimal cost of production that can be attained.
2. The distribution network and the associated flow over the entire network.
In the solution for question 1 above, we have attained the optimum manufacturing points as
the Darwin center. The next decision will be how many units to distribute to the various
distribution centers to reach all the 12 markets at a minimal transport cost. Also, the managers
need to decide how to pack the drones so as to cut down the cost of transport.
As generated by the model developed in question1 above, the table below summaries the
distribution to the centers.
Volume transported from the centers to the distribution points
Per Pallet ($) Per Unit ($)
Adelaide Newcastle Adelaide Newcastle
Cairns 0 0 0 0
Darwin 774 0 110 0
Mandurah 0 0 0 0
6
Newcastle
Cell Name Cell Value Formula Status
Slac
k
$G$25 Total 185870
$G$25=$H$
25
Bindin
g 0
$B$22:
$E$24=Integer
Discussion
Based on the outcome of the model, the optimal course of action is for Dronautics to major
the production of the drones at the Darwin center. The cost of production at this center is $ 40
per unit, which is the minimum production cost out of the three manufacturing points.
Developing the required number of drones at this center will demand the firm produces 185,870
drones at a cost of $ 7,434,800 which is the minimal cost of production that can be attained.
2. The distribution network and the associated flow over the entire network.
In the solution for question 1 above, we have attained the optimum manufacturing points as
the Darwin center. The next decision will be how many units to distribute to the various
distribution centers to reach all the 12 markets at a minimal transport cost. Also, the managers
need to decide how to pack the drones so as to cut down the cost of transport.
As generated by the model developed in question1 above, the table below summaries the
distribution to the centers.
Volume transported from the centers to the distribution points
Per Pallet ($) Per Unit ($)
Adelaide Newcastle Adelaide Newcastle
Cairns 0 0 0 0
Darwin 774 0 110 0
Mandurah 0 0 0 0
6
⊘ This is a preview!⊘
Do you want full access?
Subscribe today to unlock all pages.
Trusted by 1+ million students worldwide
SUPPLY CHAIN MODELLING
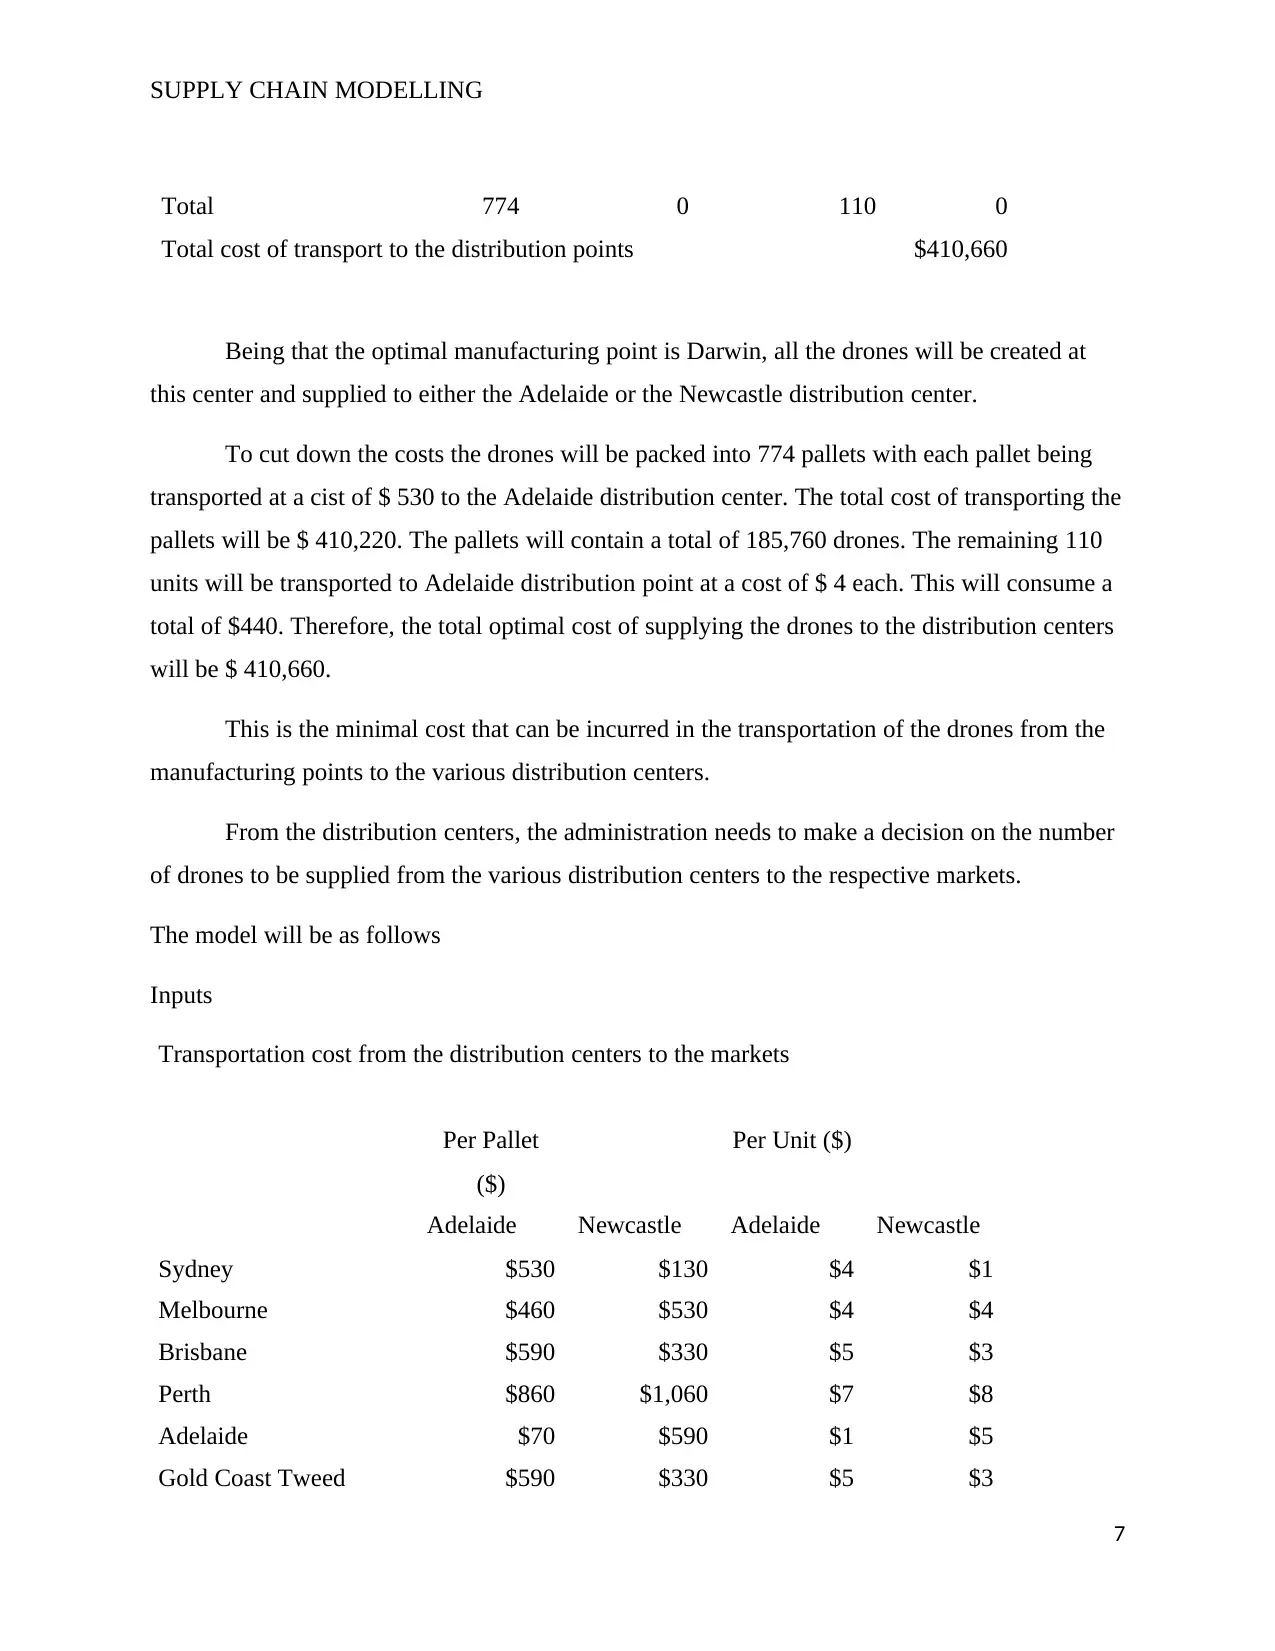
Total 774 0 110 0
Total cost of transport to the distribution points $410,660
Being that the optimal manufacturing point is Darwin, all the drones will be created at
this center and supplied to either the Adelaide or the Newcastle distribution center.
To cut down the costs the drones will be packed into 774 pallets with each pallet being
transported at a cist of $ 530 to the Adelaide distribution center. The total cost of transporting the
pallets will be $ 410,220. The pallets will contain a total of 185,760 drones. The remaining 110
units will be transported to Adelaide distribution point at a cost of $ 4 each. This will consume a
total of $440. Therefore, the total optimal cost of supplying the drones to the distribution centers
will be $ 410,660.
This is the minimal cost that can be incurred in the transportation of the drones from the
manufacturing points to the various distribution centers.
From the distribution centers, the administration needs to make a decision on the number
of drones to be supplied from the various distribution centers to the respective markets.
The model will be as follows
Inputs
Transportation cost from the distribution centers to the markets
Per Pallet
($)
Per Unit ($)
Adelaide Newcastle Adelaide Newcastle
Sydney $530 $130 $4 $1
Melbourne $460 $530 $4 $4
Brisbane $590 $330 $5 $3
Perth $860 $1,060 $7 $8
Adelaide $70 $590 $1 $5
Gold Coast Tweed $590 $330 $5 $3
7
Paraphrase This Document
Need a fresh take? Get an instant paraphrase of this document with our AI Paraphraser
SUPPLY CHAIN MODELLING
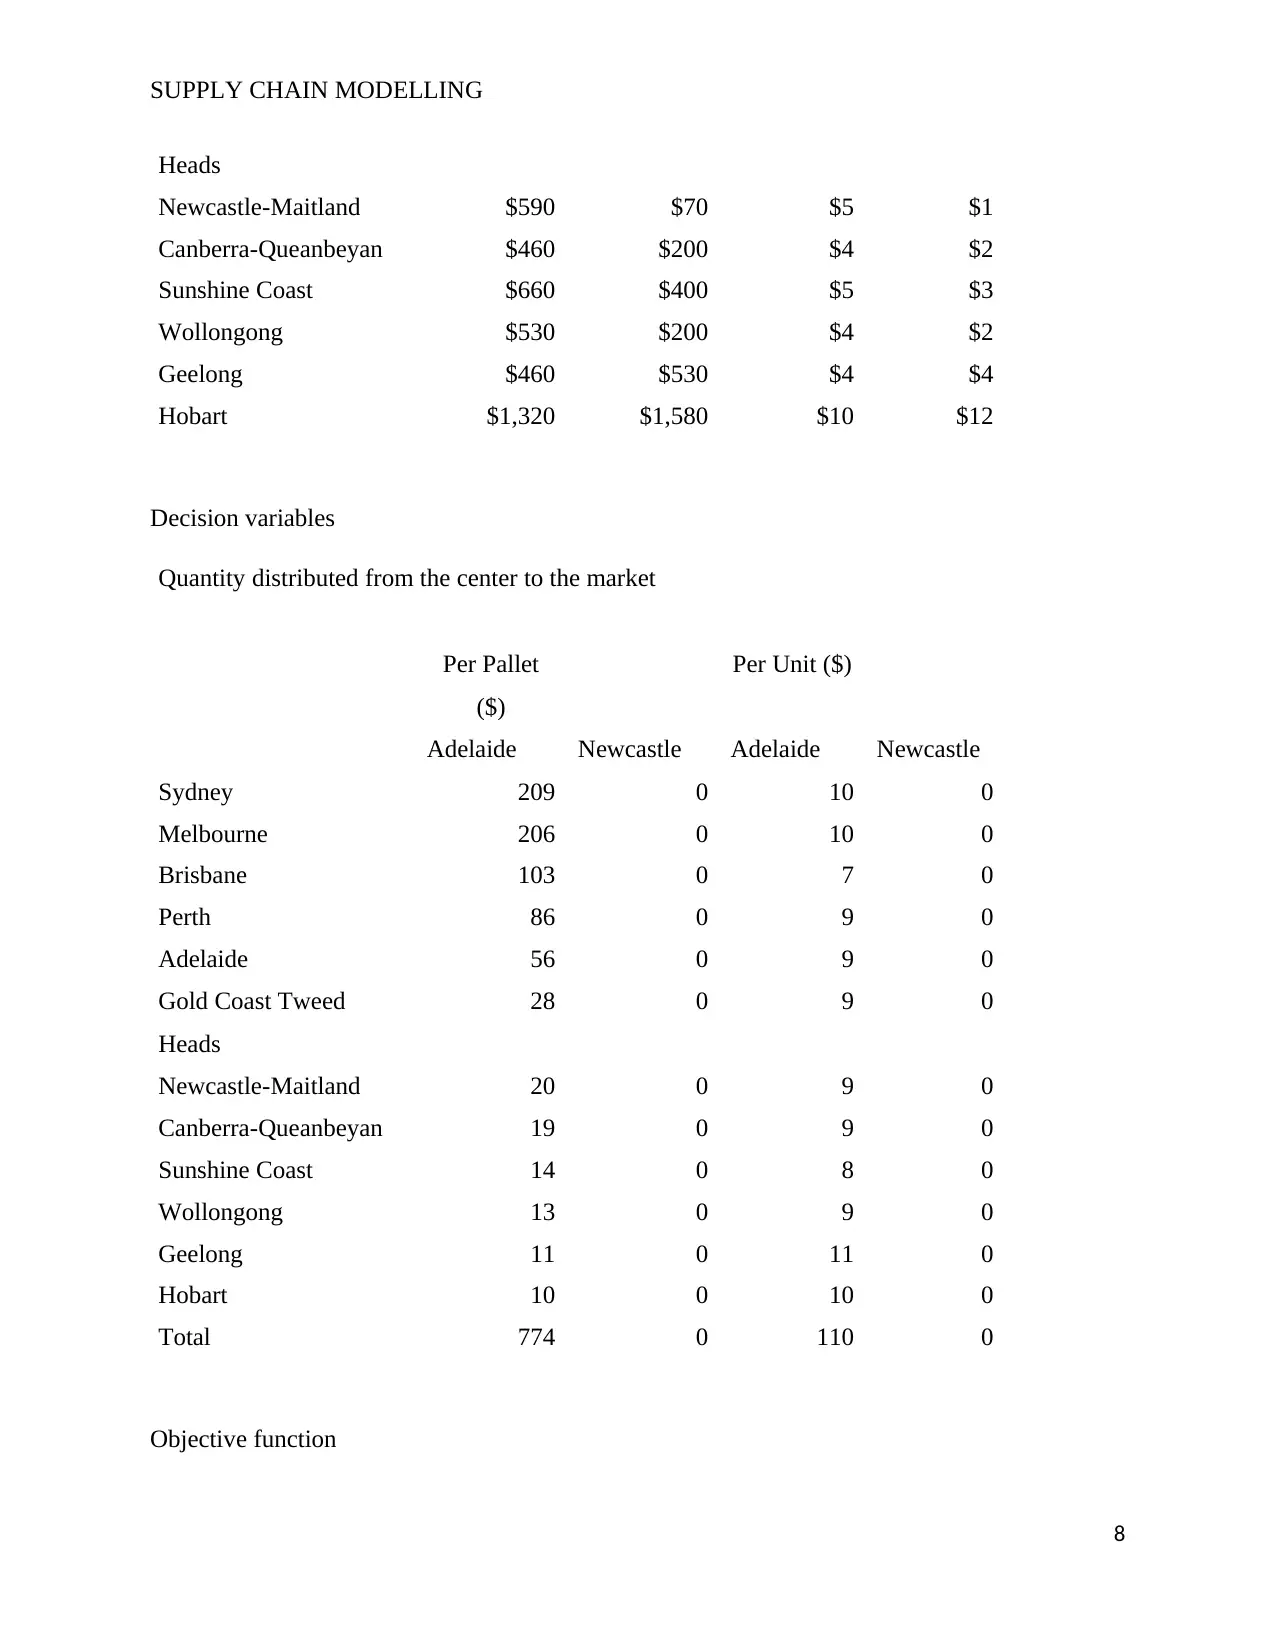
Heads
Newcastle-Maitland $590 $70 $5 $1
Canberra-Queanbeyan $460 $200 $4 $2
Sunshine Coast $660 $400 $5 $3
Wollongong $530 $200 $4 $2
Geelong $460 $530 $4 $4
Hobart $1,320 $1,580 $10 $12
Decision variables
Quantity distributed from the center to the market
Per Pallet
($)
Per Unit ($)
Adelaide Newcastle Adelaide Newcastle
Sydney 209 0 10 0
Melbourne 206 0 10 0
Brisbane 103 0 7 0
Perth 86 0 9 0
Adelaide 56 0 9 0
Gold Coast Tweed
Heads
28 0 9 0
Newcastle-Maitland 20 0 9 0
Canberra-Queanbeyan 19 0 9 0
Sunshine Coast 14 0 8 0
Wollongong 13 0 9 0
Geelong 11 0 11 0
Hobart 10 0 10 0
Total 774 0 110 0
Objective function
8
Heads
Newcastle-Maitland $590 $70 $5 $1
Canberra-Queanbeyan $460 $200 $4 $2
Sunshine Coast $660 $400 $5 $3
Wollongong $530 $200 $4 $2
Geelong $460 $530 $4 $4
Hobart $1,320 $1,580 $10 $12
Decision variables
Quantity distributed from the center to the market
Per Pallet
($)
Per Unit ($)
Adelaide Newcastle Adelaide Newcastle
Sydney 209 0 10 0
Melbourne 206 0 10 0
Brisbane 103 0 7 0
Perth 86 0 9 0
Adelaide 56 0 9 0
Gold Coast Tweed
Heads
28 0 9 0
Newcastle-Maitland 20 0 9 0
Canberra-Queanbeyan 19 0 9 0
Sunshine Coast 14 0 8 0
Wollongong 13 0 9 0
Geelong 11 0 11 0
Hobart 10 0 10 0
Total 774 0 110 0
Objective function
8
SUPPLY CHAIN MODELLING
Total cost of
distribution to the
market
$415,231
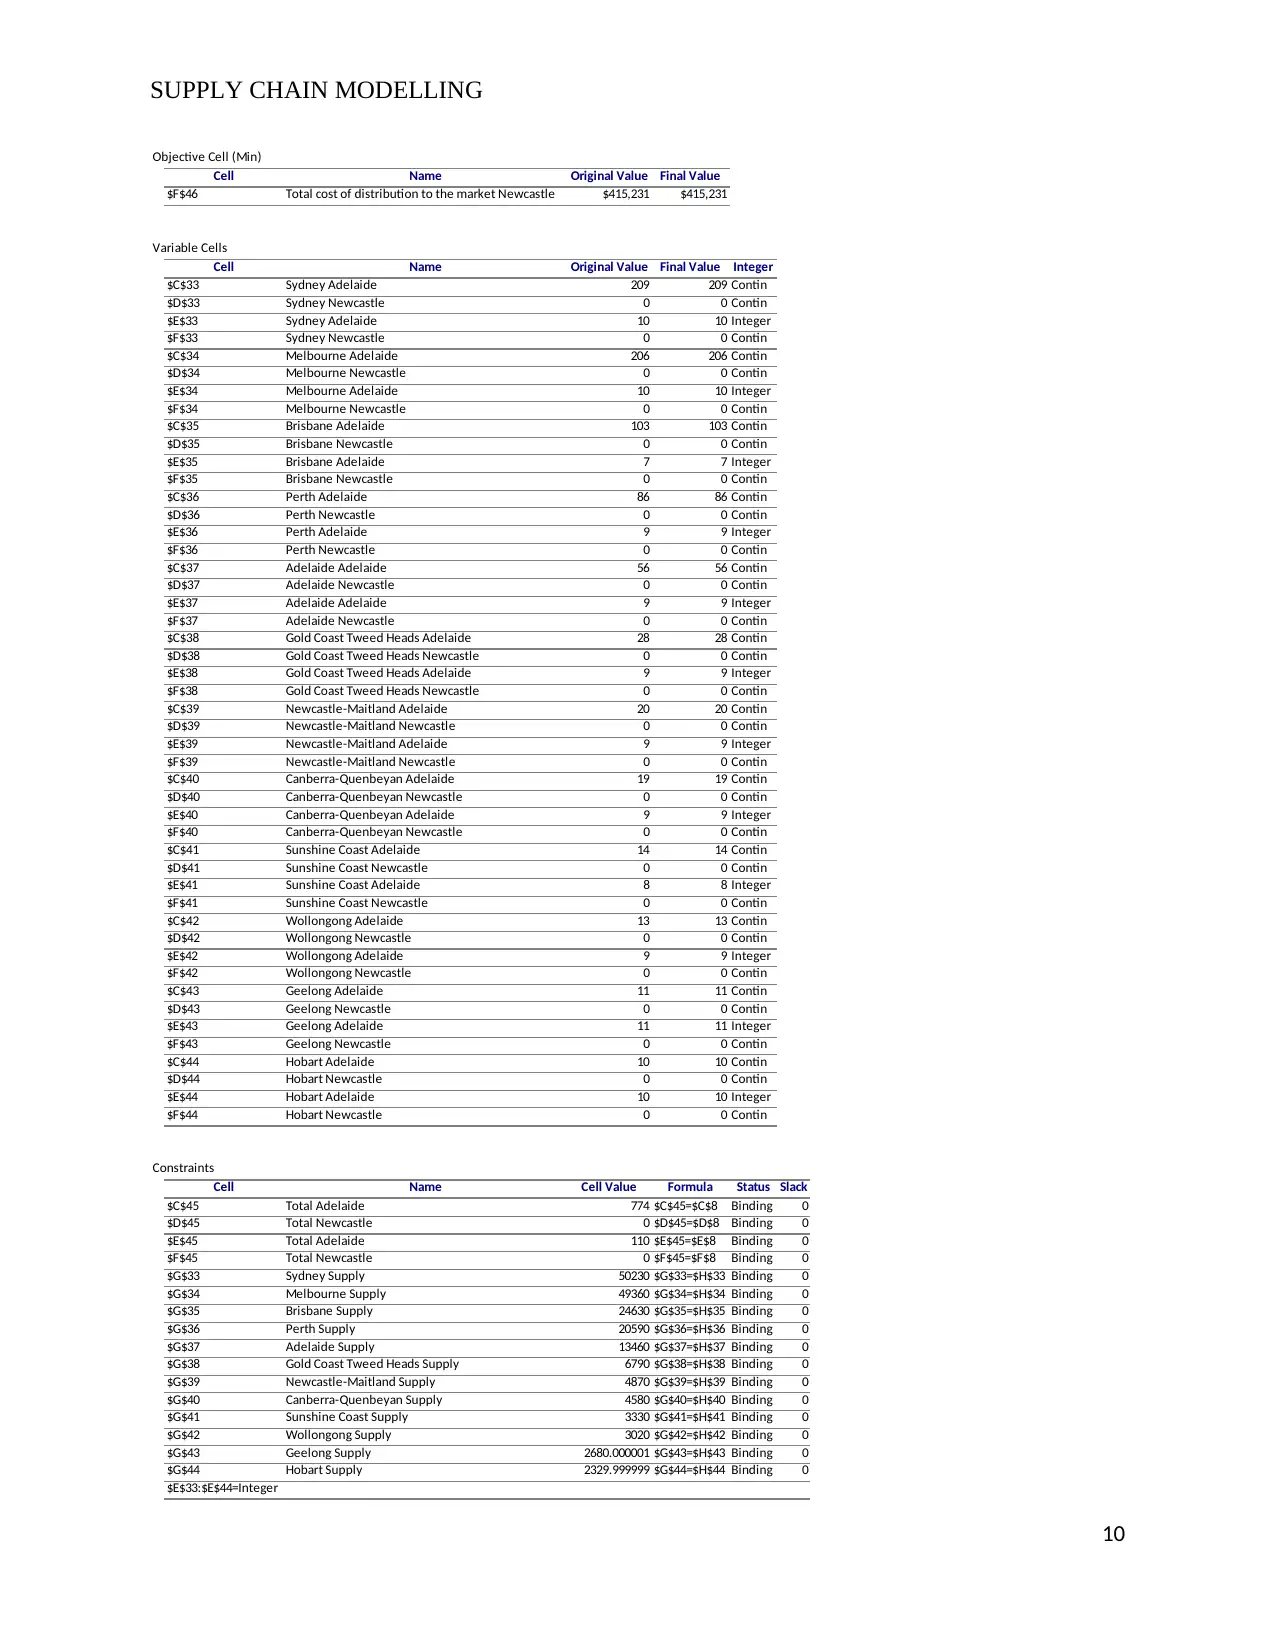
This generate the output given below
9
Total cost of
distribution to the
market
$415,231
This generate the output given below
9
⊘ This is a preview!⊘
Do you want full access?
Subscribe today to unlock all pages.
Trusted by 1+ million students worldwide
SUPPLY CHAIN MODELLING
Objective Cell (Min)
Cell Name Original Value Final Value
$F$46 Total cost of distribution to the market Newcastle $415,231 $415,231
Variable Cells
Cell Name Original Value Final Value Integer
$C$33 Sydney Adelaide 209 209 Contin
$D$33 Sydney Newcastle 0 0 Contin
$E$33 Sydney Adelaide 10 10 Integer
$F$33 Sydney Newcastle 0 0 Contin
$C$34 Melbourne Adelaide 206 206 Contin
$D$34 Melbourne Newcastle 0 0 Contin
$E$34 Melbourne Adelaide 10 10 Integer
$F$34 Melbourne Newcastle 0 0 Contin
$C$35 Brisbane Adelaide 103 103 Contin
$D$35 Brisbane Newcastle 0 0 Contin
$E$35 Brisbane Adelaide 7 7 Integer
$F$35 Brisbane Newcastle 0 0 Contin
$C$36 Perth Adelaide 86 86 Contin
$D$36 Perth Newcastle 0 0 Contin
$E$36 Perth Adelaide 9 9 Integer
$F$36 Perth Newcastle 0 0 Contin
$C$37 Adelaide Adelaide 56 56 Contin
$D$37 Adelaide Newcastle 0 0 Contin
$E$37 Adelaide Adelaide 9 9 Integer
$F$37 Adelaide Newcastle 0 0 Contin
$C$38 Gold Coast Tweed Heads Adelaide 28 28 Contin
$D$38 Gold Coast Tweed Heads Newcastle 0 0 Contin
$E$38 Gold Coast Tweed Heads Adelaide 9 9 Integer
$F$38 Gold Coast Tweed Heads Newcastle 0 0 Contin
$C$39 Newcastle-Maitland Adelaide 20 20 Contin
$D$39 Newcastle-Maitland Newcastle 0 0 Contin
$E$39 Newcastle-Maitland Adelaide 9 9 Integer
$F$39 Newcastle-Maitland Newcastle 0 0 Contin
$C$40 Canberra-Quenbeyan Adelaide 19 19 Contin
$D$40 Canberra-Quenbeyan Newcastle 0 0 Contin
$E$40 Canberra-Quenbeyan Adelaide 9 9 Integer
$F$40 Canberra-Quenbeyan Newcastle 0 0 Contin
$C$41 Sunshine Coast Adelaide 14 14 Contin
$D$41 Sunshine Coast Newcastle 0 0 Contin
$E$41 Sunshine Coast Adelaide 8 8 Integer
$F$41 Sunshine Coast Newcastle 0 0 Contin
$C$42 Wollongong Adelaide 13 13 Contin
$D$42 Wollongong Newcastle 0 0 Contin
$E$42 Wollongong Adelaide 9 9 Integer
$F$42 Wollongong Newcastle 0 0 Contin
$C$43 Geelong Adelaide 11 11 Contin
$D$43 Geelong Newcastle 0 0 Contin
$E$43 Geelong Adelaide 11 11 Integer
$F$43 Geelong Newcastle 0 0 Contin
$C$44 Hobart Adelaide 10 10 Contin
$D$44 Hobart Newcastle 0 0 Contin
$E$44 Hobart Adelaide 10 10 Integer
$F$44 Hobart Newcastle 0 0 Contin
Constraints
Cell Name Cell Value Formula Status Slack
$C$45 Total Adelaide 774 $C$45=$C$8 Binding 0
$D$45 Total Newcastle 0 $D$45=$D$8 Binding 0
$E$45 Total Adelaide 110 $E$45=$E$8 Binding 0
$F$45 Total Newcastle 0 $F$45=$F$8 Binding 0
$G$33 Sydney Supply 50230 $G$33=$H$33 Binding 0
$G$34 Melbourne Supply 49360 $G$34=$H$34 Binding 0
$G$35 Brisbane Supply 24630 $G$35=$H$35 Binding 0
$G$36 Perth Supply 20590 $G$36=$H$36 Binding 0
$G$37 Adelaide Supply 13460 $G$37=$H$37 Binding 0
$G$38 Gold Coast Tweed Heads Supply 6790 $G$38=$H$38 Binding 0
$G$39 Newcastle-Maitland Supply 4870 $G$39=$H$39 Binding 0
$G$40 Canberra-Quenbeyan Supply 4580 $G$40=$H$40 Binding 0
$G$41 Sunshine Coast Supply 3330 $G$41=$H$41 Binding 0
$G$42 Wollongong Supply 3020 $G$42=$H$42 Binding 0
$G$43 Geelong Supply 2680.000001 $G$43=$H$43 Binding 0
$G$44 Hobart Supply 2329.999999 $G$44=$H$44 Binding 0
$E$33:$E$44=Integer
10
Paraphrase This Document
Need a fresh take? Get an instant paraphrase of this document with our AI Paraphraser
SUPPLY CHAIN MODELLING
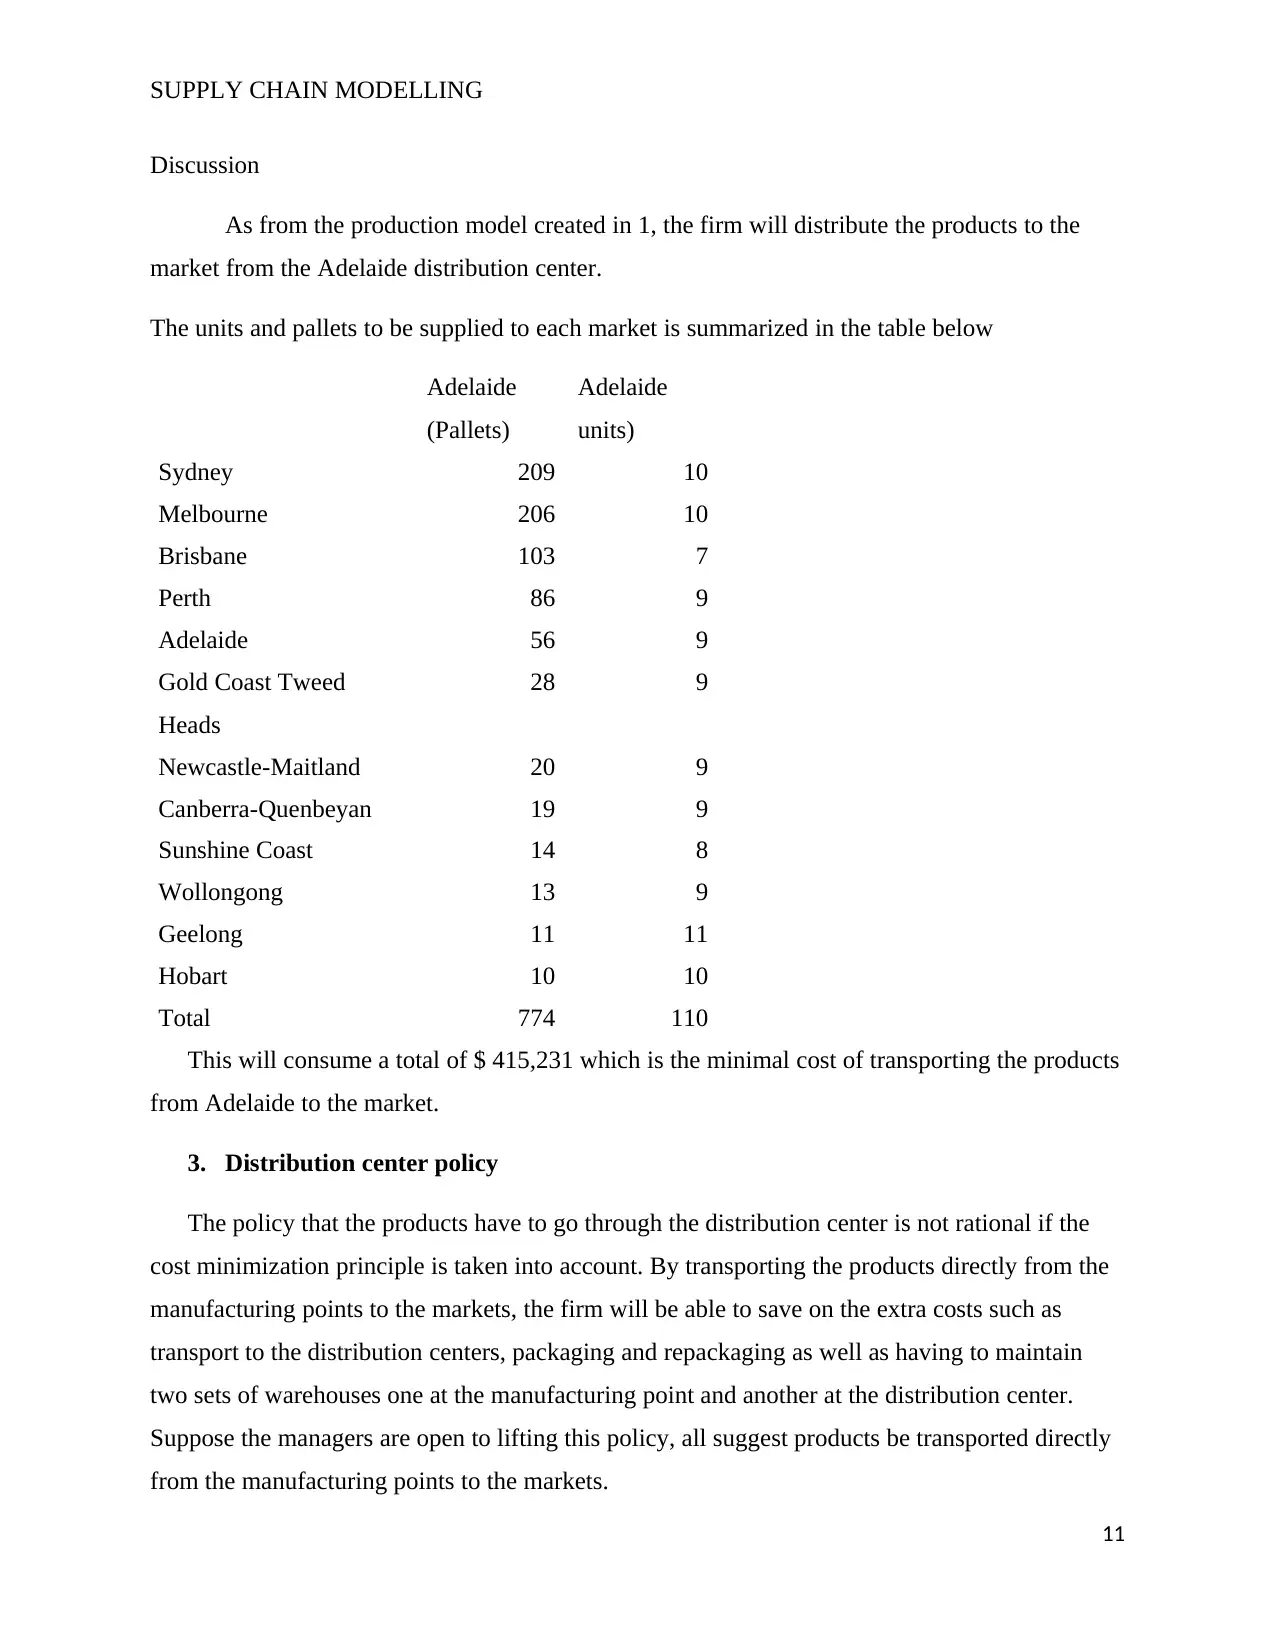
Discussion
As from the production model created in 1, the firm will distribute the products to the
market from the Adelaide distribution center.
The units and pallets to be supplied to each market is summarized in the table below
Adelaide
(Pallets)
Adelaide
units)
Sydney 209 10
Melbourne 206 10
Brisbane 103 7
Perth 86 9
Adelaide 56 9
Gold Coast Tweed
Heads
28 9
Newcastle-Maitland 20 9
Canberra-Quenbeyan 19 9
Sunshine Coast 14 8
Wollongong 13 9
Geelong 11 11
Hobart 10 10
Total 774 110
This will consume a total of $ 415,231 which is the minimal cost of transporting the products
from Adelaide to the market.
3. Distribution center policy
The policy that the products have to go through the distribution center is not rational if the
cost minimization principle is taken into account. By transporting the products directly from the
manufacturing points to the markets, the firm will be able to save on the extra costs such as
transport to the distribution centers, packaging and repackaging as well as having to maintain
two sets of warehouses one at the manufacturing point and another at the distribution center.
Suppose the managers are open to lifting this policy, all suggest products be transported directly
from the manufacturing points to the markets.
11
SUPPLY CHAIN MODELLING
For this change to have an impact on the transport cost, the management of Dronautics will
need to conduct an analysis on the existing costs of direct transport from the manufacturing
points to the markets. This will allow obtaining of gainful data that can be useful on making the
decision of the optimal transport rout to take. Furthermore, by eliminating the distribution
centers am expecting the cost of running the business to drop as well as an improvement on
customer satisfaction through quicker delivery of products.
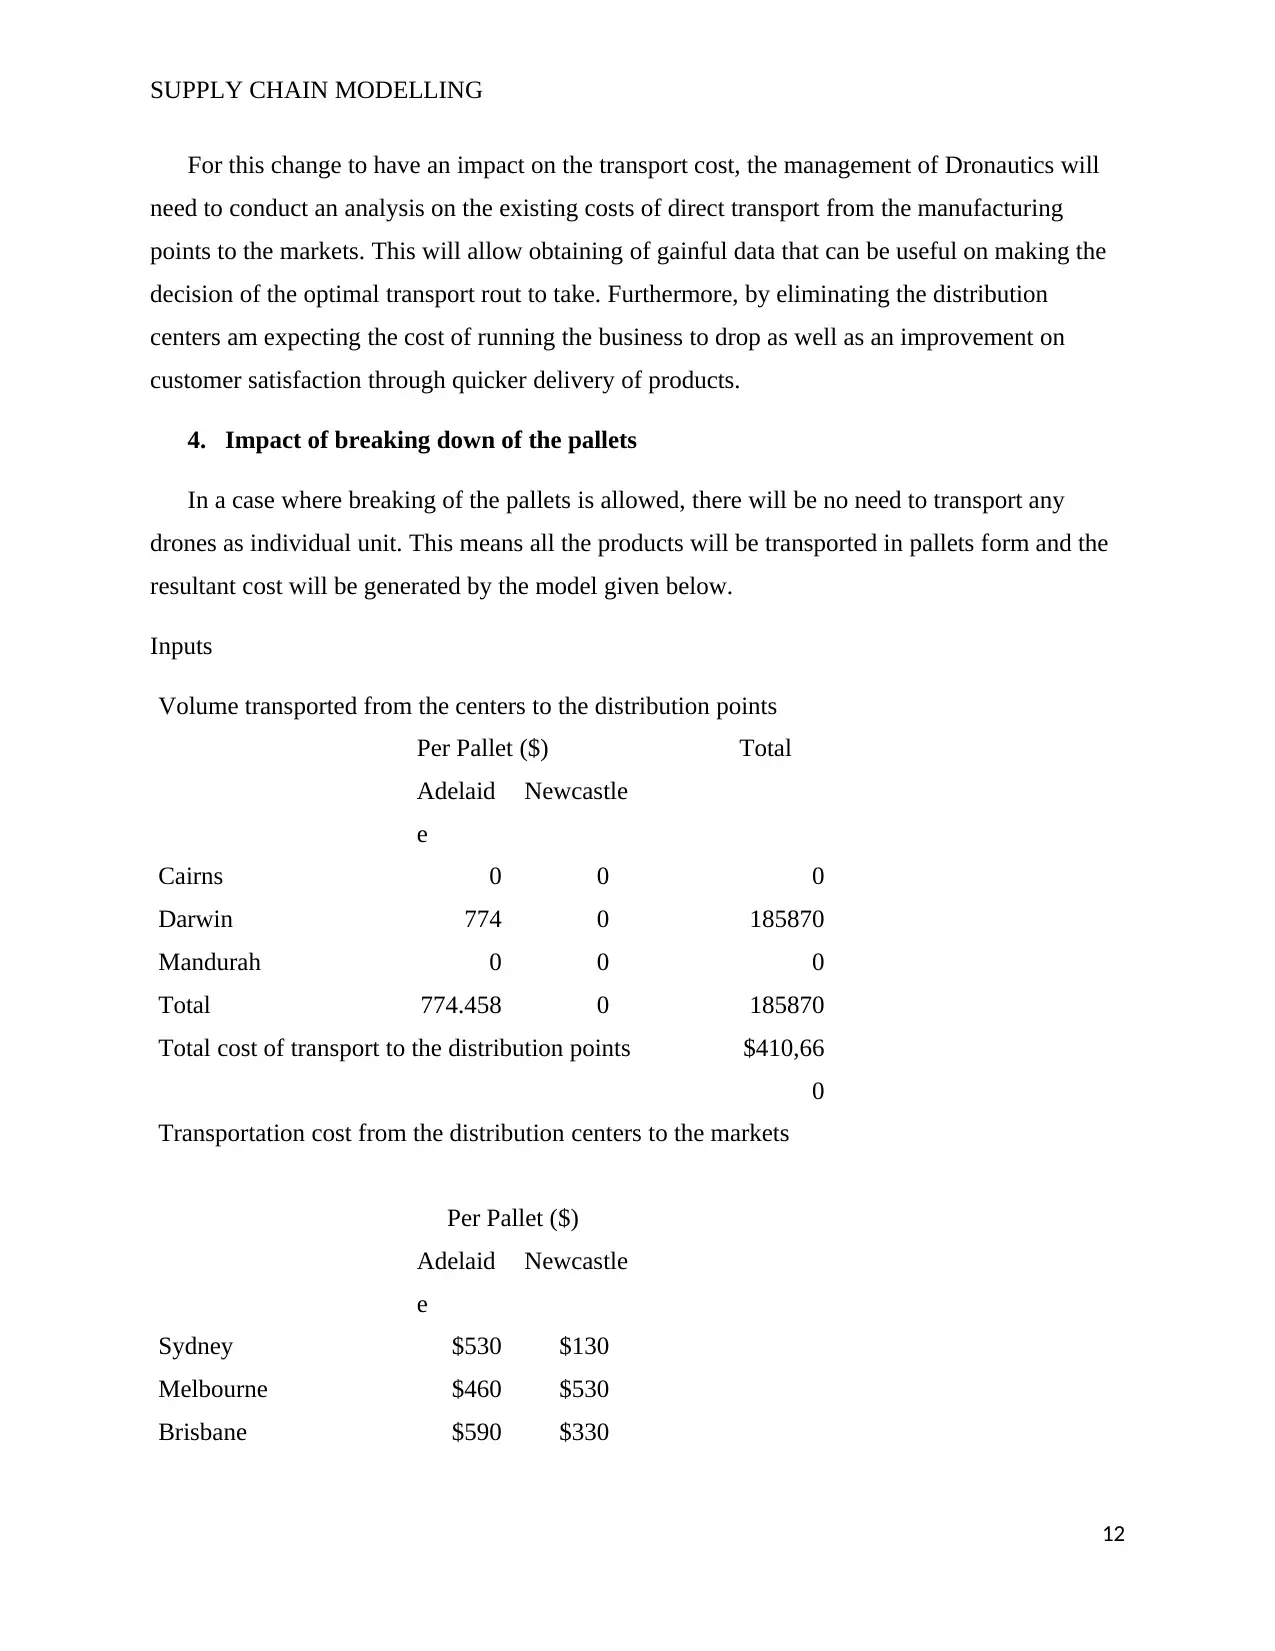
4. Impact of breaking down of the pallets
In a case where breaking of the pallets is allowed, there will be no need to transport any
drones as individual unit. This means all the products will be transported in pallets form and the
resultant cost will be generated by the model given below.
Inputs
Volume transported from the centers to the distribution points
Per Pallet ($) Total
Adelaid
e
Newcastle
Cairns 0 0 0
Darwin 774 0 185870
Mandurah 0 0 0
Total 774.458 0 185870
Total cost of transport to the distribution points $410,66
0
Transportation cost from the distribution centers to the markets
Per Pallet ($)
Adelaid
e
Newcastle
Sydney $530 $130
Melbourne $460 $530
Brisbane $590 $330
12
For this change to have an impact on the transport cost, the management of Dronautics will
need to conduct an analysis on the existing costs of direct transport from the manufacturing
points to the markets. This will allow obtaining of gainful data that can be useful on making the
decision of the optimal transport rout to take. Furthermore, by eliminating the distribution
centers am expecting the cost of running the business to drop as well as an improvement on
customer satisfaction through quicker delivery of products.
4. Impact of breaking down of the pallets
In a case where breaking of the pallets is allowed, there will be no need to transport any
drones as individual unit. This means all the products will be transported in pallets form and the
resultant cost will be generated by the model given below.
Inputs
Volume transported from the centers to the distribution points
Per Pallet ($) Total
Adelaid
e
Newcastle
Cairns 0 0 0
Darwin 774 0 185870
Mandurah 0 0 0
Total 774.458 0 185870
Total cost of transport to the distribution points $410,66
0
Transportation cost from the distribution centers to the markets
Per Pallet ($)
Adelaid
e
Newcastle
Sydney $530 $130
Melbourne $460 $530
Brisbane $590 $330
12
⊘ This is a preview!⊘
Do you want full access?
Subscribe today to unlock all pages.
Trusted by 1+ million students worldwide
1 out of 21
Related Documents


Your All-in-One AI-Powered Toolkit for Academic Success.
+13062052269
info@desklib.com
Available 24*7 on WhatsApp / Email
![[object Object]](/_next/static/media/star-bottom.7253800d.svg)
Unlock your academic potential
Copyright © 2020–2026 A2Z Services. All Rights Reserved. Developed and managed by ZUCOL.