Radiometer Medical: Data Analysis of SCM and Business Performance
VerifiedAdded on  2022/11/28
|79
|7536
|299
Report
AI Summary
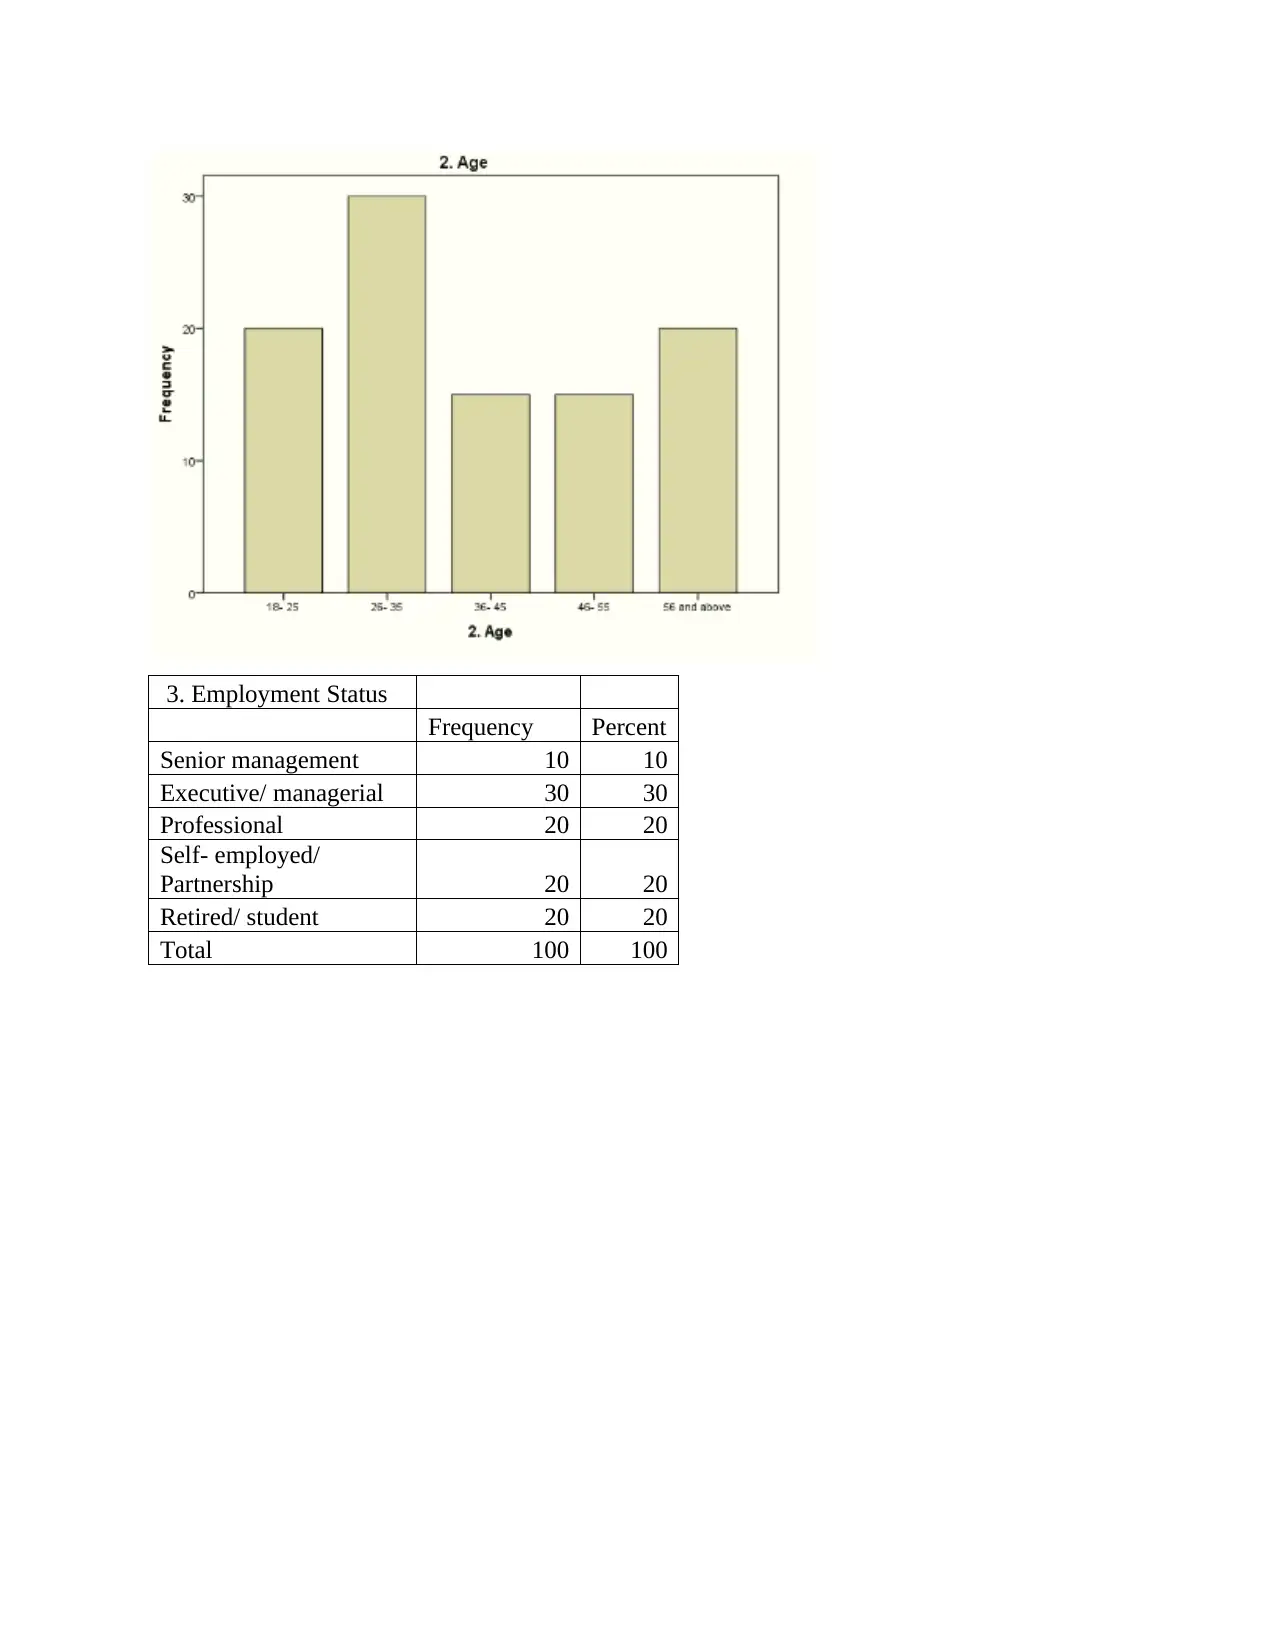
This report presents a comprehensive data analysis of supply chain management (SCM) practices and their impact on business performance, specifically focusing on the Radiometer Medical company. The study utilizes SPSS to analyze survey data collected from 100 employees, examining demographic profiles, descriptive statistics, and conducting normality and reliability analyses. Multiple regression analysis is employed to identify the relationship between SCM strategies and business outcomes. The findings are presented through tables, graphs, and percentages, offering insights into areas such as respondent profiles, understanding of SCM, competitive advantages, and the impact of SCM on product flow and financial position. The report concludes with recommendations for improving SCM, including strategies like total visibility, IT implementation, and effective training programs, along with limitations and suggestions for future research. This report is aimed to provide a comprehensive overview of SCM and its effect on business performance.

DATA FOR SPSS
Paraphrase This Document
Need a fresh take? Get an instant paraphrase of this document with our AI Paraphraser

TABLE OF CONTENTS
CHAPTER 4: DATA ANALYSIS AND FINDINGS.....................................................................3
Introduction..................................................................................................................................3
Survey Return Rate......................................................................................................................3
Respondent profile.......................................................................................................................3
Descriptive analysis.....................................................................................................................4
Normality analysis.....................................................................................................................28
Reliability analysis.....................................................................................................................66
Multiple regression....................................................................................................................67
Summary....................................................................................................................................68
CHAPTER 5: CONCLUSION......................................................................................................69
Introduction................................................................................................................................69
Conclusion on concept of SCM.................................................................................................69
Conclusion on different strategies of SCM...............................................................................70
Conclusion on impact of improved SCM on business performance.........................................70
Present Study Contribution........................................................................................................71
Summary....................................................................................................................................71
CHAPTER 6: RECOMMENDATION..........................................................................................73
Introduction................................................................................................................................73
Recommended Strategy 1: Total visibility in supply chain management process...................73
Recommended Strategy 2: Implementation of information technology for providing report to
patients.......................................................................................................................................74
Recommended Strategy 3: Effective training and development program implementation.......75
Limitation of study....................................................................................................................76
Suggestion for future research...................................................................................................76
Summary....................................................................................................................................76
REFERENCES................................................................................................................................1

CHAPTER 4: DATA ANALYSIS AND FINDINGS
Introduction
The data analysis and findings chapter are the most crucial and important chapter of the
whole thesis because the result of the study depends upon this section outcome only. For
analysing the data which is collected from the 100 employees of the Radiometer, the SPSS tool
will be used in the present study. This chapter will discuss and ensure that the data gathered from
the primary and secondary sources such as journal, books, websites, literature review must be
presented and interpreted clearly by using the tables, graphs and percentage if possible. The
overall aim of this study to identify the impact of the improving supply chain management over
the performance of the business such as Radiometer Medical company. This chapter will also
analyse the demographic data in order to identify the gender, martial status and age etc. of each
of the selected employees.
Survey Return Rate
According to the opinion of Hendra and Hill (2019), the survey response and return rate
means the rate of the respondent receiving and completing the survey accordingly. This return
rate is very important for analysing the data collected because the employees which do not
complete but only responded on the survey are not considered as a part of analysis. The survey
return rate is a percentage of the number of the employees completed the survey out of the total
number of the responded employees. In order to calculate the survey, return rate the following
formula is being used and that is Number of completed survey responses/ Total number of
survey respondents* 100. For data analysis, it is important for the researcher that the good survey
response rate will be come out, otherwise the readers and users will assume that the current study
questionnaire is not valid, up-to-date and reliable questions. In case if the survey collects the
lower response rate, than the data and information which is collected from the employees and
analysed will not be consider as representative of general population.
Respondent profile
The respondent selected for the present study includes the entire member within the
population. This is particularly because of the reason that the method of sampling undertaken is
the use of simple random sampling where in each and every participant within the population
equal chance of getting selected has.
⊘ This is a preview!⊘
Do you want full access?
Subscribe today to unlock all pages.

Trusted by 1+ million students worldwide

Descriptive analysis
1.
Gender
Frequency Percent
Male 61 61
Female 39 39
Total 100 100
2. Age
Frequency Percent
18- 25 20 20
26- 35 30 30
36- 45 15 15
46- 55 15 15
56 and
above 20 20
Total 100 100
1.
Gender
Frequency Percent
Male 61 61
Female 39 39
Total 100 100
2. Age
Frequency Percent
18- 25 20 20
26- 35 30 30
36- 45 15 15
46- 55 15 15
56 and
above 20 20
Total 100 100
Paraphrase This Document
Need a fresh take? Get an instant paraphrase of this document with our AI Paraphraser

3. Employment Status
Frequency Percent
Senior management 10 10
Executive/ managerial 30 30
Professional 20 20
Self- employed/
Partnership 20 20
Retired/ student 20 20
Total 100 100
Frequency Percent
Senior management 10 10
Executive/ managerial 30 30
Professional 20 20
Self- employed/
Partnership 20 20
Retired/ student 20 20
Total 100 100

4. Marital Status
Frequency Percent
Single 10 10
Married- with no
kids 50 50
Married- with kids 20 20
Others 20 20
Total 100 100
Frequency Percent
Single 10 10
Married- with no
kids 50 50
Married- with kids 20 20
Others 20 20
Total 100 100
⊘ This is a preview!⊘
Do you want full access?
Subscribe today to unlock all pages.

Trusted by 1+ million students worldwide

5. Length of
Service in the
current
Company
Frequency Percent
Less than 2
years 10 10
2- 3 years 10 10
4- 5 years 40 40
6- 10 years 30 30
11 and above 10 10
Total 100 100
Service in the
current
Company
Frequency Percent
Less than 2
years 10 10
2- 3 years 10 10
4- 5 years 40 40
6- 10 years 30 30
11 and above 10 10
Total 100 100
Paraphrase This Document
Need a fresh take? Get an instant paraphrase of this document with our AI Paraphraser

Do you have
understanding
about the
supply chain
management in
context to
business?
Frequency Percent
Strongly
disagree 15 15
Disagree 15 15
Neutral 10 10
Agree 35 35
Strongly agree 25 25
Total 100 100
understanding
about the
supply chain
management in
context to
business?
Frequency Percent
Strongly
disagree 15 15
Disagree 15 15
Neutral 10 10
Agree 35 35
Strongly agree 25 25
Total 100 100

As per your
viewpoint,
does supply
chain
management
helps the firm
to gain
competitive
advantages?
Frequency Percent
Strongly
disagree 15 15
Disagree 25 25
Neutral 5 5
Agree 15 15
Strongly agree 40 40
Total 100 100
viewpoint,
does supply
chain
management
helps the firm
to gain
competitive
advantages?
Frequency Percent
Strongly
disagree 15 15
Disagree 25 25
Neutral 5 5
Agree 15 15
Strongly agree 40 40
Total 100 100
⊘ This is a preview!⊘
Do you want full access?
Subscribe today to unlock all pages.

Trusted by 1+ million students worldwide

According to
you, does
supply chain
develops
negative
impact on the
business
performance?
Frequency Percent
Strongly
disagree 33 33
Disagree 15 15
Neutral 11 11
Agree 20 20
Strongly agree 21 21
Total 100 100
you, does
supply chain
develops
negative
impact on the
business
performance?
Frequency Percent
Strongly
disagree 33 33
Disagree 15 15
Neutral 11 11
Agree 20 20
Strongly agree 21 21
Total 100 100
Paraphrase This Document
Need a fresh take? Get an instant paraphrase of this document with our AI Paraphraser

According to
your opinion,
does supply
chain
management
help company
to improve its
products flow?
Frequency Percent
Strongly
disagree 25 25
Disagree 15 15
Neutral 15 15
Agree 10 10
Strongly agree 35 35
Total 100 100
your opinion,
does supply
chain
management
help company
to improve its
products flow?
Frequency Percent
Strongly
disagree 25 25
Disagree 15 15
Neutral 15 15
Agree 10 10
Strongly agree 35 35
Total 100 100

According to
your opinion,
demand
forecasts and
production
planning helps
in improving
the supply
chain process?
Frequency Percent
Strongly
disagree 14 14
Disagree 26 26
Neutral 5 5
Agree 10 10
Strongly agree 45 45
Total 100 100
your opinion,
demand
forecasts and
production
planning helps
in improving
the supply
chain process?
Frequency Percent
Strongly
disagree 14 14
Disagree 26 26
Neutral 5 5
Agree 10 10
Strongly agree 45 45
Total 100 100
⊘ This is a preview!⊘
Do you want full access?
Subscribe today to unlock all pages.

Trusted by 1+ million students worldwide
1 out of 79
Related Documents
Your All-in-One AI-Powered Toolkit for Academic Success.
 +13062052269
info@desklib.com
Available 24*7 on WhatsApp / Email
Unlock your academic potential
Copyright © 2020–2025 A2Z Services. All Rights Reserved. Developed and managed by ZUCOL.


