C1_W1: Investigating Problems in Logistics, Supply Chains, and Systems
VerifiedAdded on 2022/12/05
|41
|9138
|212
Report
AI Summary
This report provides a comprehensive analysis of supply chain management, focusing on logistics, systems, and various methodologies. Part A delves into the application of AHP (Analytic Hierarchy Process) and TOPSIS techniques for warehouse prepositioning in humanitarian relief, covering pairwise matrix methods, priority weighting, and consistency analysis. Part B presents a literature survey on sustainable supply chain management, employing discourse analysis to examine environmental, social, and economic perspectives. Part C explores key logistics in the food sector, utilizing an input-output model and conceptual modeling to analyze the IT systems within food supply chain management. The report integrates quantitative and qualitative approaches to address complex operational problems, offering insights into decision-making processes and future evaluations in supply chain contexts. Desklib provides access to similar solved assignments and past papers for students.
Supply Chain management
Student Name:
Register Number:
Submission Date:
Work count:
1
Student Name:
Register Number:
Submission Date:
Work count:
1
Paraphrase This Document
Need a fresh take? Get an instant paraphrase of this document with our AI Paraphraser
Table of Contents
Part A.............................................................................................................................................................................. 3
Section-3..................................................................................................................................................................... 3
Question 1: Selecting AHP techniques....................................................................................................................3
Question 2:Operation methods of AHP techniques...............................................................................................4
Group working and AHP........................................................................................................................................... 5
Pairwise matrix method......................................................................................................................................... 6
Priority weight........................................................................................................................................................ 9
Lambda max.......................................................................................................................................................... 11
Random index...................................................................................................................................................... 12
Consistency index............................................................................................................................................... 14
Question 3:Result of AHP-TOPSIS technique.......................................................................................................15
Question 4:Research question............................................................................................................................... 21
Question 5: Future evaluation................................................................................................................................23
Part B............................................................................................................................................................................ 26
Question1: Literature survey.................................................................................................................................. 27
Delimitation and search for literature................................................................................................................27
Academic research of the supply chain management.....................................................................................27
Question 2: Discourse analysis............................................................................................................................. 29
Question 3: Finding analysis.................................................................................................................................. 29
Sustainable Supply Chain Management: Environment and Economy Point of View....................................30
Sustainable Supply Chain Management: Society and Environment Point of View.......................................31
Sustainable Supply Chain Management: Society and Economy Point of View.............................................31
Sustainable Supply Chain Management: Environment, Society, and Economy Point of View....................31
Part C............................................................................................................................................................................ 32
Key logistics of the food sector............................................................................................................................. 32
Perspective analysis,.............................................................................................................................................. 33
Input-output model............................................................................................................................................... 34
Data collection...................................................................................................................................................... 34
IT system of Food sector supply chain management......................................................................................35
Conceptual model.................................................................................................................................................... 36
Food sector Model:.............................................................................................................................................. 36
Reference..................................................................................................................................................................... 37
2
Part A
Section-3
Question 1: Selecting AHP techniques
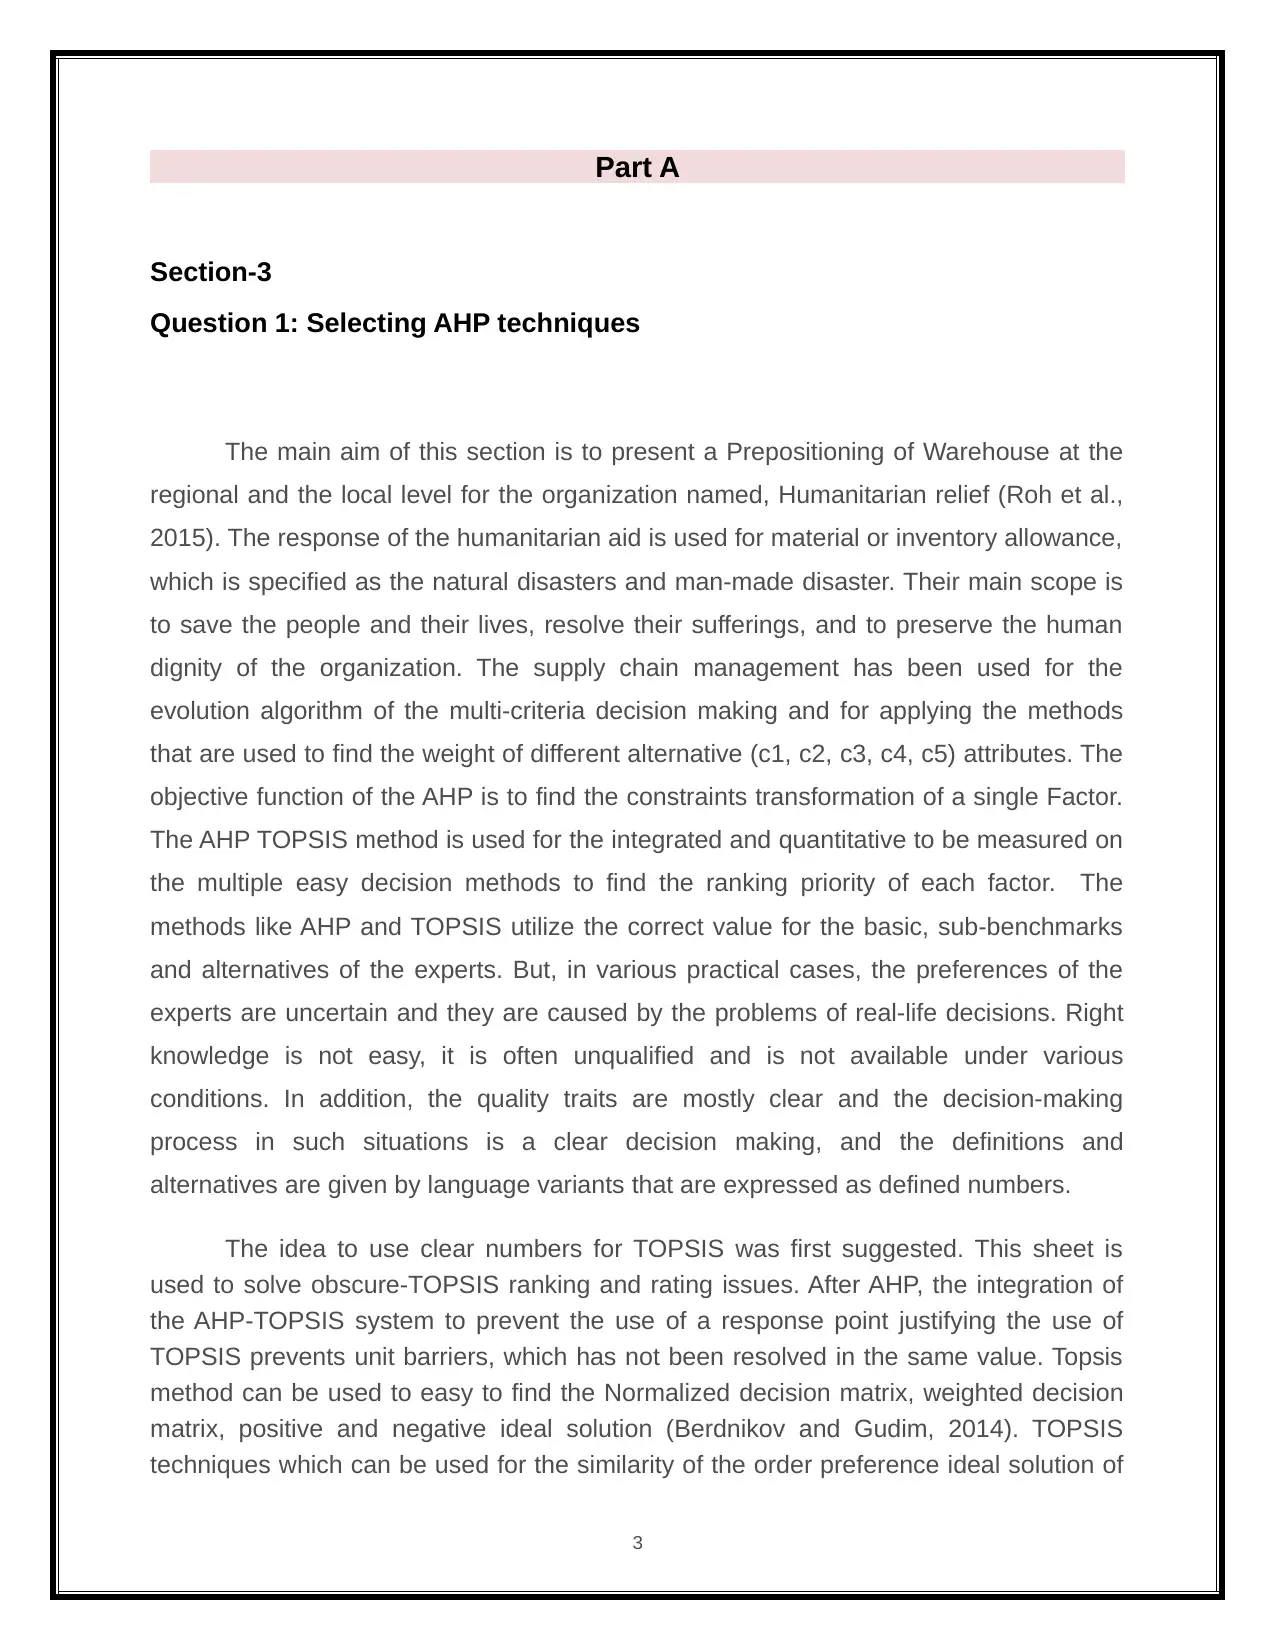
The main aim of this section is to present a Prepositioning of Warehouse at the
regional and the local level for the organization named, Humanitarian relief (Roh et al.,
2015). The response of the humanitarian aid is used for material or inventory allowance,
which is specified as the natural disasters and man-made disaster. Their main scope is
to save the people and their lives, resolve their sufferings, and to preserve the human
dignity of the organization. The supply chain management has been used for the
evolution algorithm of the multi-criteria decision making and for applying the methods
that are used to find the weight of different alternative (c1, c2, c3, c4, c5) attributes. The
objective function of the AHP is to find the constraints transformation of a single Factor.
The AHP TOPSIS method is used for the integrated and quantitative to be measured on
the multiple easy decision methods to find the ranking priority of each factor. The
methods like AHP and TOPSIS utilize the correct value for the basic, sub-benchmarks
and alternatives of the experts. But, in various practical cases, the preferences of the
experts are uncertain and they are caused by the problems of real-life decisions. Right
knowledge is not easy, it is often unqualified and is not available under various
conditions. In addition, the quality traits are mostly clear and the decision-making
process in such situations is a clear decision making, and the definitions and
alternatives are given by language variants that are expressed as defined numbers.
The idea to use clear numbers for TOPSIS was first suggested. This sheet is
used to solve obscure-TOPSIS ranking and rating issues. After AHP, the integration of
the AHP-TOPSIS system to prevent the use of a response point justifying the use of
TOPSIS prevents unit barriers, which has not been resolved in the same value. Topsis
method can be used to easy to find the Normalized decision matrix, weighted decision
matrix, positive and negative ideal solution (Berdnikov and Gudim, 2014). TOPSIS
techniques which can be used for the similarity of the order preference ideal solution of
3
Section-3
Question 1: Selecting AHP techniques
The main aim of this section is to present a Prepositioning of Warehouse at the
regional and the local level for the organization named, Humanitarian relief (Roh et al.,
2015). The response of the humanitarian aid is used for material or inventory allowance,
which is specified as the natural disasters and man-made disaster. Their main scope is
to save the people and their lives, resolve their sufferings, and to preserve the human
dignity of the organization. The supply chain management has been used for the
evolution algorithm of the multi-criteria decision making and for applying the methods
that are used to find the weight of different alternative (c1, c2, c3, c4, c5) attributes. The
objective function of the AHP is to find the constraints transformation of a single Factor.
The AHP TOPSIS method is used for the integrated and quantitative to be measured on
the multiple easy decision methods to find the ranking priority of each factor. The
methods like AHP and TOPSIS utilize the correct value for the basic, sub-benchmarks
and alternatives of the experts. But, in various practical cases, the preferences of the
experts are uncertain and they are caused by the problems of real-life decisions. Right
knowledge is not easy, it is often unqualified and is not available under various
conditions. In addition, the quality traits are mostly clear and the decision-making
process in such situations is a clear decision making, and the definitions and
alternatives are given by language variants that are expressed as defined numbers.
The idea to use clear numbers for TOPSIS was first suggested. This sheet is
used to solve obscure-TOPSIS ranking and rating issues. After AHP, the integration of
the AHP-TOPSIS system to prevent the use of a response point justifying the use of
TOPSIS prevents unit barriers, which has not been resolved in the same value. Topsis
method can be used to easy to find the Normalized decision matrix, weighted decision
matrix, positive and negative ideal solution (Berdnikov and Gudim, 2014). TOPSIS
techniques which can be used for the similarity of the order preference ideal solution of
3
⊘ This is a preview!⊘
Do you want full access?
Subscribe today to unlock all pages.
Trusted by 1+ million students worldwide
the numerical method to specify the multi-criteria decision making of the supply chain
management.
For the purpose of selecting the TOPSIS method which specified the group
attributes let us donate the 5 criteria methods of the environmental aspects, cost, quality
factor, delivery product to the reliable time to customer, flexibility, and response demand
to the customer. It is easy to find environment marketing stories which improve the
management service of the warehouse selection. The TOPSIS techniques' purpose is
Multi-criteria analysis module which is specified as the respondent factor of the ranking
priority of each organization.
Question 2: Operation methods of AHP techniques
The selection of the operation method which is integrating by the AHP and TOPSIS is
following two kinds of stages that include,
• AHP (Analytic Hierarchy Process) consumption and group working identification.
• An alternative method of Fuzzy TOPSIS to find the ranking priority.
4
Paraphrase This Document
Need a fresh take? Get an instant paraphrase of this document with our AI Paraphraser
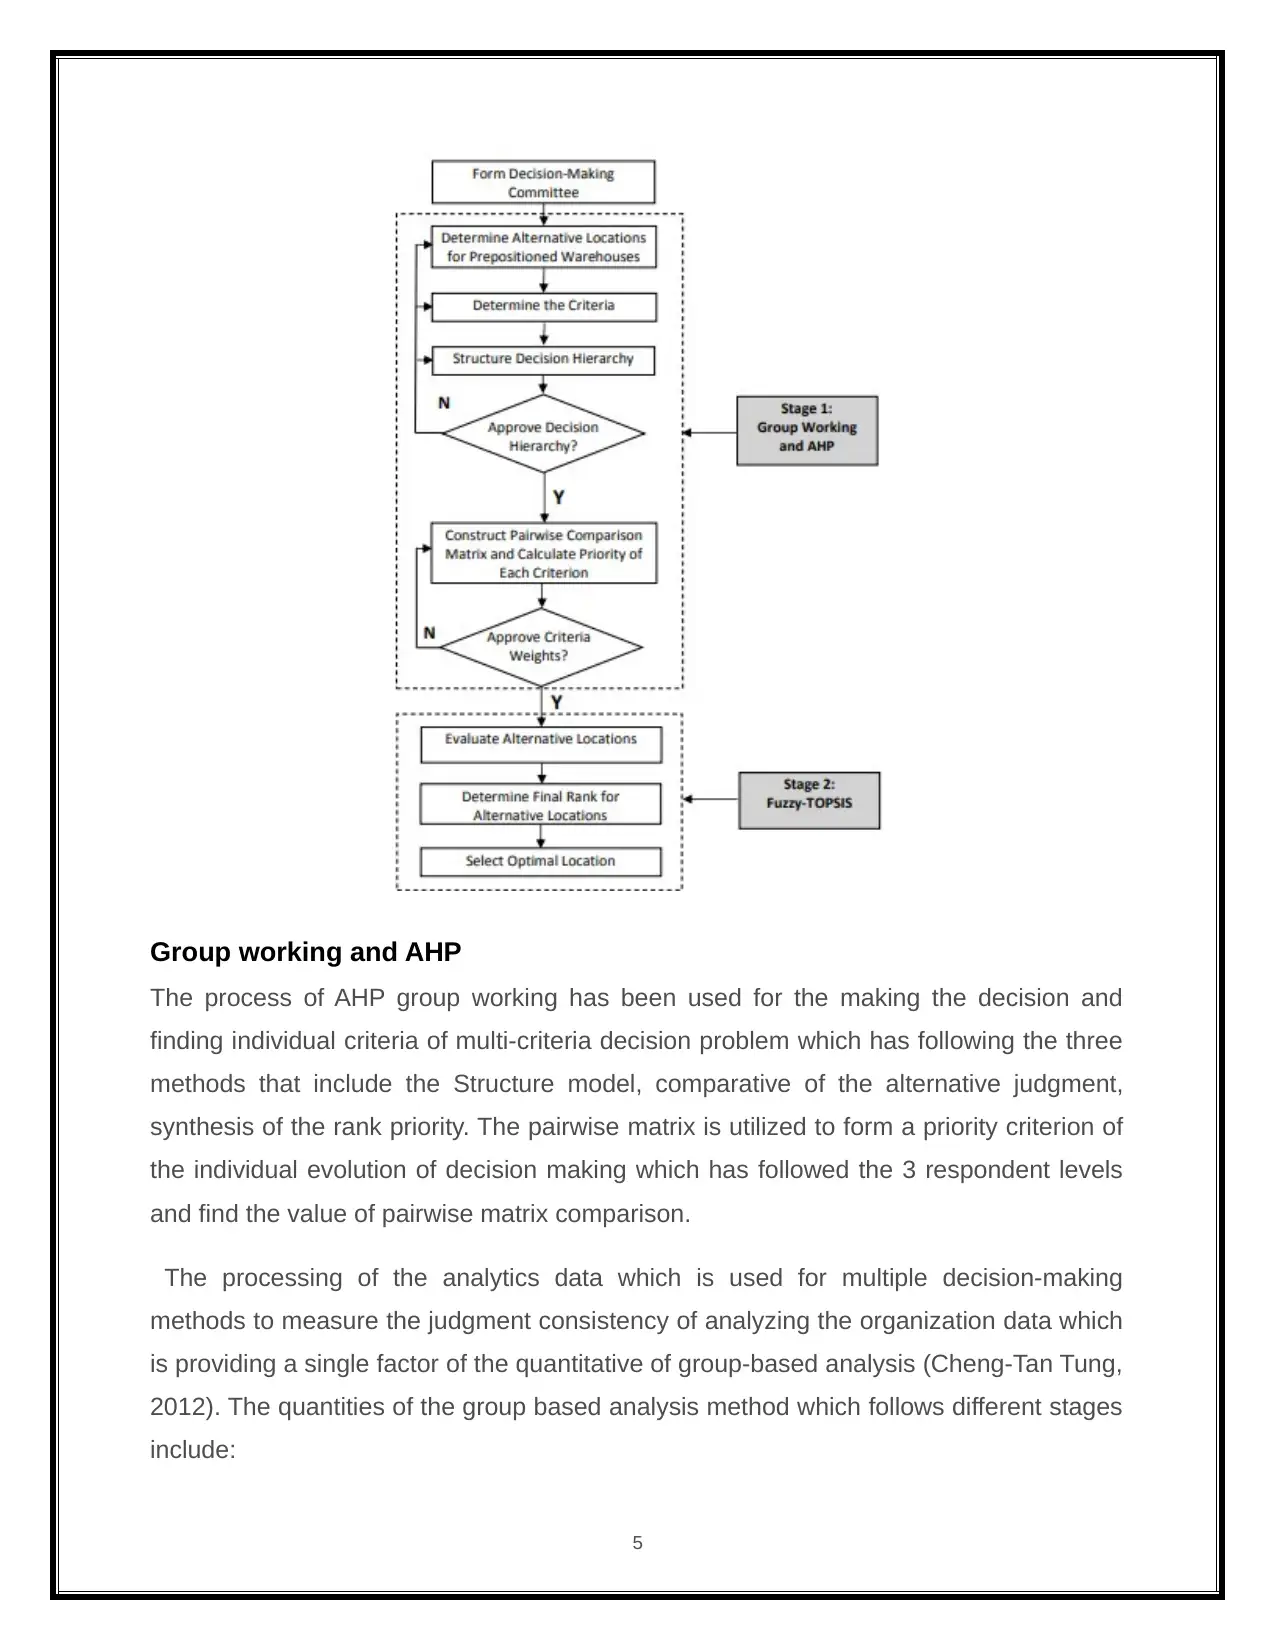
Group working and AHP
The process of AHP group working has been used for the making the decision and
finding individual criteria of multi-criteria decision problem which has following the three
methods that include the Structure model, comparative of the alternative judgment,
synthesis of the rank priority. The pairwise matrix is utilized to form a priority criterion of
the individual evolution of decision making which has followed the 3 respondent levels
and find the value of pairwise matrix comparison.
The processing of the analytics data which is used for multiple decision-making
methods to measure the judgment consistency of analyzing the organization data which
is providing a single factor of the quantitative of group-based analysis (Cheng-Tan Tung,
2012). The quantities of the group based analysis method which follows different stages
include:
5
Pairwise matrix
Priority weights
Lambda max
Random index
Consistency index
Identification of analysis hierarchy method
The AHP refers to a multiple-criteria decision-making process which helps in
setting the priorities of various attributes.
Decomposing the issues of decision making in a hierarchy.
Making pairwise comparisons and establishing the priorities between the
elements in a hierarchy.
Synthesize judgments.
Evaluating and checking the consistency of the judgments.
Procedure of the Analysis hierarchy method can follow a three types of methods that
include,
Developing each decision of the alternative methods.
Developing the weight methods,
Calculating the weight average rating decision alternative.
Among several Multi Criteria decision making methods, AHP is one method that was
initially designed by Prof (Ruiz Estrada, 2010). Thomas L. Saaty. So, it is a technique to
get ratio scales from the paired comparisons. The information can be received from
genuine estimation, for example, value, weight and so on, or from the subjective
choices for example, preferences and fulfillment sentiments. AHP permits few small
judgment inconsistency since the humans are not constantly reliable. The ratio scales
are determined using the principal Eigen vectors and the principal priority value is used
to extract the consistency record.
Pairwise matrix method
Let us make a relative scale to measure how much you like the Factors on the left (c1)
compared to the Factor (c5) on the right.
6
⊘ This is a preview!⊘
Do you want full access?
Subscribe today to unlock all pages.
Trusted by 1+ million students worldwide
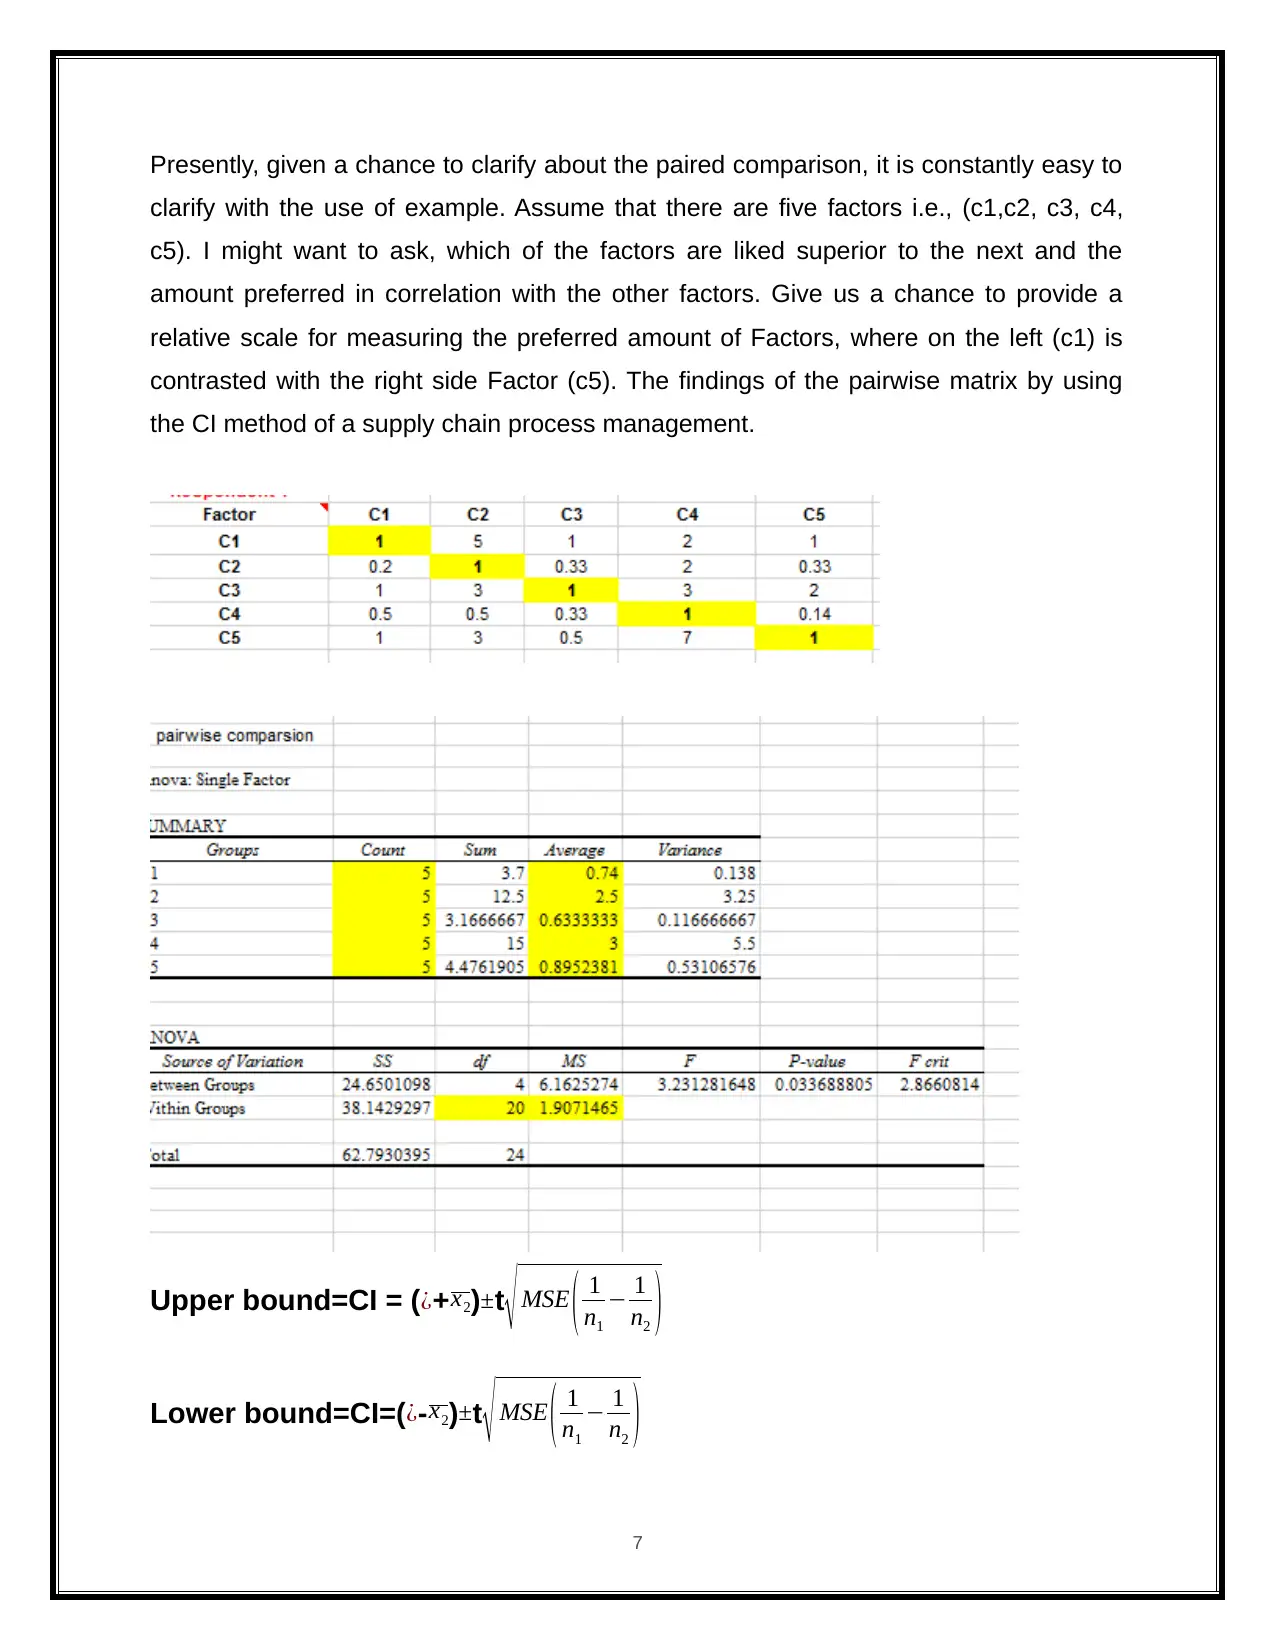
Presently, given a chance to clarify about the paired comparison, it is constantly easy to
clarify with the use of example. Assume that there are five factors i.e., (c1,c2, c3, c4,
c5). I might want to ask, which of the factors are liked superior to the next and the
amount preferred in correlation with the other factors. Give us a chance to provide a
relative scale for measuring the preferred amount of Factors, where on the left (c1) is
contrasted with the right side Factor (c5). The findings of the pairwise matrix by using
the CI method of a supply chain process management.
Upper bound=CI = ( ¿+x2)±t
√ MSE ( 1
n1
− 1
n2 )
Lower bound=CI=( ¿- x2)±t
√ MSE ( 1
n1
− 1
n2 )
7
Paraphrase This Document
Need a fresh take? Get an instant paraphrase of this document with our AI Paraphraser
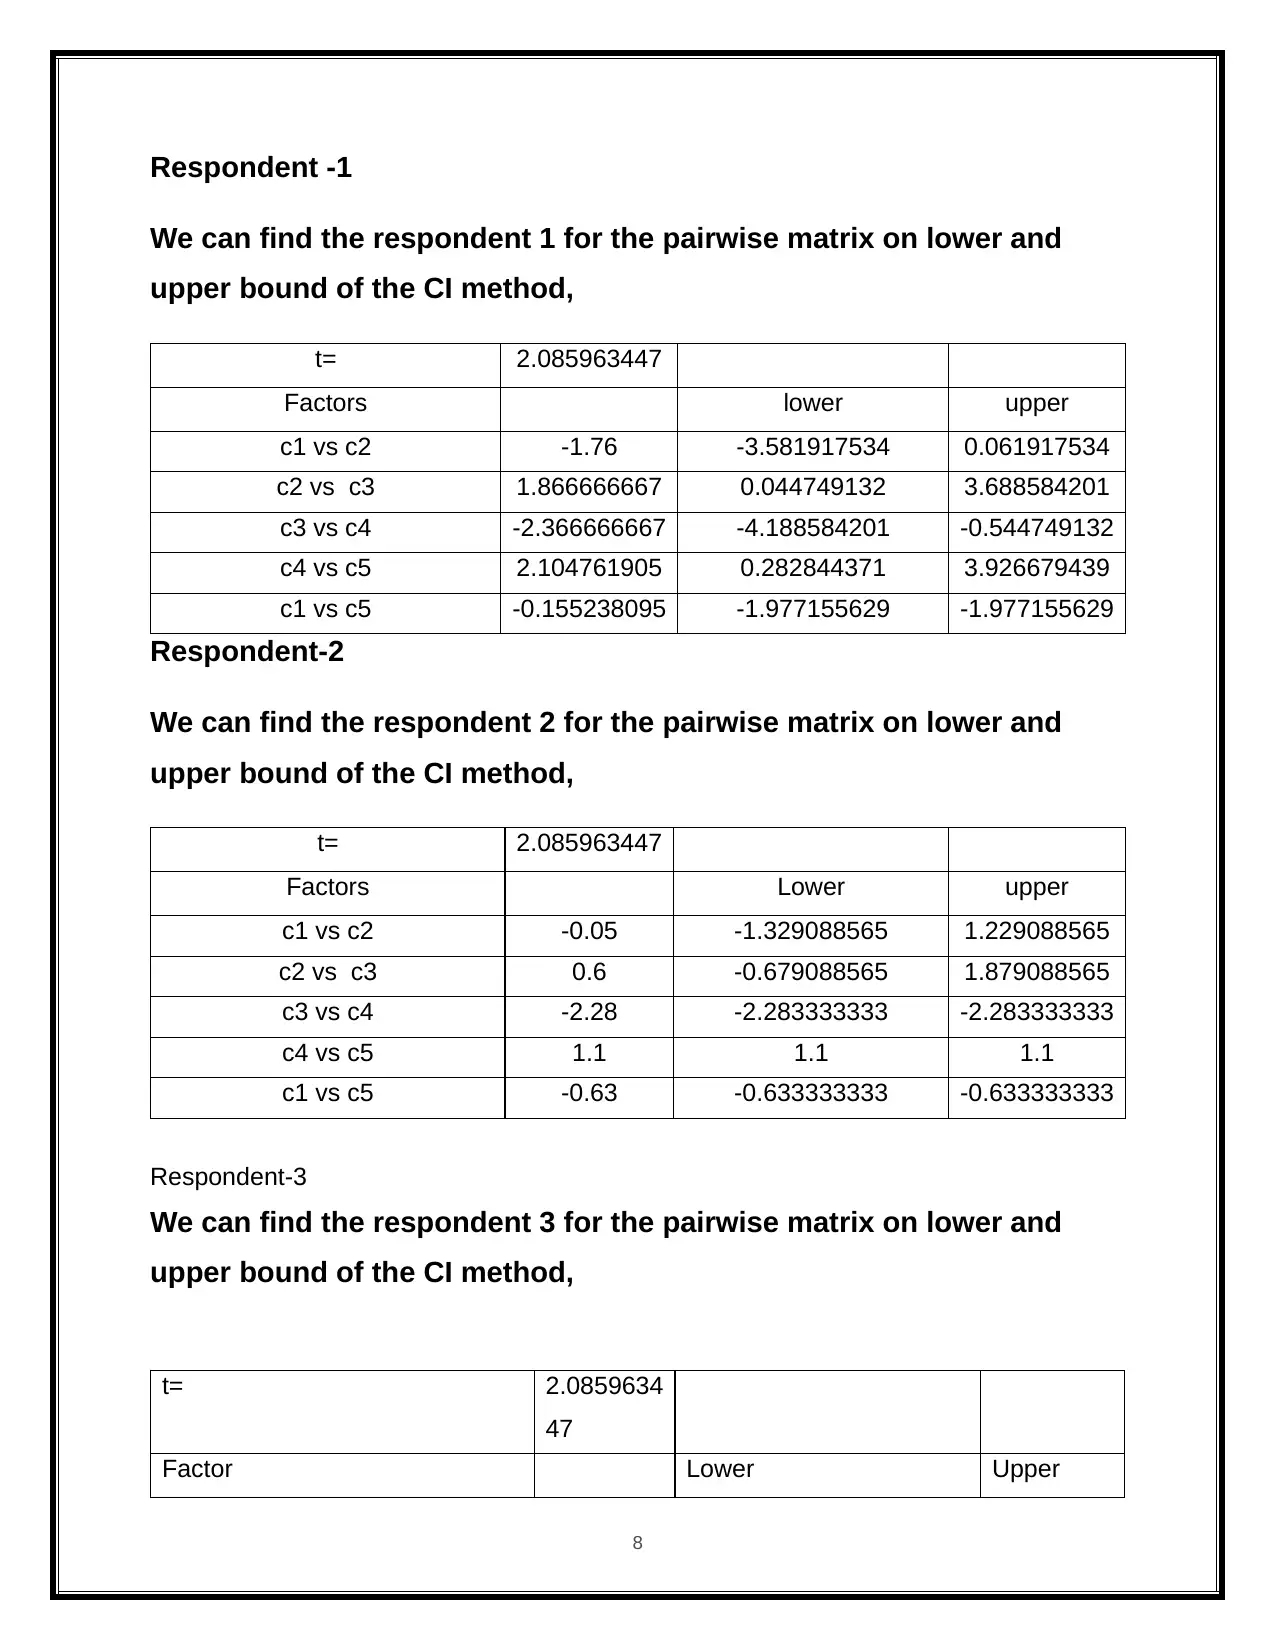
Respondent -1
We can find the respondent 1 for the pairwise matrix on lower and
upper bound of the CI method,
t= 2.085963447
Factors lower upper
c1 vs c2 -1.76 -3.581917534 0.061917534
c2 vs c3 1.866666667 0.044749132 3.688584201
c3 vs c4 -2.366666667 -4.188584201 -0.544749132
c4 vs c5 2.104761905 0.282844371 3.926679439
c1 vs c5 -0.155238095 -1.977155629 -1.977155629
Respondent-2
We can find the respondent 2 for the pairwise matrix on lower and
upper bound of the CI method,
t= 2.085963447
Factors Lower upper
c1 vs c2 -0.05 -1.329088565 1.229088565
c2 vs c3 0.6 -0.679088565 1.879088565
c3 vs c4 -2.28 -2.283333333 -2.283333333
c4 vs c5 1.1 1.1 1.1
c1 vs c5 -0.63 -0.633333333 -0.633333333
Respondent-3
We can find the respondent 3 for the pairwise matrix on lower and
upper bound of the CI method,
t= 2.0859634
47
Factor Lower Upper
8
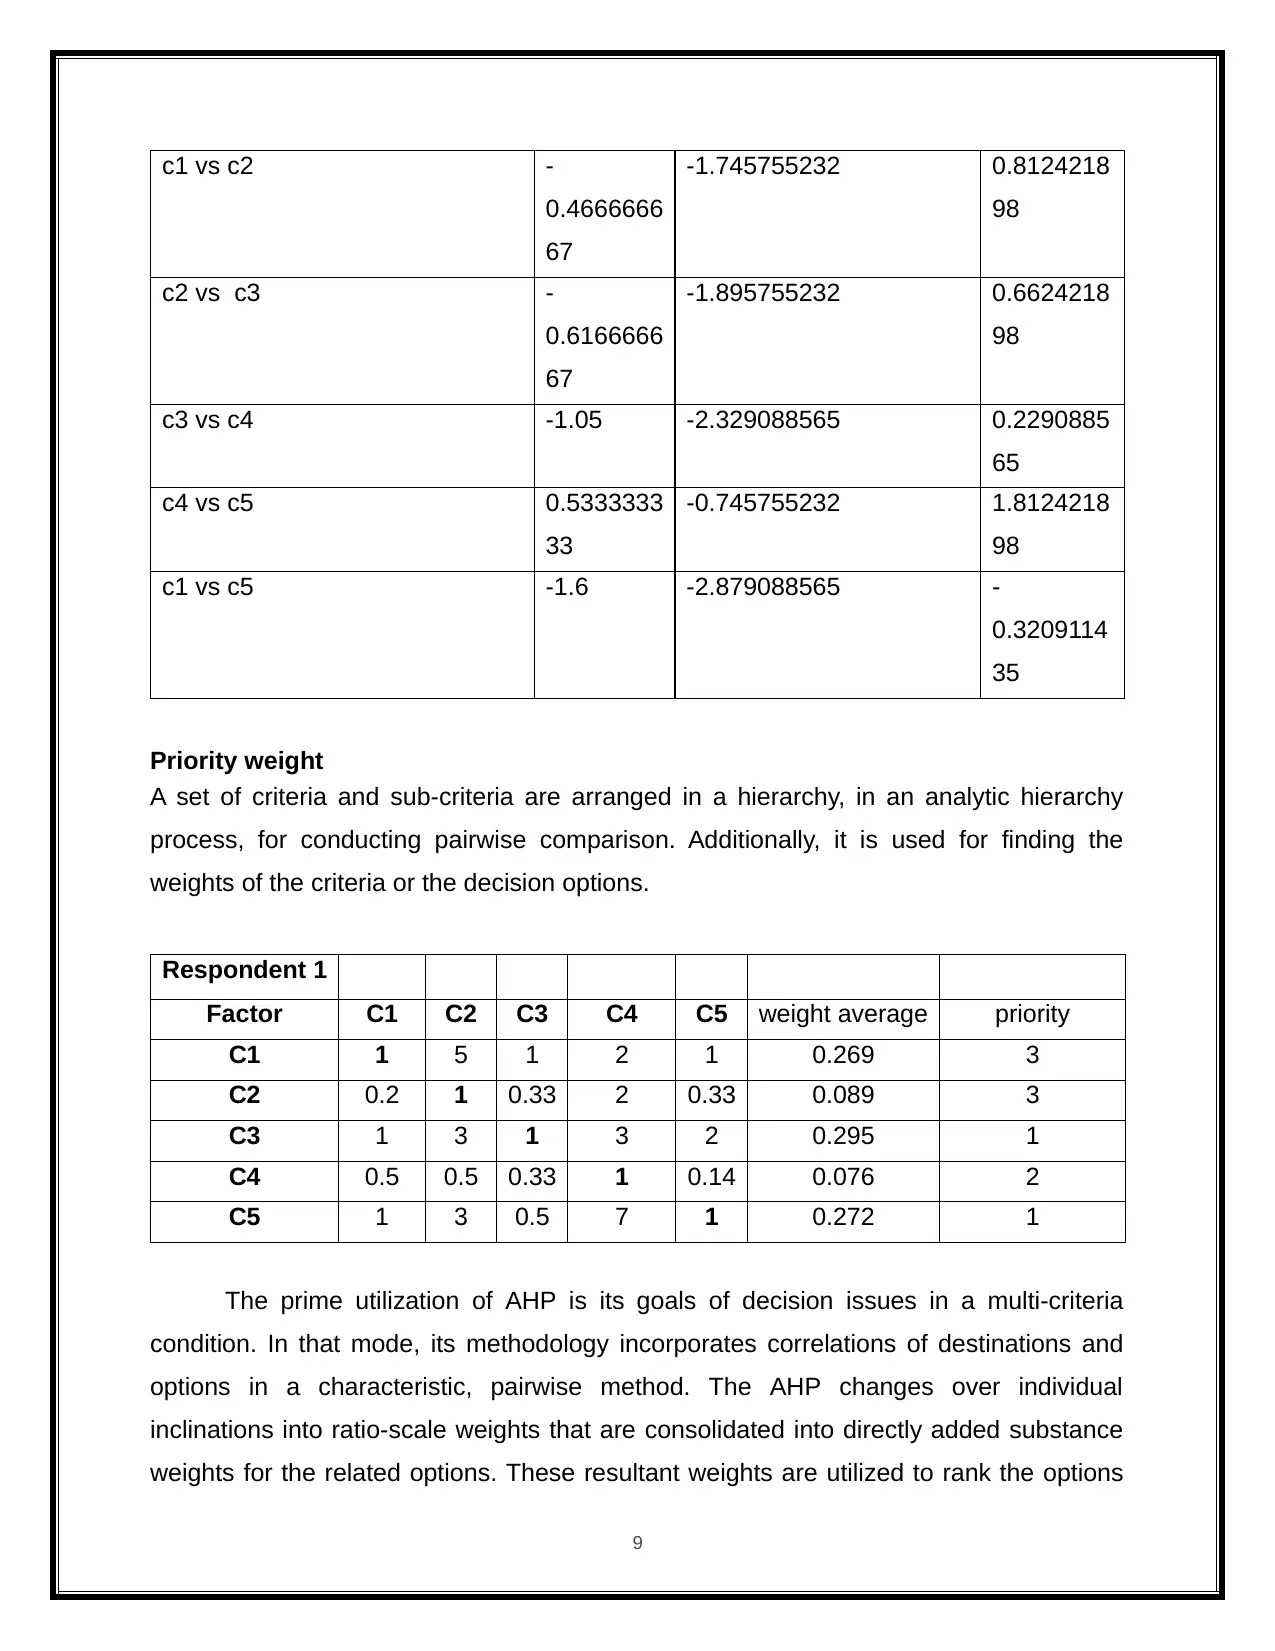
c1 vs c2 -
0.4666666
67
-1.745755232 0.8124218
98
c2 vs c3 -
0.6166666
67
-1.895755232 0.6624218
98
c3 vs c4 -1.05 -2.329088565 0.2290885
65
c4 vs c5 0.5333333
33
-0.745755232 1.8124218
98
c1 vs c5 -1.6 -2.879088565 -
0.3209114
35
Priority weight
A set of criteria and sub-criteria are arranged in a hierarchy, in an analytic hierarchy
process, for conducting pairwise comparison. Additionally, it is used for finding the
weights of the criteria or the decision options.
Respondent 1
Factor C1 C2 C3 C4 C5 weight average priority
C1 1 5 1 2 1 0.269 3
C2 0.2 1 0.33 2 0.33 0.089 3
C3 1 3 1 3 2 0.295 1
C4 0.5 0.5 0.33 1 0.14 0.076 2
C5 1 3 0.5 7 1 0.272 1
The prime utilization of AHP is its goals of decision issues in a multi-criteria
condition. In that mode, its methodology incorporates correlations of destinations and
options in a characteristic, pairwise method. The AHP changes over individual
inclinations into ratio-scale weights that are consolidated into directly added substance
weights for the related options. These resultant weights are utilized to rank the options
9
⊘ This is a preview!⊘
Do you want full access?
Subscribe today to unlock all pages.
Trusted by 1+ million students worldwide
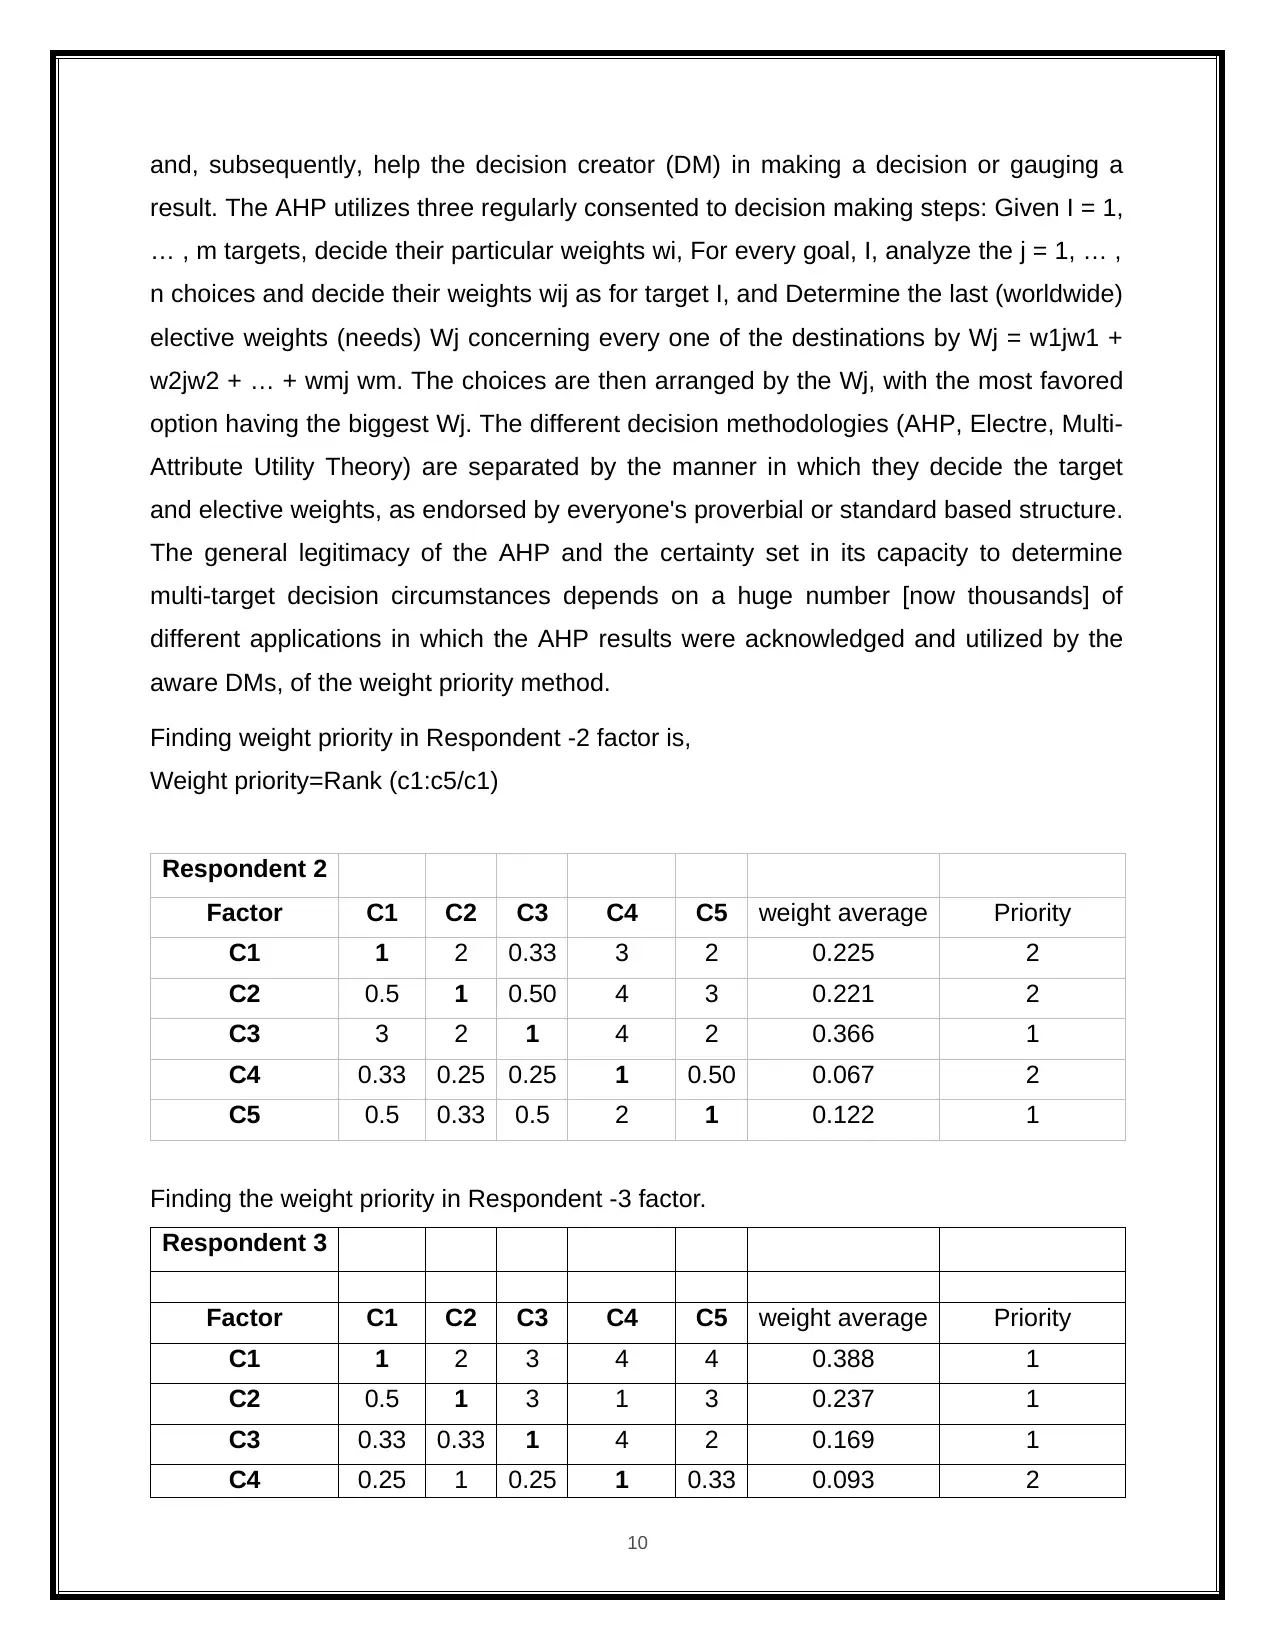
and, subsequently, help the decision creator (DM) in making a decision or gauging a
result. The AHP utilizes three regularly consented to decision making steps: Given I = 1,
… , m targets, decide their particular weights wi, For every goal, I, analyze the j = 1, … ,
n choices and decide their weights wij as for target I, and Determine the last (worldwide)
elective weights (needs) Wj concerning every one of the destinations by Wj = w1jw1 +
w2jw2 + … + wmj wm. The choices are then arranged by the Wj, with the most favored
option having the biggest Wj. The different decision methodologies (AHP, Electre, Multi-
Attribute Utility Theory) are separated by the manner in which they decide the target
and elective weights, as endorsed by everyone's proverbial or standard based structure.
The general legitimacy of the AHP and the certainty set in its capacity to determine
multi-target decision circumstances depends on a huge number [now thousands] of
different applications in which the AHP results were acknowledged and utilized by the
aware DMs, of the weight priority method.
Finding weight priority in Respondent -2 factor is,
Weight priority=Rank (c1:c5/c1)
Respondent 2
Factor C1 C2 C3 C4 C5 weight average Priority
C1 1 2 0.33 3 2 0.225 2
C2 0.5 1 0.50 4 3 0.221 2
C3 3 2 1 4 2 0.366 1
C4 0.33 0.25 0.25 1 0.50 0.067 2
C5 0.5 0.33 0.5 2 1 0.122 1
Finding the weight priority in Respondent -3 factor.
Respondent 3
Factor C1 C2 C3 C4 C5 weight average Priority
C1 1 2 3 4 4 0.388 1
C2 0.5 1 3 1 3 0.237 1
C3 0.33 0.33 1 4 2 0.169 1
C4 0.25 1 0.25 1 0.33 0.093 2
10
Paraphrase This Document
Need a fresh take? Get an instant paraphrase of this document with our AI Paraphraser
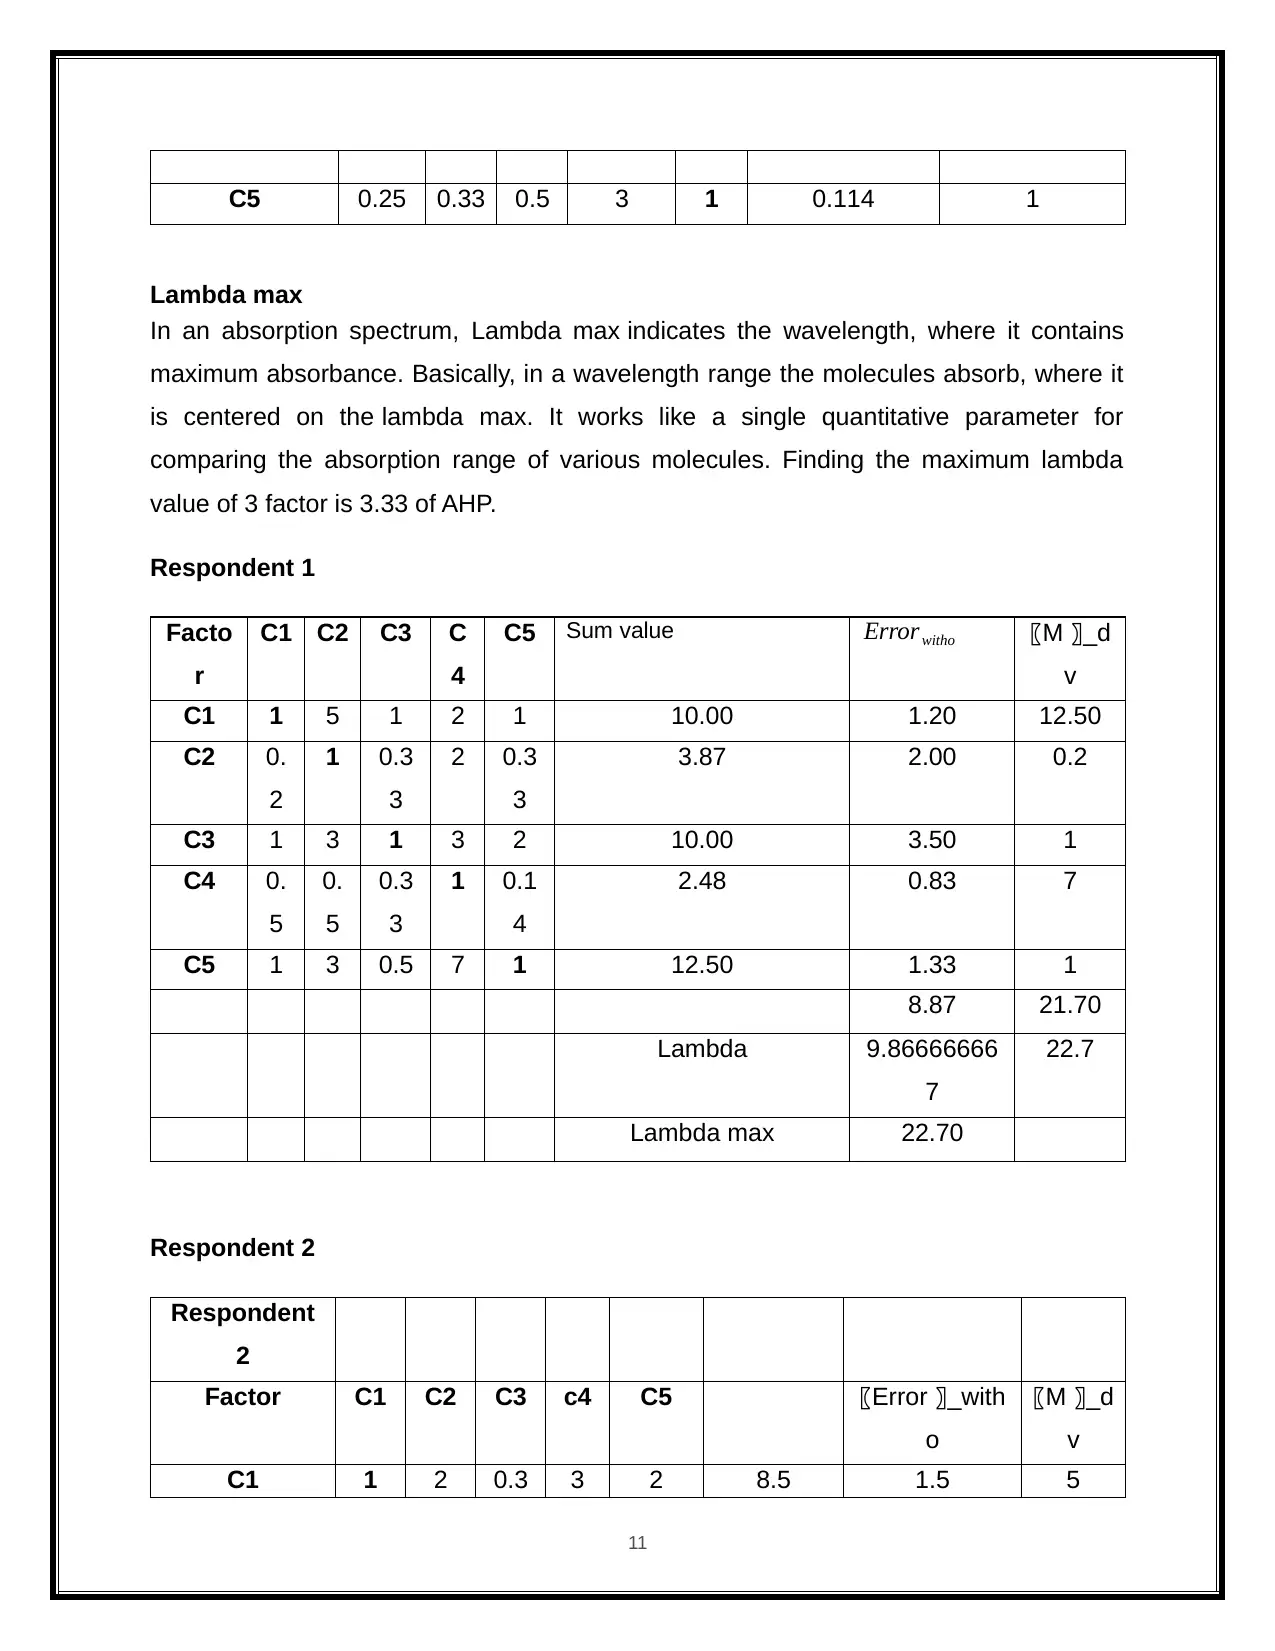
C5 0.25 0.33 0.5 3 1 0.114 1
Lambda max
In an absorption spectrum, Lambda max indicates the wavelength, where it contains
maximum absorbance. Basically, in a wavelength range the molecules absorb, where it
is centered on the lambda max. It works like a single quantitative parameter for
comparing the absorption range of various molecules. Finding the maximum lambda
value of 3 factor is 3.33 of AHP.
Respondent 1
Facto
r
C1 C2 C3 C
4
C5 Sum value 〖M 〗_d
v
C1 1 5 1 2 1 10.00 1.20 12.50
C2 0.
2
1 0.3
3
2 0.3
3
3.87 2.00 0.2
C3 1 3 1 3 2 10.00 3.50 1
C4 0.
5
0.
5
0.3
3
1 0.1
4
2.48 0.83 7
C5 1 3 0.5 7 1 12.50 1.33 1
8.87 21.70
Lambda 9.86666666
7
22.7
Lambda max 22.70
Respondent 2
Respondent
2
Factor C1 C2 C3 c4 C5 〖Error 〗_with
o
〖M 〗_d
v
C1 1 2 0.3 3 2 8.5 1.5 5
11
Errorwitho
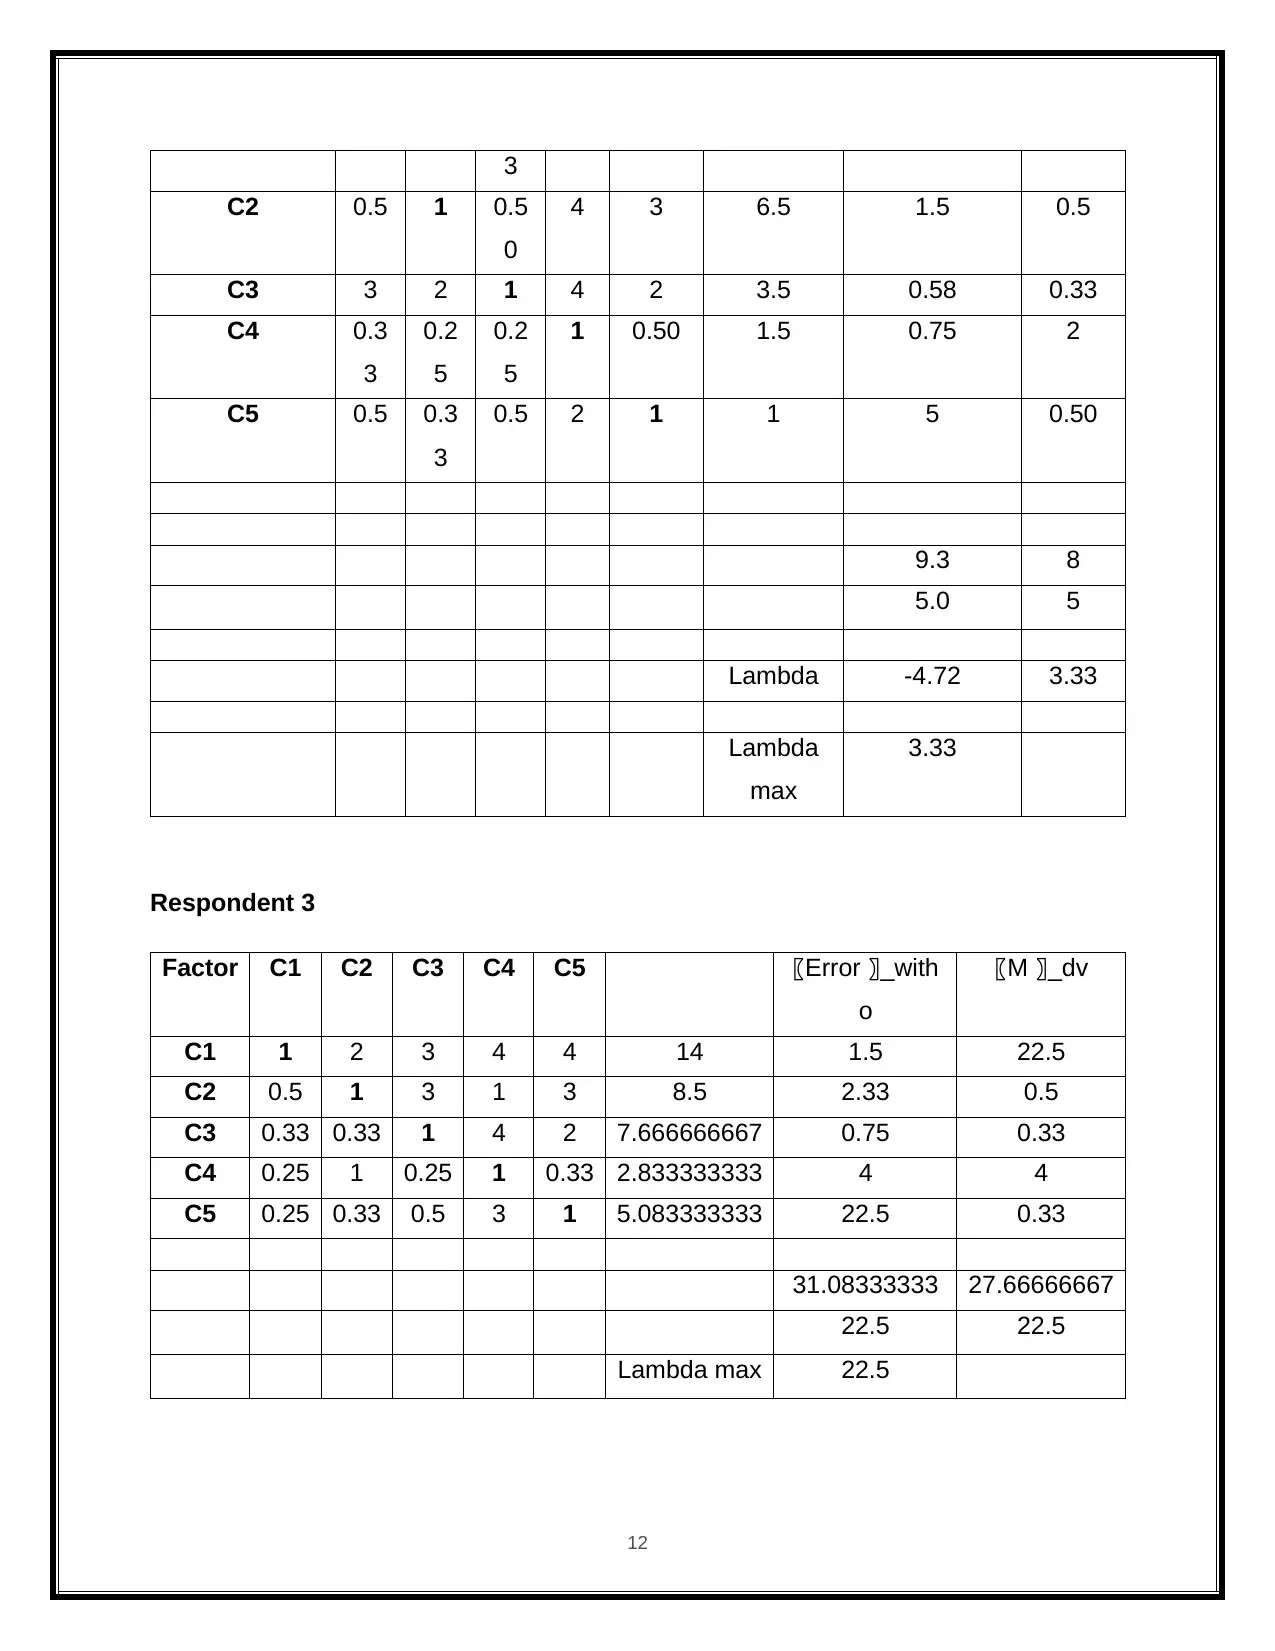
3
C2 0.5 1 0.5
0
4 3 6.5 1.5 0.5
C3 3 2 1 4 2 3.5 0.58 0.33
C4 0.3
3
0.2
5
0.2
5
1 0.50 1.5 0.75 2
C5 0.5 0.3
3
0.5 2 1 1 5 0.50
9.3 8
5.0 5
Lambda -4.72 3.33
Lambda
max
3.33
Respondent 3
Factor C1 C2 C3 C4 C5 〖Error 〗_with
o
〖M 〗_dv
C1 1 2 3 4 4 14 1.5 22.5
C2 0.5 1 3 1 3 8.5 2.33 0.5
C3 0.33 0.33 1 4 2 7.666666667 0.75 0.33
C4 0.25 1 0.25 1 0.33 2.833333333 4 4
C5 0.25 0.33 0.5 3 1 5.083333333 22.5 0.33
31.08333333 27.66666667
22.5 22.5
Lambda max 22.5
12
⊘ This is a preview!⊘
Do you want full access?
Subscribe today to unlock all pages.
Trusted by 1+ million students worldwide
1 out of 41
Related Documents


Your All-in-One AI-Powered Toolkit for Academic Success.
+13062052269
info@desklib.com
Available 24*7 on WhatsApp / Email
![[object Object]](/_next/static/media/star-bottom.7253800d.svg)
Unlock your academic potential
Copyright © 2020–2026 A2Z Services. All Rights Reserved. Developed and managed by ZUCOL.