Supply and Demand Analysis and Comparison of Economic Theories
VerifiedAdded on 2023/01/04
|15
|2878
|46
Report
AI Summary
This report delves into the core economic principles of supply and demand, examining the law of demand, the movement along the demand curve, and factors that shift the demand curve. It also explores the law of supply and its mechanics, including movements along the supply curve and factors influencing supply shifts. The report uses diagrams to illustrate these concepts, primarily in the context of the oil industry. Furthermore, it provides a comparative analysis of economic theories from the 20th and 21st centuries, highlighting the evolution of economic thought, with a focus on inequality and the application of these theories in contemporary business practices. The report concludes by comparing 20th and 21st century economic theories, and GDP, offering insights into modern economic analysis.
SUPPLY AND DEMAND
Paraphrase This Document
Need a fresh take? Get an instant paraphrase of this document with our AI Paraphraser
Table of Contents
Introduction......................................................................................................................................3
1.1 THE BRIEF OF THE LAW OF DEMAND AND THE MOVEMENT ALONG THE
DEMAND CURVE AND CHANGE IN DEMAND CURVE AND EXPLAIN THIS WITH
THE HELP OF THE DIAGRAM....................................................................................................4
EXPLAIN BIRIEFLY THE LAW OF SUPPLY AND THE MOVEMENT ALONG THE SAME
SUPPLYCURVE AND CHANGES IN SUPPLY CURVE WITH THE FACTORS AND WITH
THE DIAGRAMS ..........................................................................................................................8
Task 2.............................................................................................................................................12
20th century economics theories and 21st century economic theories......................................12
Conclusion.....................................................................................................................................15
References......................................................................................................................................16
Introduction
Economics is a concept that governs the creation, circulation and use of elements of products and
initiatives. This idea can be divided into two general classifications; macroeconomics and
microeconomics. Consider the behavior of the economy as a whole (Spencer, 1990).
Contemporary business study is characterized by an update of business methods in the modern
world. It involves adopting the latest strategies to increase the company's profits (Spencer, 1990).
This assessment is related to the clarification of the law of participation and pardon in the context
of the oil industry. Task 2, reflects the comparison between 20th and 21st centuries emerging
theories and models. Additional to this contemporary economics concept has also been discussed
with those of the 20th century.
In this assessment, the oil industry was taken as a reference for understanding the different
notion of interest and the law of grace.
⊘ This is a preview!⊘
Do you want full access?
Subscribe today to unlock all pages.
Trusted by 1+ million students worldwide
1.1 THE BRIEF OF THE LAW OF DEMAND AND THE MOVEMENT ALONG
THE DEMAND CURVE AND CHANGE IN DEMAND CURVE AND EXPLAIN
THIS WITH THE HELP OF THE DIAGRAM
Law of Demand
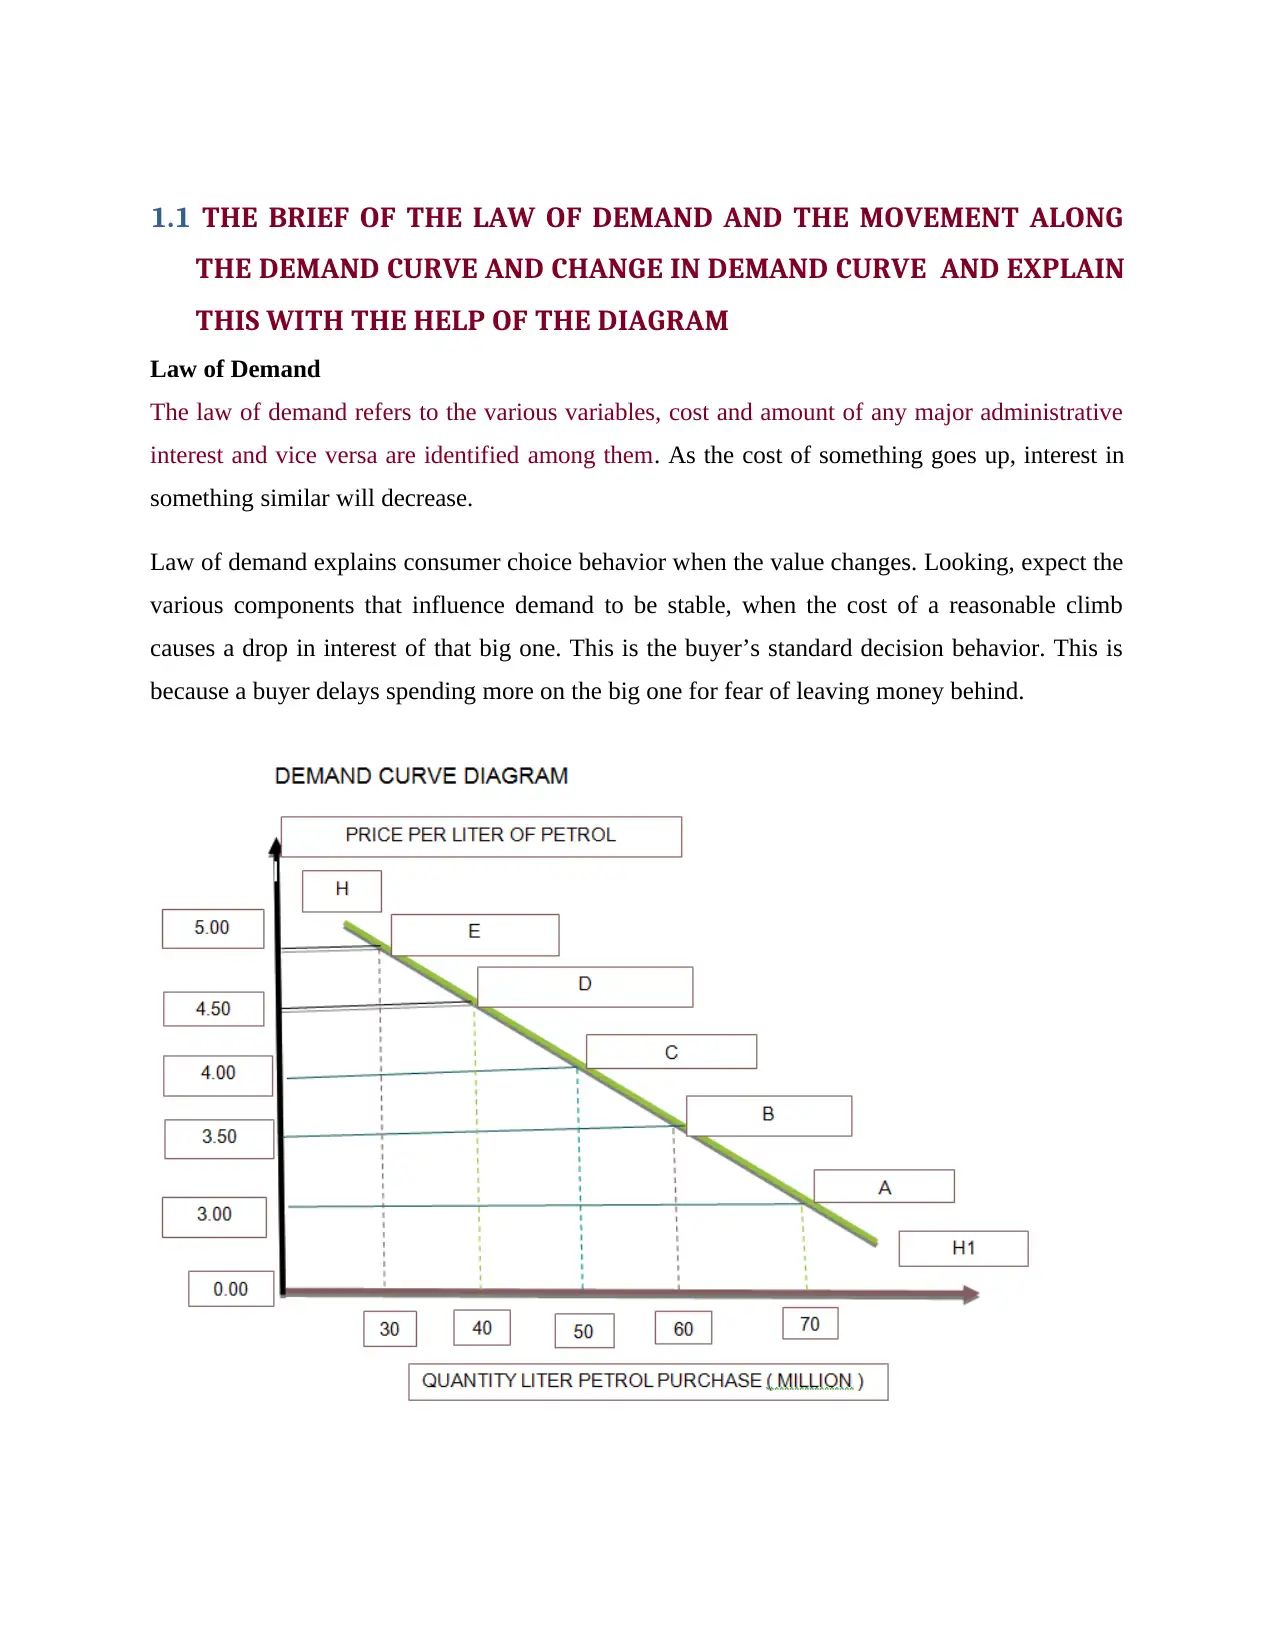
The law of demand refers to the various variables, cost and amount of any major administrative
interest and vice versa are identified among them. As the cost of something goes up, interest in
something similar will decrease.
Law of demand explains consumer choice behavior when the value changes. Looking, expect the
various components that influence demand to be stable, when the cost of a reasonable climb
causes a drop in interest of that big one. This is the buyer’s standard decision behavior. This is
because a buyer delays spending more on the big one for fear of leaving money behind.
THE DEMAND CURVE AND CHANGE IN DEMAND CURVE AND EXPLAIN
THIS WITH THE HELP OF THE DIAGRAM
Law of Demand
The law of demand refers to the various variables, cost and amount of any major administrative
interest and vice versa are identified among them. As the cost of something goes up, interest in
something similar will decrease.
Law of demand explains consumer choice behavior when the value changes. Looking, expect the
various components that influence demand to be stable, when the cost of a reasonable climb
causes a drop in interest of that big one. This is the buyer’s standard decision behavior. This is
because a buyer delays spending more on the big one for fear of leaving money behind.
Paraphrase This Document
Need a fresh take? Get an instant paraphrase of this document with our AI Paraphraser
Interpretation: In the above diagram; law of demand is applied on petroleum product; where
relationship between price and quantity demanded has been analyzed. The graph shows two
variables Price and Quantity; on the Y axis Price is given, while on X axis Quantity is given. The
diagram shows downward movement of demand curve; the relation shows that with the increase
in the price of Petrol, Quantity demanded decreases. For instance, at price £5 Quantity demand is
30 liters; on the other hand, at price £3 the Quantity demanded increases to 70 liters.
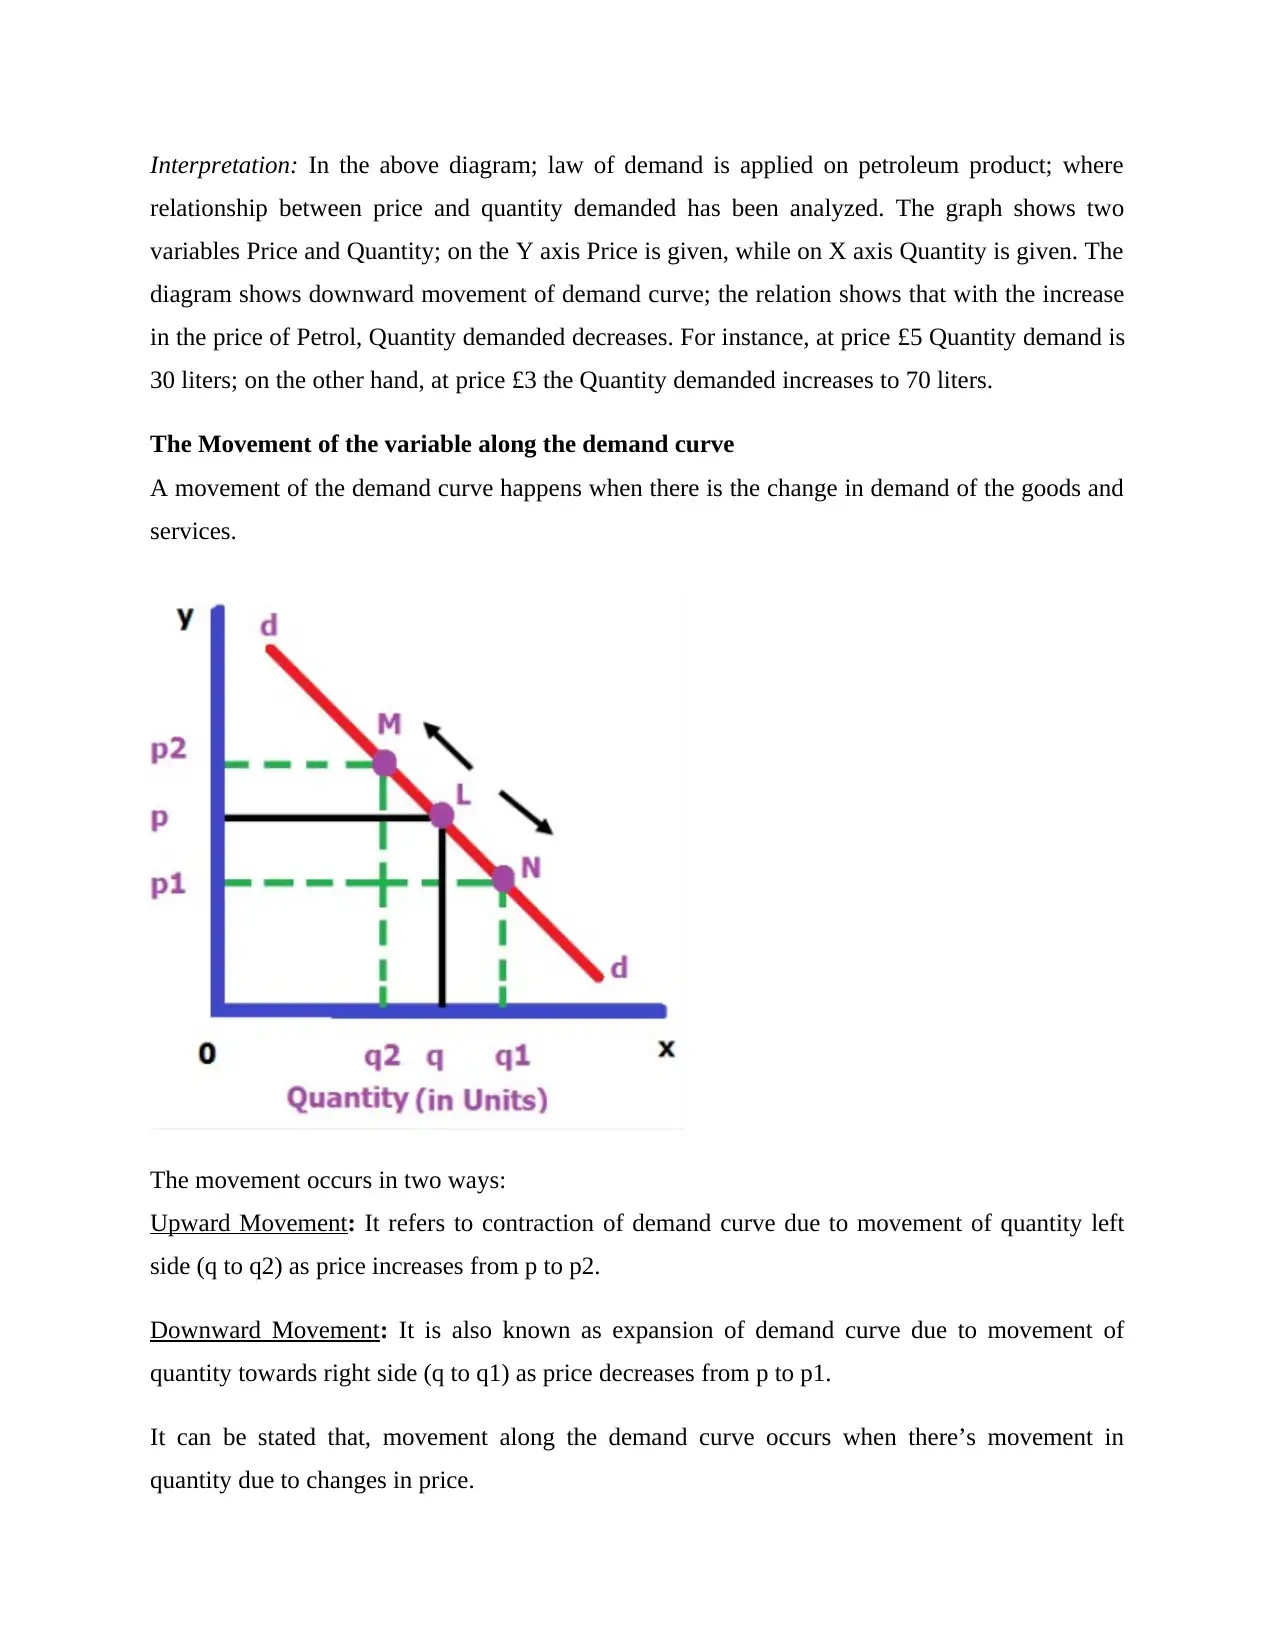
The Movement of the variable along the demand curve
A movement of the demand curve happens when there is the change in demand of the goods and
services.
The movement occurs in two ways:
Upward Movement: It refers to contraction of demand curve due to movement of quantity left
side (q to q2) as price increases from p to p2.
Downward Movement: It is also known as expansion of demand curve due to movement of
quantity towards right side (q to q1) as price decreases from p to p1.
It can be stated that, movement along the demand curve occurs when there’s movement in
quantity due to changes in price.
relationship between price and quantity demanded has been analyzed. The graph shows two
variables Price and Quantity; on the Y axis Price is given, while on X axis Quantity is given. The
diagram shows downward movement of demand curve; the relation shows that with the increase
in the price of Petrol, Quantity demanded decreases. For instance, at price £5 Quantity demand is
30 liters; on the other hand, at price £3 the Quantity demanded increases to 70 liters.
The Movement of the variable along the demand curve
A movement of the demand curve happens when there is the change in demand of the goods and
services.
The movement occurs in two ways:
Upward Movement: It refers to contraction of demand curve due to movement of quantity left
side (q to q2) as price increases from p to p2.
Downward Movement: It is also known as expansion of demand curve due to movement of
quantity towards right side (q to q1) as price decreases from p to p1.
It can be stated that, movement along the demand curve occurs when there’s movement in
quantity due to changes in price.
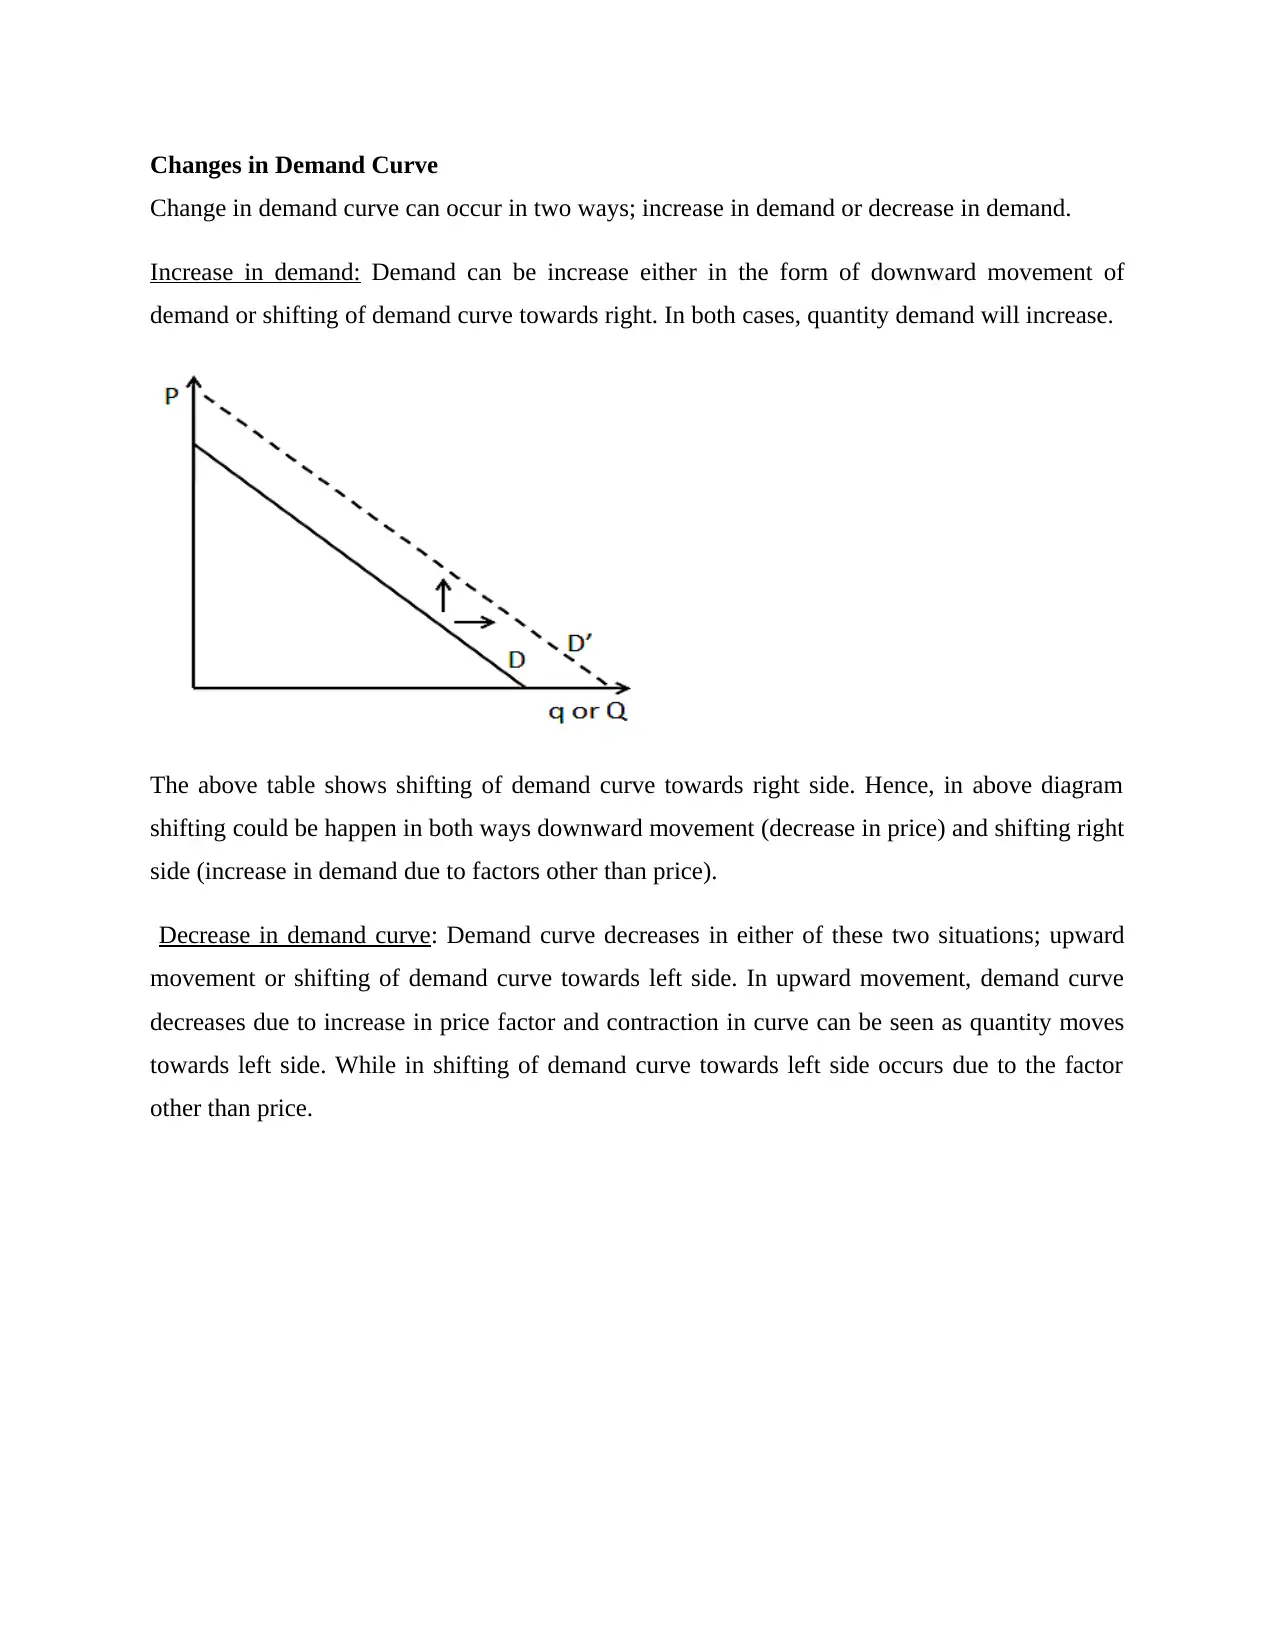
Changes in Demand Curve
Change in demand curve can occur in two ways; increase in demand or decrease in demand.
Increase in demand: Demand can be increase either in the form of downward movement of
demand or shifting of demand curve towards right. In both cases, quantity demand will increase.
The above table shows shifting of demand curve towards right side. Hence, in above diagram
shifting could be happen in both ways downward movement (decrease in price) and shifting right
side (increase in demand due to factors other than price).
Decrease in demand curve: Demand curve decreases in either of these two situations; upward
movement or shifting of demand curve towards left side. In upward movement, demand curve
decreases due to increase in price factor and contraction in curve can be seen as quantity moves
towards left side. While in shifting of demand curve towards left side occurs due to the factor
other than price.
⊘ This is a preview!⊘
Do you want full access?
Subscribe today to unlock all pages.
Trusted by 1+ million students worldwide
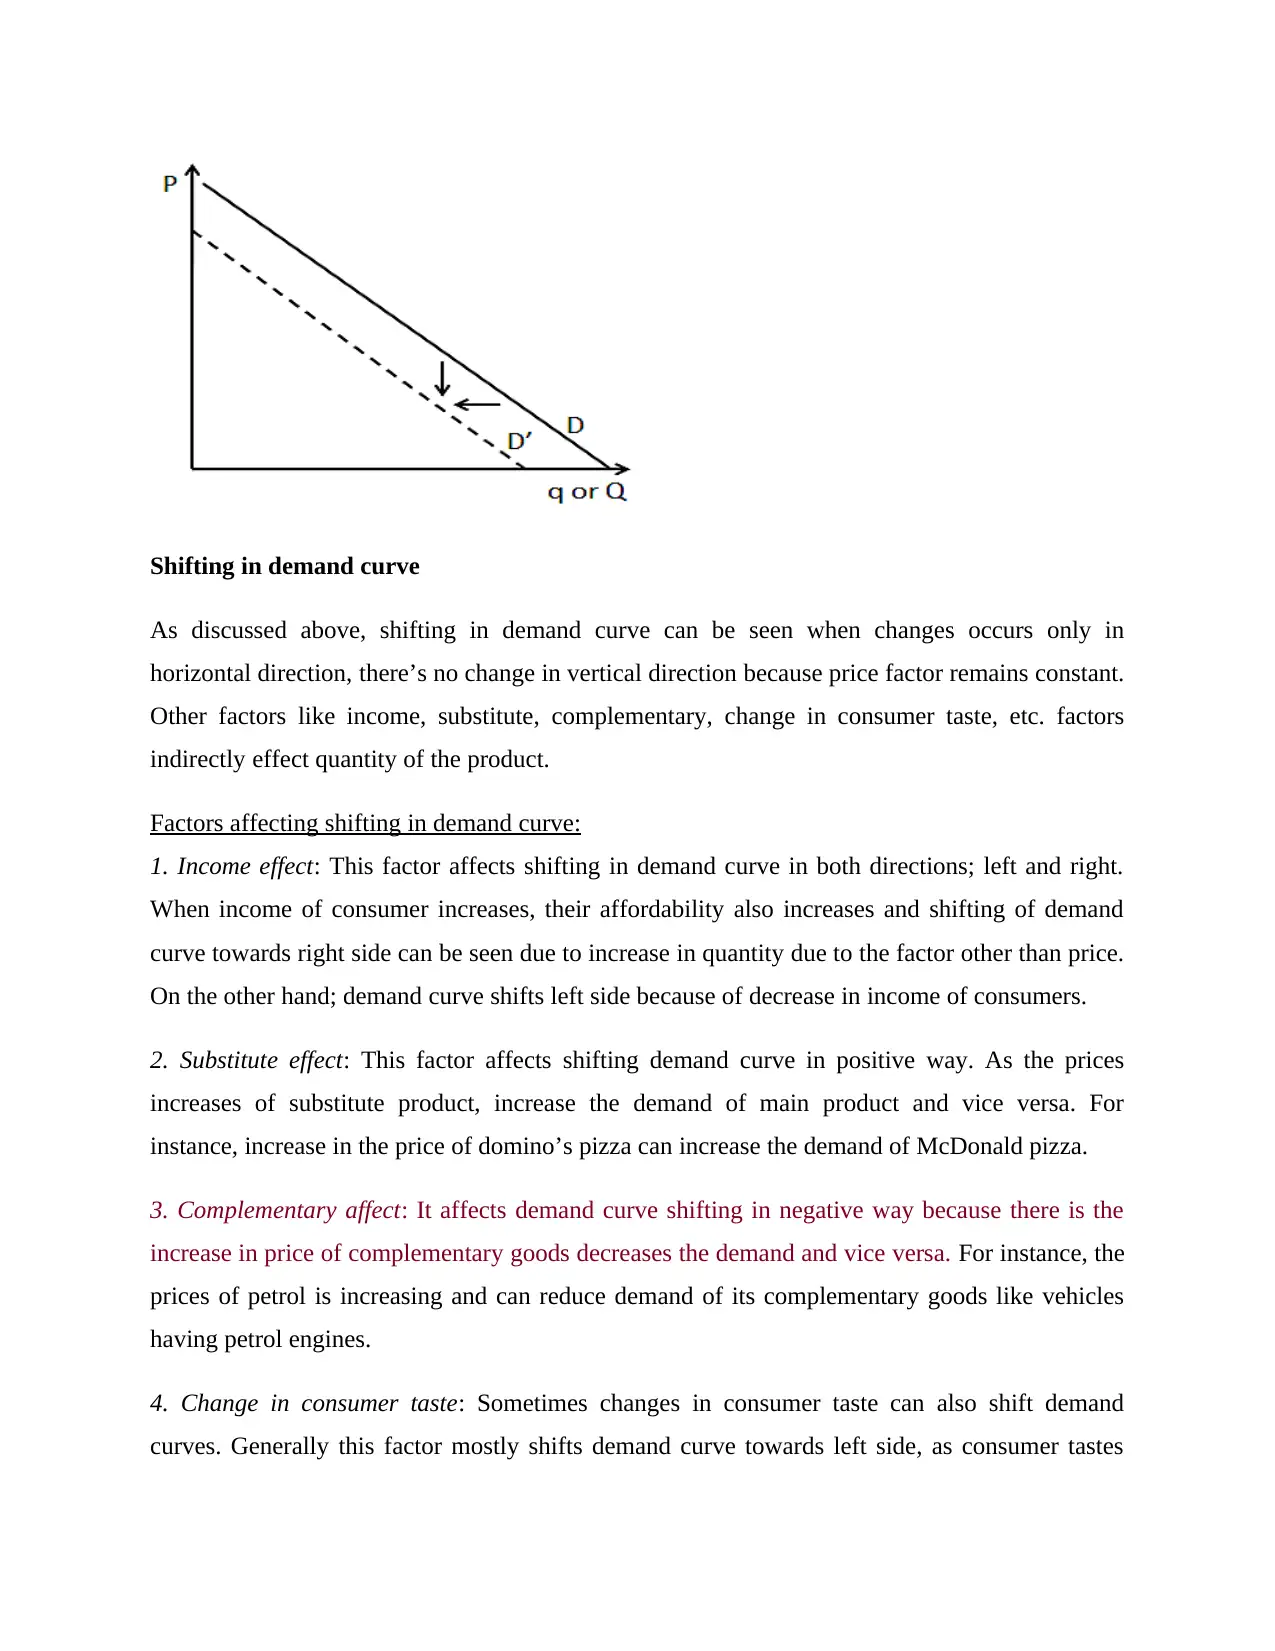
Shifting in demand curve
As discussed above, shifting in demand curve can be seen when changes occurs only in
horizontal direction, there’s no change in vertical direction because price factor remains constant.
Other factors like income, substitute, complementary, change in consumer taste, etc. factors
indirectly effect quantity of the product.
Factors affecting shifting in demand curve:
1. Income effect: This factor affects shifting in demand curve in both directions; left and right.
When income of consumer increases, their affordability also increases and shifting of demand
curve towards right side can be seen due to increase in quantity due to the factor other than price.
On the other hand; demand curve shifts left side because of decrease in income of consumers.
2. Substitute effect: This factor affects shifting demand curve in positive way. As the prices
increases of substitute product, increase the demand of main product and vice versa. For
instance, increase in the price of domino’s pizza can increase the demand of McDonald pizza.
3. Complementary affect: It affects demand curve shifting in negative way because there is the
increase in price of complementary goods decreases the demand and vice versa. For instance, the
prices of petrol is increasing and can reduce demand of its complementary goods like vehicles
having petrol engines.
4. Change in consumer taste: Sometimes changes in consumer taste can also shift demand
curves. Generally this factor mostly shifts demand curve towards left side, as consumer tastes
Paraphrase This Document
Need a fresh take? Get an instant paraphrase of this document with our AI Paraphraser
changes frequently and an upgrade requires for maintaining the demand of the product. For
instance demand of Apple’s Iphone, gazettes, clothes, cars, etc. changes within a year and
consumer requires upgraded version of that product.
EXPLAIN BIRIEFLY THE LAW OF SUPPLY AND THE MOVEMENT ALONG
THE SAME SUPPLYCURVE AND CHANGES IN SUPPLY CURVE WITH
THE FACTORS AND WITH THE DIAGRAMS
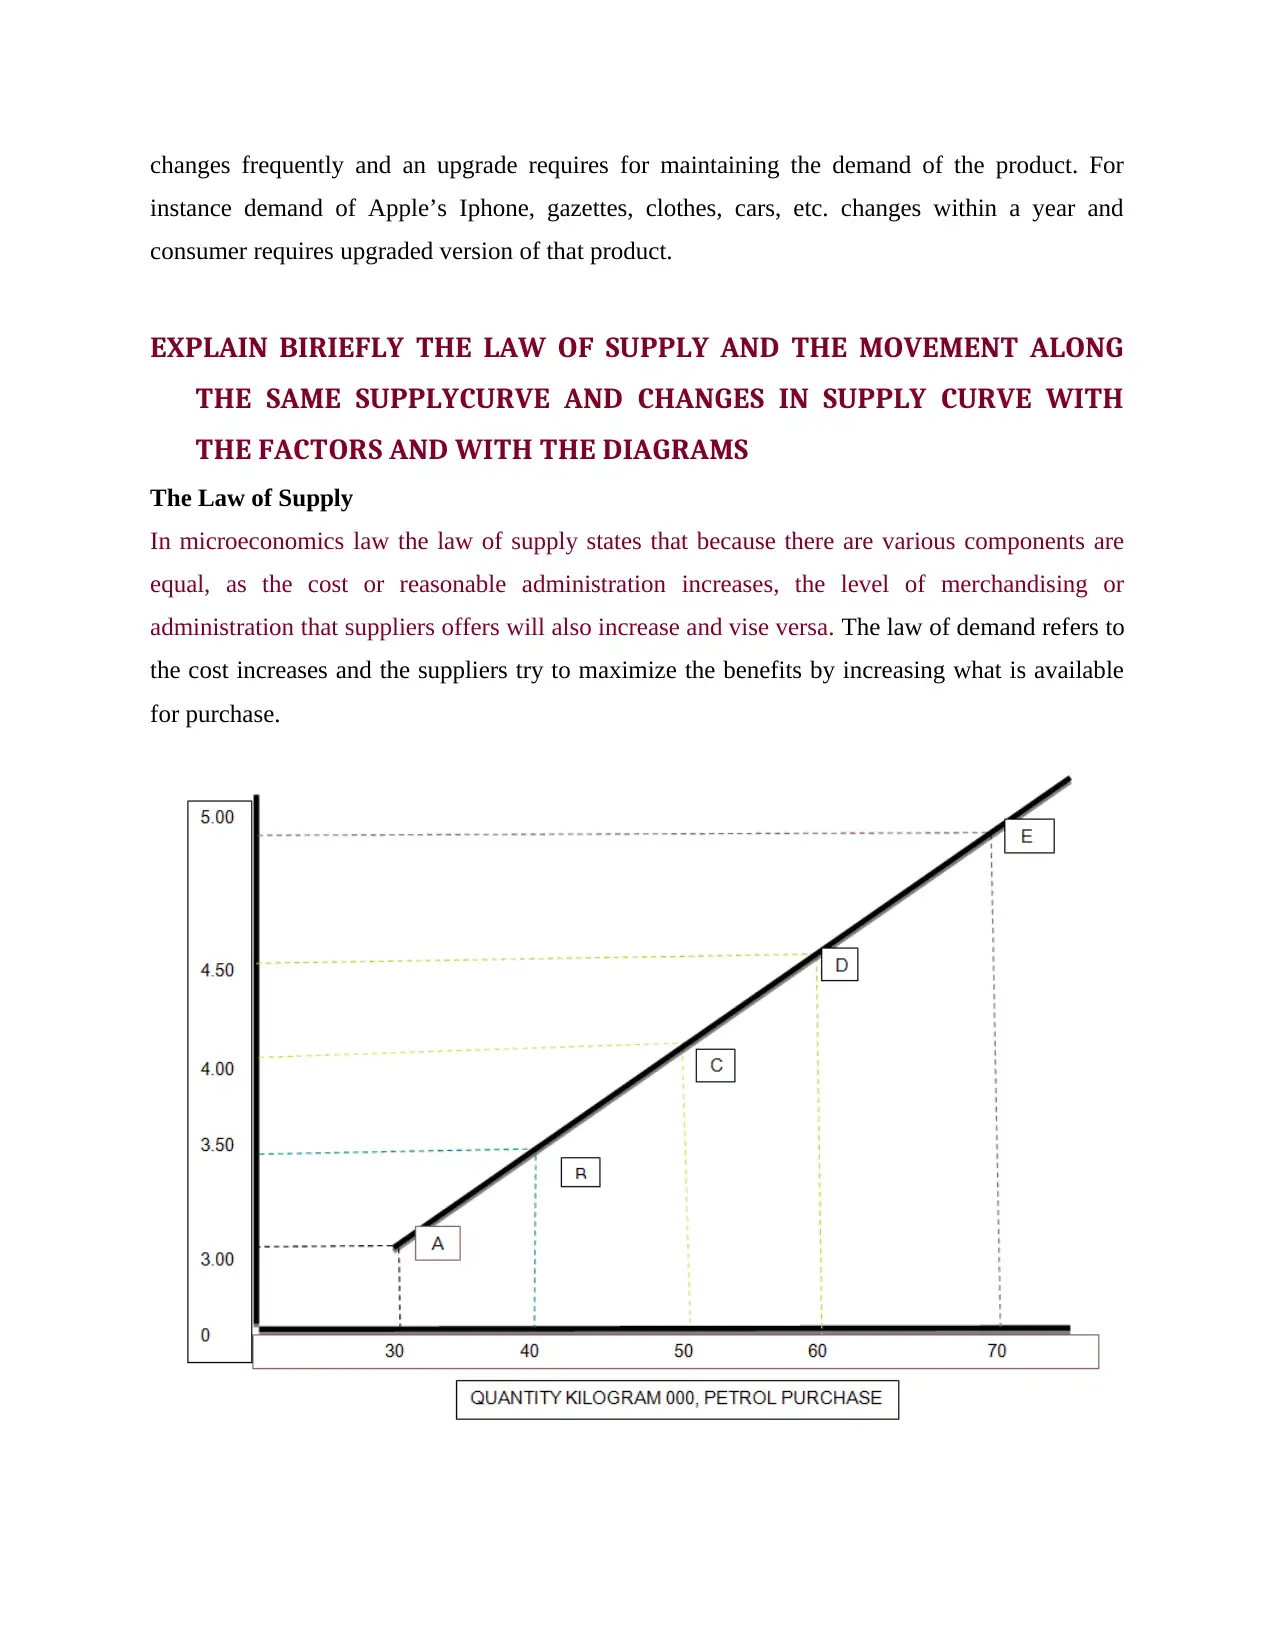
The Law of Supply
In microeconomics law the law of supply states that because there are various components are
equal, as the cost or reasonable administration increases, the level of merchandising or
administration that suppliers offers will also increase and vise versa. The law of demand refers to
the cost increases and the suppliers try to maximize the benefits by increasing what is available
for purchase.
instance demand of Apple’s Iphone, gazettes, clothes, cars, etc. changes within a year and
consumer requires upgraded version of that product.
EXPLAIN BIRIEFLY THE LAW OF SUPPLY AND THE MOVEMENT ALONG
THE SAME SUPPLYCURVE AND CHANGES IN SUPPLY CURVE WITH
THE FACTORS AND WITH THE DIAGRAMS
The Law of Supply
In microeconomics law the law of supply states that because there are various components are
equal, as the cost or reasonable administration increases, the level of merchandising or
administration that suppliers offers will also increase and vise versa. The law of demand refers to
the cost increases and the suppliers try to maximize the benefits by increasing what is available
for purchase.
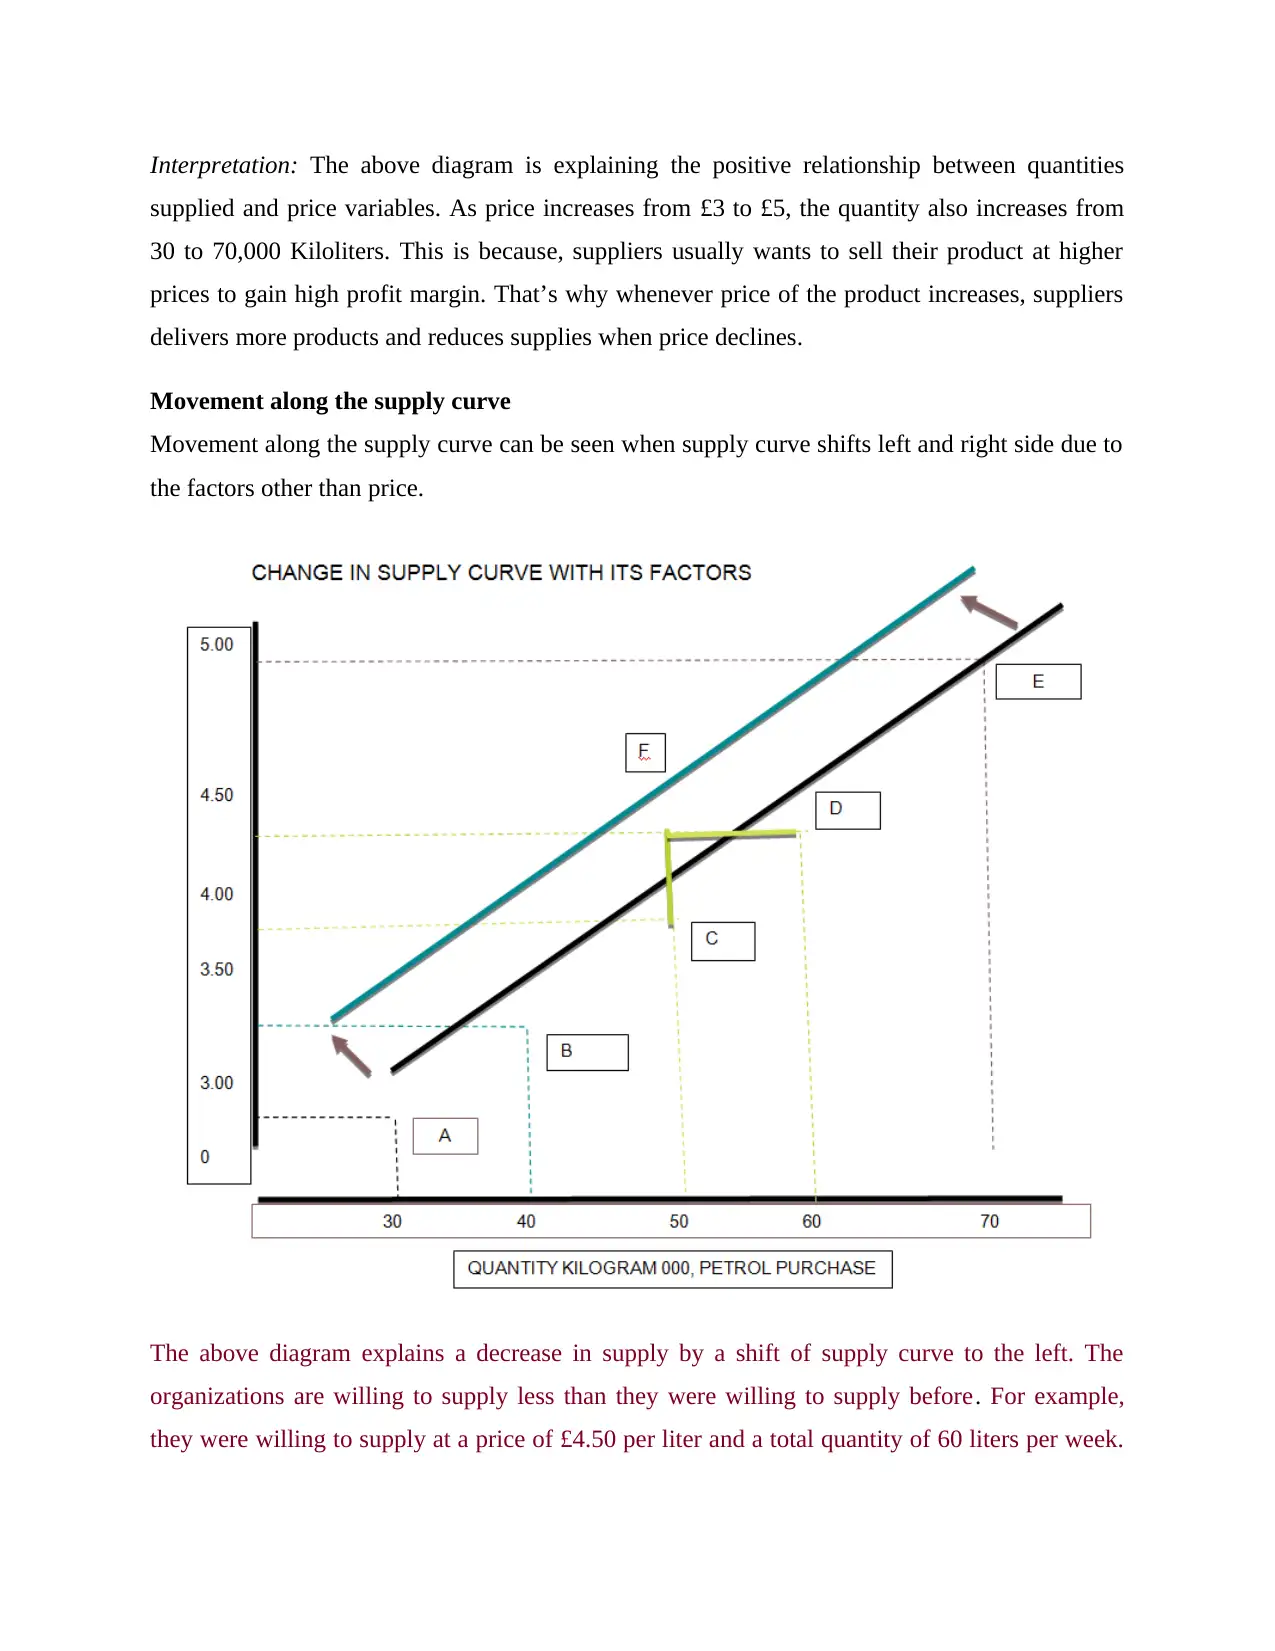
Interpretation: The above diagram is explaining the positive relationship between quantities
supplied and price variables. As price increases from £3 to £5, the quantity also increases from
30 to 70,000 Kiloliters. This is because, suppliers usually wants to sell their product at higher
prices to gain high profit margin. That’s why whenever price of the product increases, suppliers
delivers more products and reduces supplies when price declines.
Movement along the supply curve
Movement along the supply curve can be seen when supply curve shifts left and right side due to
the factors other than price.
The above diagram explains a decrease in supply by a shift of supply curve to the left. The
organizations are willing to supply less than they were willing to supply before. For example,
they were willing to supply at a price of £4.50 per liter and a total quantity of 60 liters per week.
⊘ This is a preview!⊘
Do you want full access?
Subscribe today to unlock all pages.
Trusted by 1+ million students worldwide
The is a decrease in supply and they are willing to sell at a price of £4.50 per liters and a total of
50 liters per week.
The law of supply and the factors affecting movement along the supply curve
1. Changes in raw material cost: Raw material is input factor of production; any change in this
input level effects supply of the product in the market. For instance, if the price of crude oil
increases with no changes in petrol price; than suppliers will reduce petrol supply in the market
because they are facing loss.
2. Changes in wage rate: As like above factor, wage rate also effects movement in supply curve;
because wages are associated with labor that is also a part of input for production. Any changes
in the price of input factors impact the cost of production. If wage rate increases with no changes
in price, than supplier will reduce supply because of less profit margin.
Paraphrase This Document
Need a fresh take? Get an instant paraphrase of this document with our AI Paraphraser
Task 2
20th century economics theories and 21st century economic theories
Comparing 20th and 21st century with modern inequality theory of economics:
Karl Max Theory: The Economic inequality refers to the process in which there is a differences
in money between people's social events, people's meetings or countries. Unbalanced features of
money from time to time include pay imbalance, abundance inequality or abundance opening.
Money experts usually improves the measurable systems for analyzing the disadvantages of
money wealth, pay, and consumption. There are issues of money irregularity related to the dress
ideas, correct results and reference letters. The irrational characteristics of money are a
combination of social demands, financial policies, certain times and systems. The organizations
refer to wage and abundance improvements over time and the changes in salaries and abundance
in the extended period. The mathematical tables to measure the performance of money. The
coefficient is the common document and there are two different strategies (Leshem, 2016).
Supportive Model: The modern business practices is the concept of managing to determine the
specific conditions of a person and the currency. In considering this study; classified countries
are vague, imaginative and ingenious. The parts taken for testing are unemployment rate, skill
level, per capita salary, future opportunities and human pollution. The 20th century is the basis of
the study was the per capita pay per country that is the normal distribution of money has
prevented the prospect of committing the inconsistency of the measures in keeping the country
high.
The Comparison which is based on GDP
The 20th to 21stt century and the monetary advancement of the country is viewed as dependent
on their development in the obligation to generally advance or GDP upheld by its different
segments, for instance, installment, capital spending, issuance/presentation and missions by the
public authority. Be that as it may, in the present mechanical practice; this thought has vanished.
Right now, a few nations are indicating improvement profitability with feasible turn of events.
For example, measures to reduce the changes inclusion are affecting, attempting to bring more
nurseries and the plants with the environment in the air. Recently shaped nations have started to
acknowledge the earth and the methods to fix the nations from arising debacles. For example,
loss of assets, natural changes and heaps of interstitial infection. unique. Up until now, cutting
edge control of appraisals is transforming in GDP measures by nations to separate the viability of
made nations.
There is a replacement of old theories which is based on the assumption related to the practical
integration and the technical theories
The 20th century and the market investigators has a few presumptions dependent on what and if
suppositions and results are that nothing has to do with the prior conditions that was there in the
2008 emergency. The organizations are leading 21st century monetary investigators have rolled
out numerous improvements, and yet in light of old basics, for example, old presumptions, they
have likewise not had a lot of an effect. Notwithstanding, the present business practice includes
various chronicled reactivation projects to look at the particular effect of the framework on
outcomes or yield.
Neo-traditional sociology expects that everybody specialists act judiciously in their own personal
responsibility. In differentiation, action in sociology accentuates unselfishness. this can be once
people act with a great deal of consideration and decency than would be the situation in the event
that they acted sanely. The are usually coupled to the idea of disparity in the humans and they do
not care for inconsistent .(Spencer, 1990)
There square measure a few mental component inclinations which will affect conduct. One is
that the Anchoring result once people trust intensely on an audacious bit of information to help
the North American country construct a decision. Another is that the openness heuristic any
place we will in general over-gauge the opportunity of one thing occurring because of a similar
occasion has either happened as of late or because of, we will in general feel enthusiastic a
couple of past comparative occasions. The hopefulness predisposition discover that people will
in general be too guaranteed concerning the final product of arranged activities and decisions and
in this way the deficiency inclination is the propensity to value one thing a ton of the idea of as
rare.(Spencer, 1990)
⊘ This is a preview!⊘
Do you want full access?
Subscribe today to unlock all pages.
Trusted by 1+ million students worldwide
1 out of 15
Related Documents


Your All-in-One AI-Powered Toolkit for Academic Success.
+13062052269
info@desklib.com
Available 24*7 on WhatsApp / Email
![[object Object]](/_next/static/media/star-bottom.7253800d.svg)
Unlock your academic potential
Copyright © 2020–2026 A2Z Services. All Rights Reserved. Developed and managed by ZUCOL.