Analysis of Supply and Demand: 20th and 21st Century Economics

Verified

Added on  2023/01/04

|16
|2893
|79
Report
AI Summary
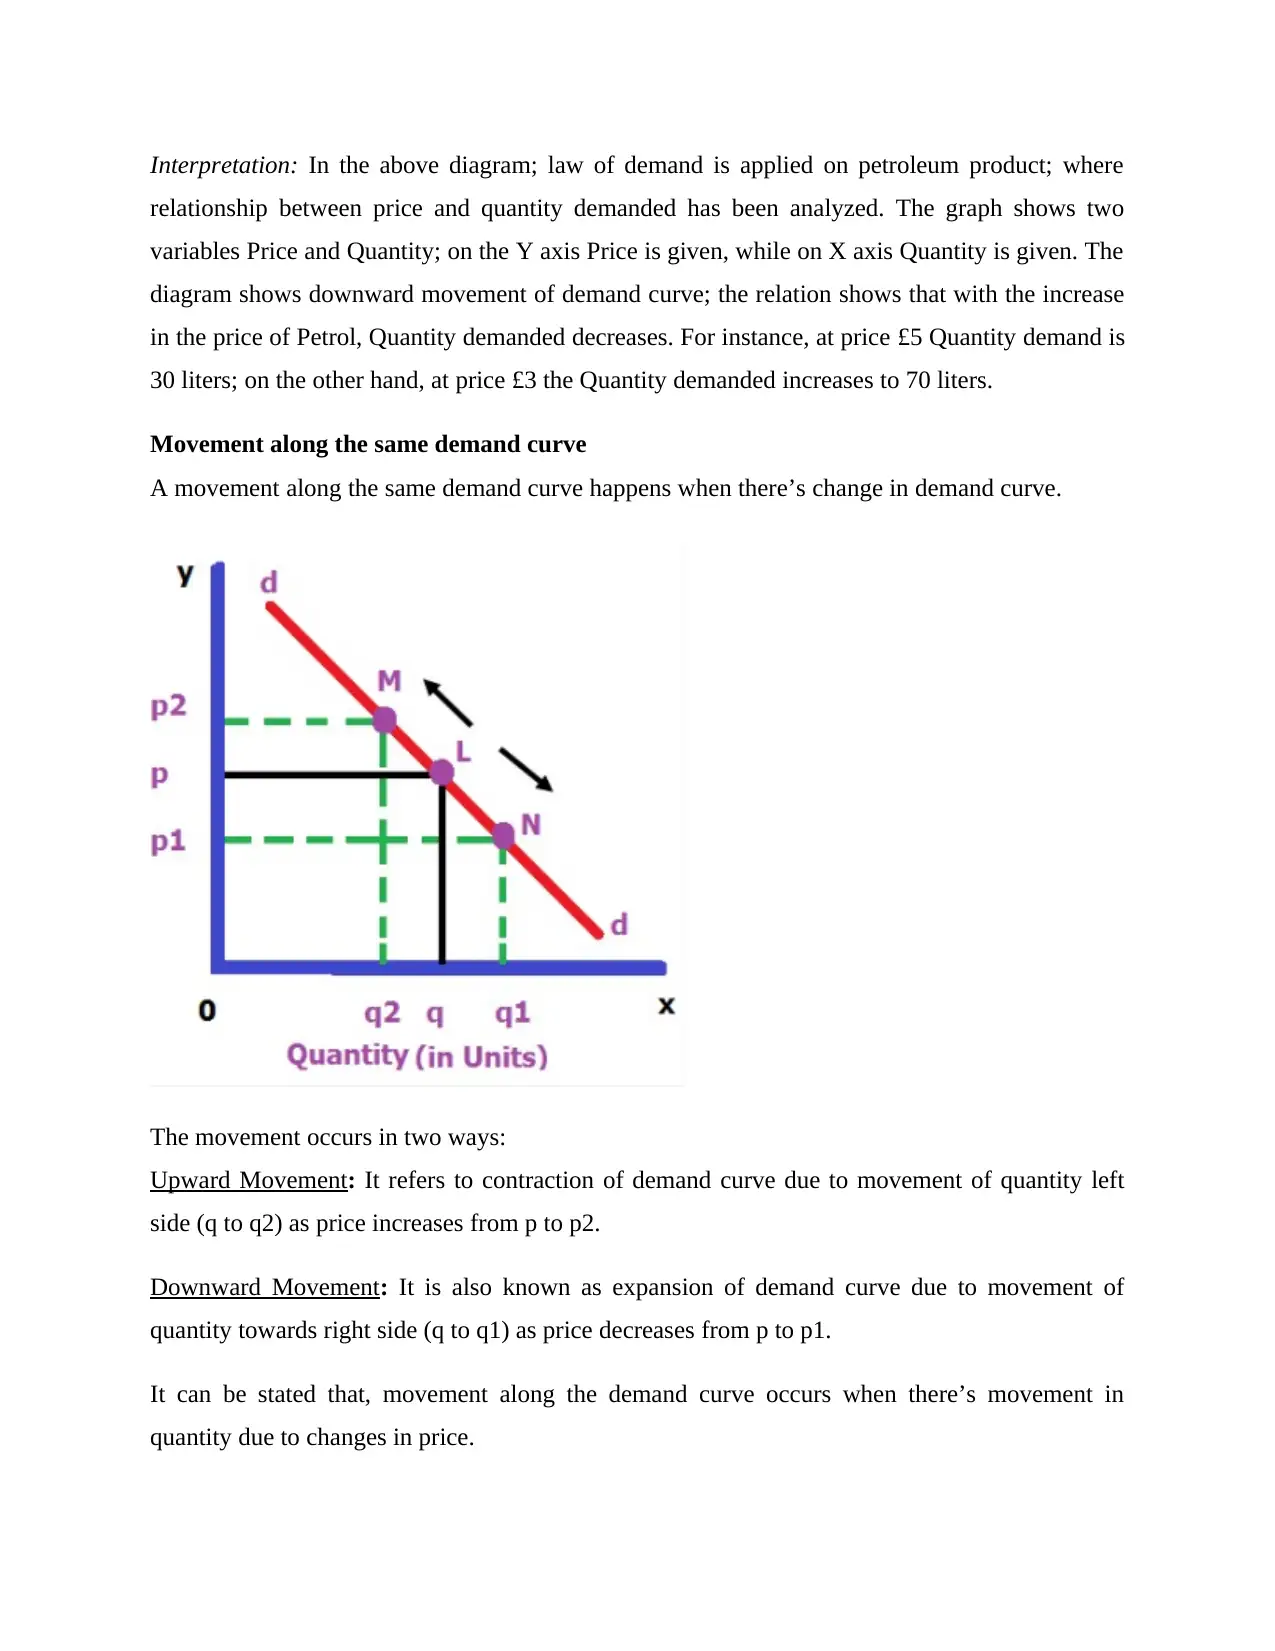
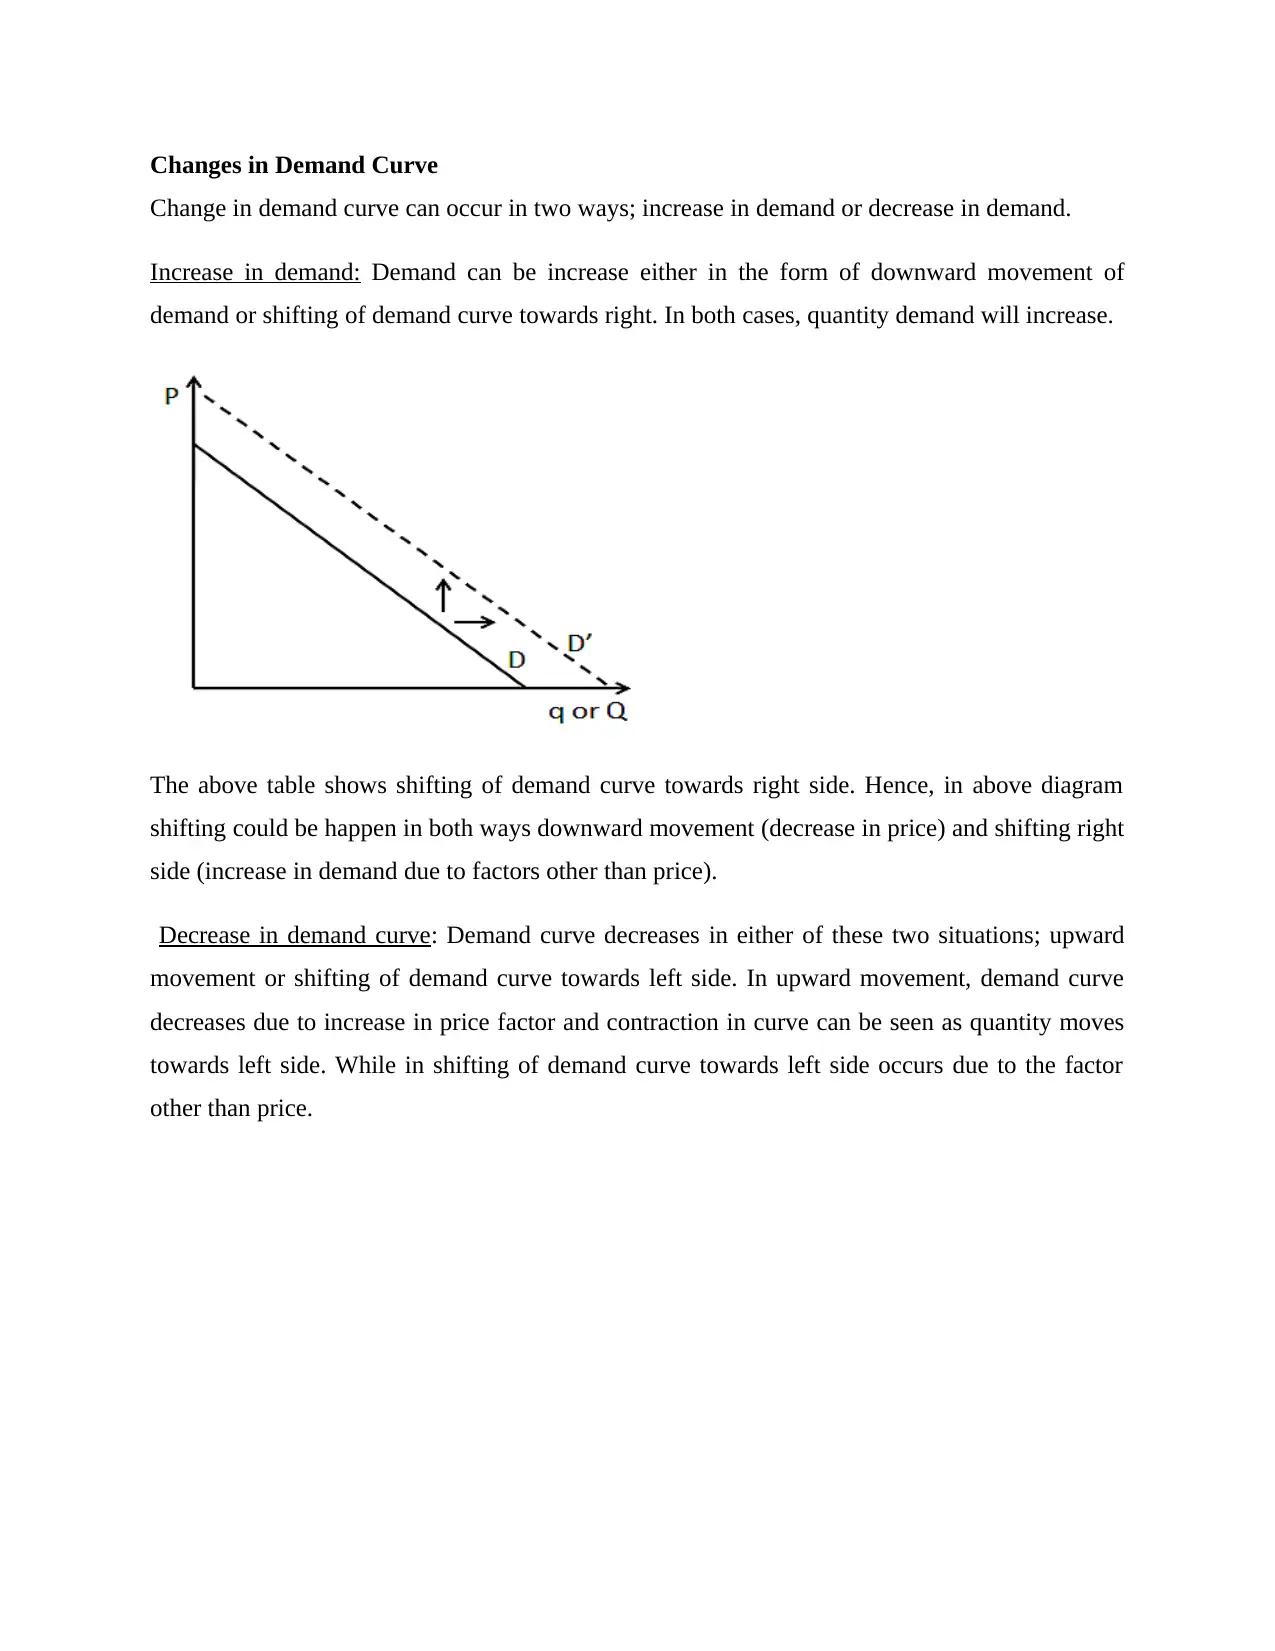
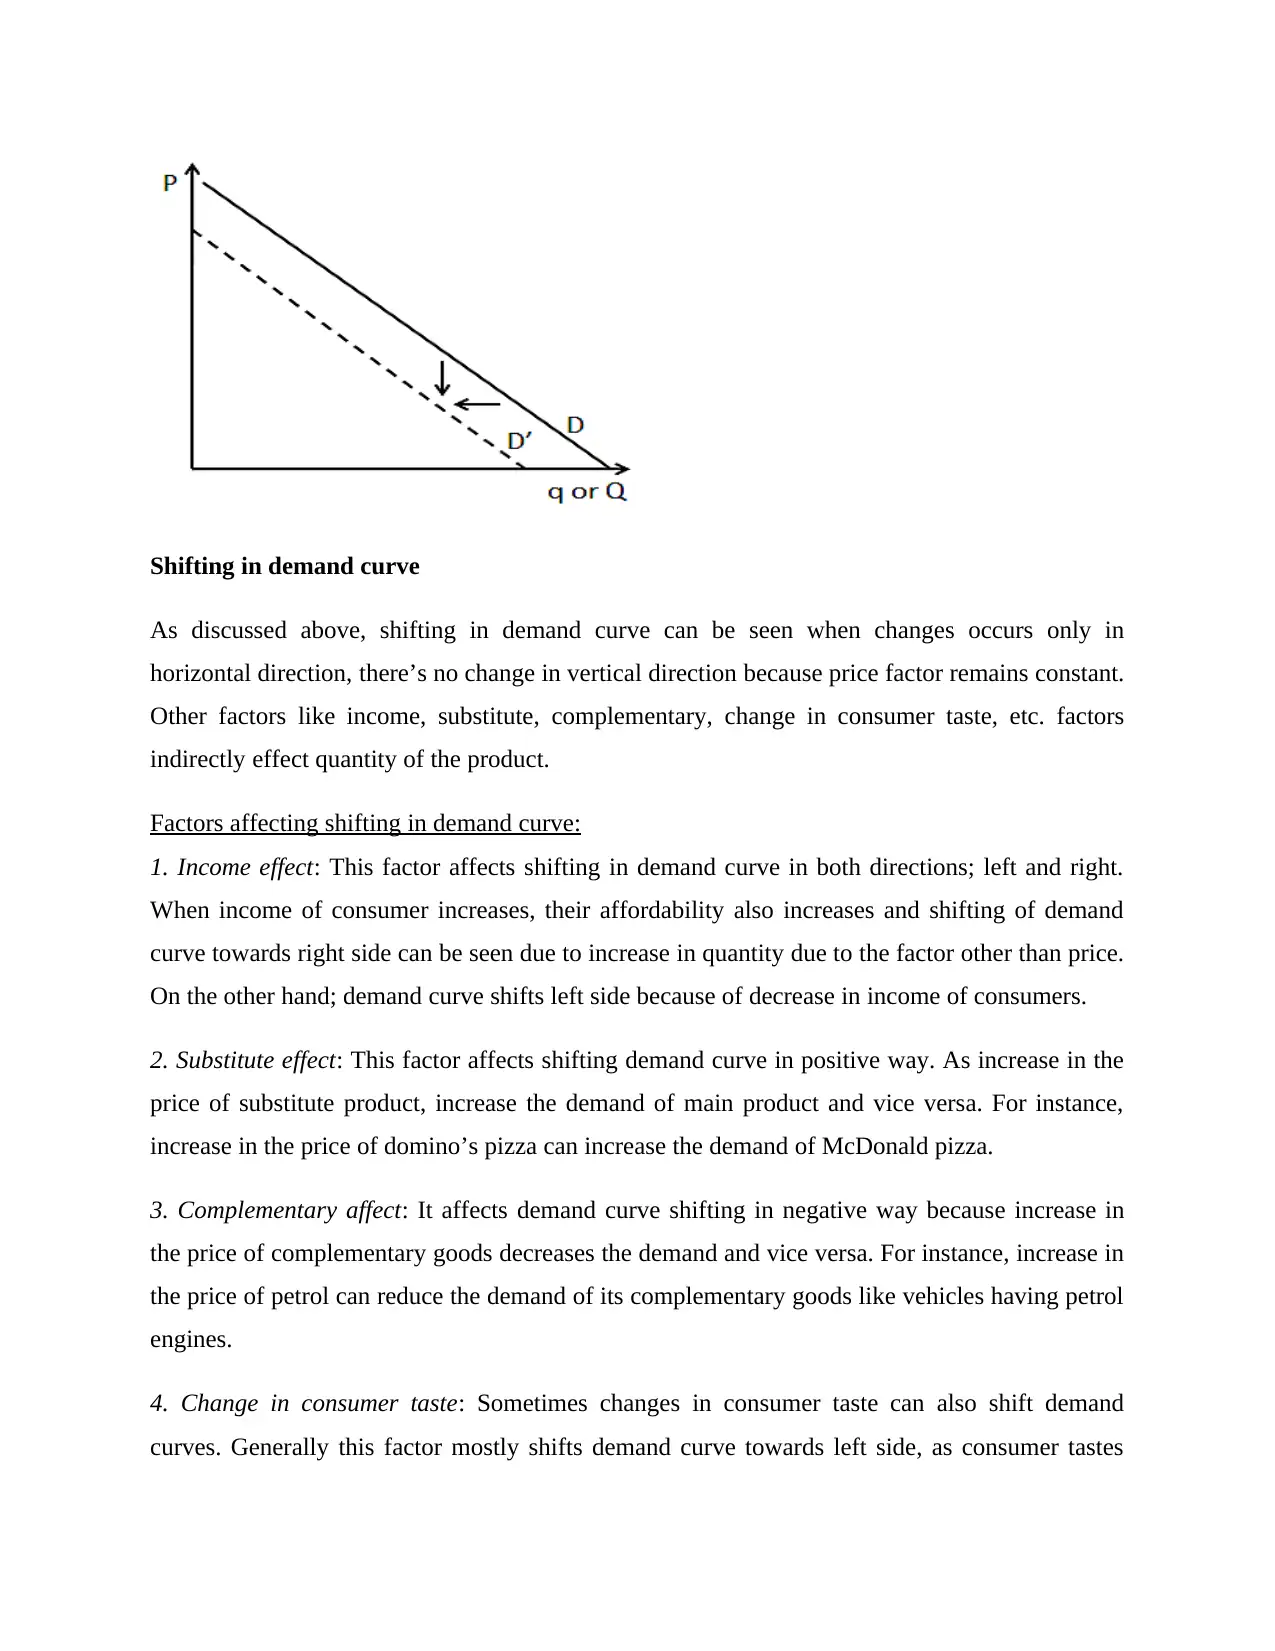
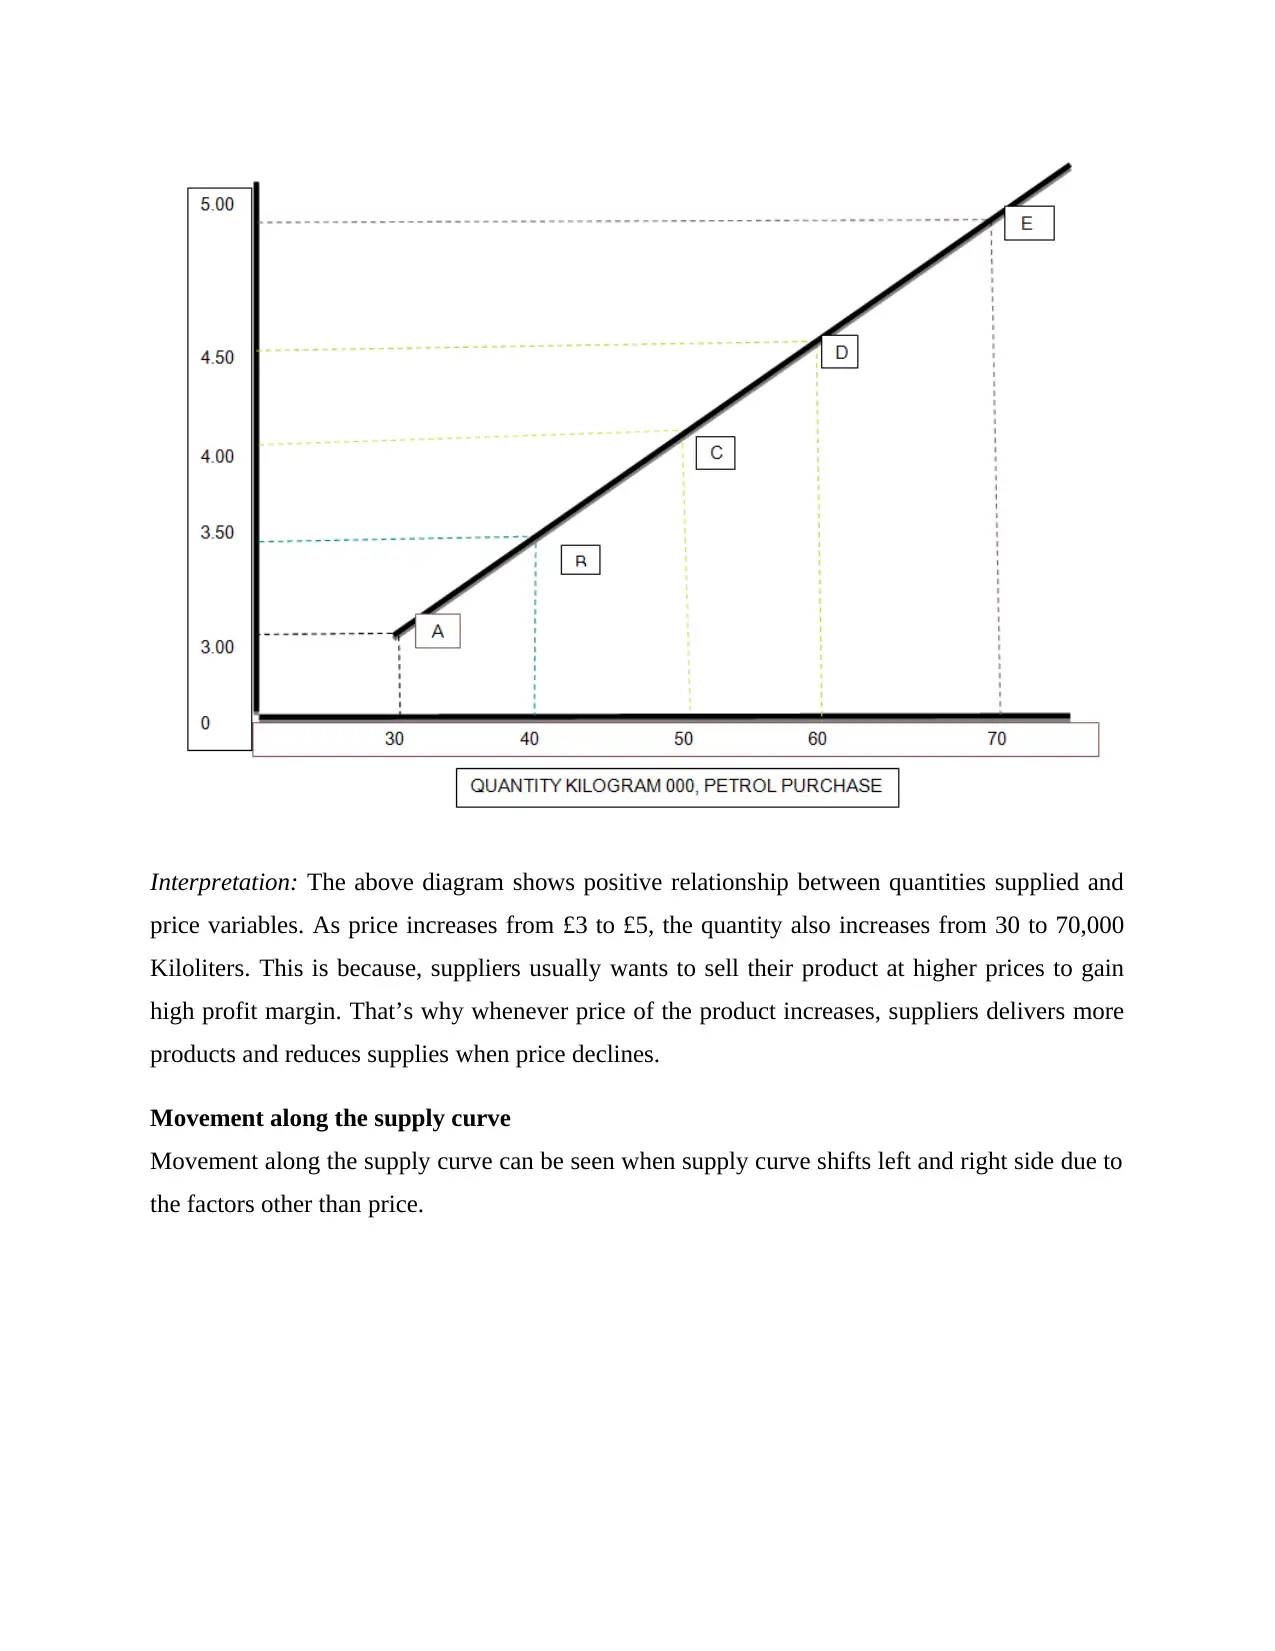
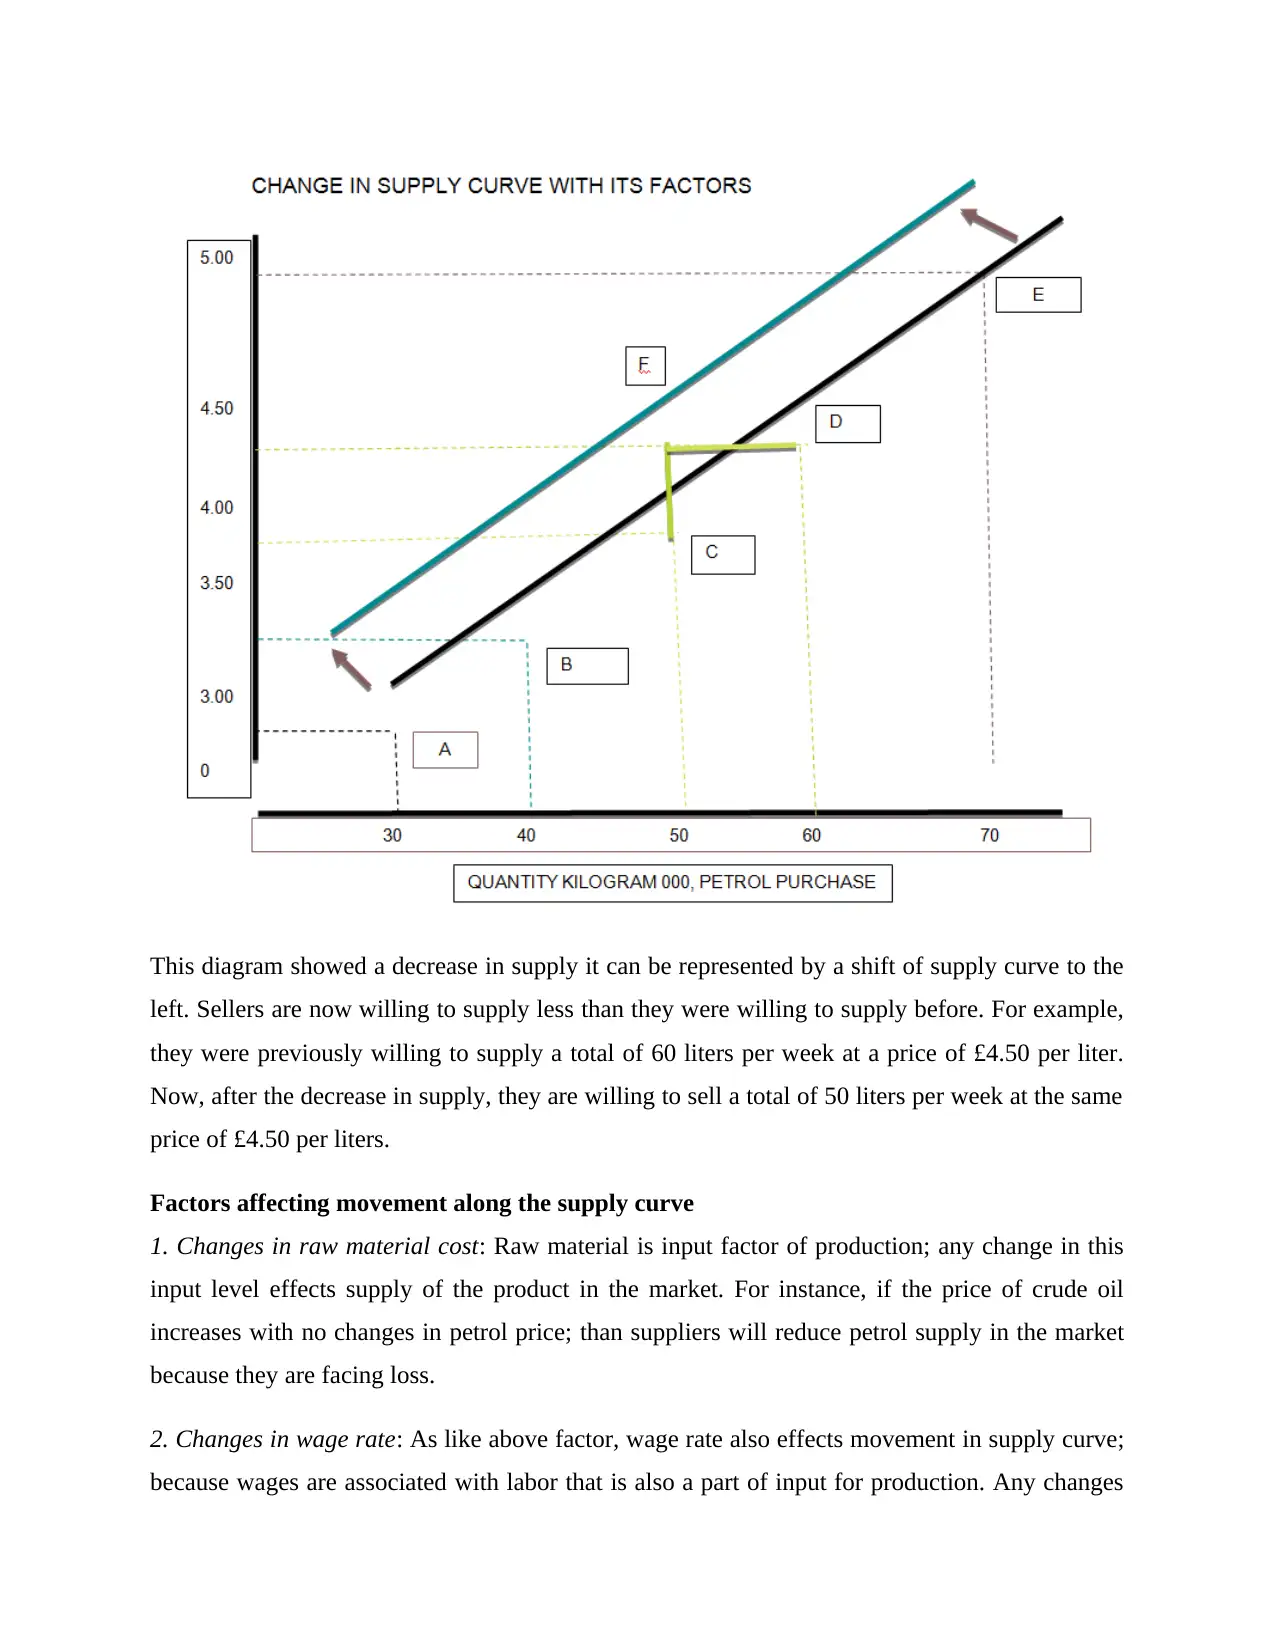
This report provides a comprehensive analysis of supply and demand principles in economics. It begins by explaining the law of demand, illustrating movements along the demand curve and factors that cause shifts in the curve, using diagrams for clarity. Similarly, the report covers the law of supply, its curve movements, and the factors influencing supply. The analysis extends to a comparison of 20th-century and 21st-century economic theories, highlighting key differences and the evolution of economic thought, with a focus on Karl Marx's theory of economic inequality and its modern applications. The report also discusses the shift from traditional economic assumptions to the integration of practical and technical theories, alongside comparisons based on GDP. The oil industry is used as a reference point throughout the report to illustrate the application of the principles discussed.
tabler-icon-diamond-filled.svg

Contribute Materials

Your contribution can guide someone’s learning journey. Share your documents today.
Document Page
SUPPLY AND DEMAND
tabler-icon-diamond-filled.svg

Secure Best Marks with AI Grader

Need help grading? Try our AI Grader for instant feedback on your assignments.
Document Page
Table of Contents
Introduction......................................................................................................................................3
1.1 EXPLAIN THE LAW OF DEMAND, MOVEMENT ALONG THE SAME DEMAND
CURVE (WITH THE AID OF DIAGRAM) AND CHANGE IN DEMAND CURVE WITH
FACTORS (WITH THE AID OF DIAGRAM)..............................................................................4
EXPLAIN THE LAW OF SUPPLY, MOVEMENT ALONG THE SAME SUPPLYCURVE
(WITH THE AID OF DIAGRAM) AND CHANGES IN SUPPLY CURVE WITH ITS
FACTORS (WITH THE AID OF DIAGRAM)..............................................................................8
Task 2.............................................................................................................................................11
20th century economics theories and 21st century economic theories........................................11
Conclusion.....................................................................................................................................14
References......................................................................................................................................15
Document Page
Introduction
Economics is a concept that governs the creation, circulation and use of elements of products and
initiatives. This idea can be divided into two general classifications; macroeconomics and
microeconomics. Consider the behavior of the economy as a whole (Spencer, 1990).
Contemporary business study is characterized by an update of business methods in the modern
world. It involves adopting the latest strategies to increase the company's profits (Spencer, 1990).
This assessment is related to the clarification of the law of participation and pardon in the context
of the oil industry. Task 2, reflects the comparison between 20th and 21st centuries emerging
theories and models. Additional to this contemporary economics concept has also been discussed
with those of the 20th century.
In this assessment, the oil industry was taken as a reference for understanding the different
notion of interest and the law of grace.
Document Page
1.1 EXPLAIN THE LAW OF DEMAND, MOVEMENT ALONG THE SAME
DEMAND CURVE (WITH THE AID OF DIAGRAM) AND CHANGE IN
DEMAND CURVE WITH FACTORS (WITH THE AID OF DIAGRAM)
Law of Demand
The law of demand states that various variable variables, the cost and amount of any major
administrative interest and vice versa are identified among them. As the cost of something goes
up, interest in something similar will decrease.
Law of demand explains consumer choice behavior when the value changes. Looking, expect the
various components that influence demand to be stable, when the cost of a reasonable climb
causes a drop in interest of that big one. This is the buyer’s standard decision behavior. This is
because a buyer delays spending more on the big one for fear of leaving money behind.
tabler-icon-diamond-filled.svg

Secure Best Marks with AI Grader

Need help grading? Try our AI Grader for instant feedback on your assignments.
Document Page
Interpretation: In the above diagram; law of demand is applied on petroleum product; where
relationship between price and quantity demanded has been analyzed. The graph shows two
variables Price and Quantity; on the Y axis Price is given, while on X axis Quantity is given. The
diagram shows downward movement of demand curve; the relation shows that with the increase
in the price of Petrol, Quantity demanded decreases. For instance, at price £5 Quantity demand is
30 liters; on the other hand, at price £3 the Quantity demanded increases to 70 liters.
Movement along the same demand curve
A movement along the same demand curve happens when there’s change in demand curve.
The movement occurs in two ways:
Upward Movement: It refers to contraction of demand curve due to movement of quantity left
side (q to q2) as price increases from p to p2.
Downward Movement: It is also known as expansion of demand curve due to movement of
quantity towards right side (q to q1) as price decreases from p to p1.
It can be stated that, movement along the demand curve occurs when there’s movement in
quantity due to changes in price.
Document Page
Changes in Demand Curve
Change in demand curve can occur in two ways; increase in demand or decrease in demand.
Increase in demand: Demand can be increase either in the form of downward movement of
demand or shifting of demand curve towards right. In both cases, quantity demand will increase.
The above table shows shifting of demand curve towards right side. Hence, in above diagram
shifting could be happen in both ways downward movement (decrease in price) and shifting right
side (increase in demand due to factors other than price).
Decrease in demand curve: Demand curve decreases in either of these two situations; upward
movement or shifting of demand curve towards left side. In upward movement, demand curve
decreases due to increase in price factor and contraction in curve can be seen as quantity moves
towards left side. While in shifting of demand curve towards left side occurs due to the factor
other than price.
Document Page
Shifting in demand curve
As discussed above, shifting in demand curve can be seen when changes occurs only in
horizontal direction, there’s no change in vertical direction because price factor remains constant.
Other factors like income, substitute, complementary, change in consumer taste, etc. factors
indirectly effect quantity of the product.
Factors affecting shifting in demand curve:
1. Income effect: This factor affects shifting in demand curve in both directions; left and right.
When income of consumer increases, their affordability also increases and shifting of demand
curve towards right side can be seen due to increase in quantity due to the factor other than price.
On the other hand; demand curve shifts left side because of decrease in income of consumers.
2. Substitute effect: This factor affects shifting demand curve in positive way. As increase in the
price of substitute product, increase the demand of main product and vice versa. For instance,
increase in the price of domino’s pizza can increase the demand of McDonald pizza.
3. Complementary affect: It affects demand curve shifting in negative way because increase in
the price of complementary goods decreases the demand and vice versa. For instance, increase in
the price of petrol can reduce the demand of its complementary goods like vehicles having petrol
engines.
4. Change in consumer taste: Sometimes changes in consumer taste can also shift demand
curves. Generally this factor mostly shifts demand curve towards left side, as consumer tastes
tabler-icon-diamond-filled.svg

Paraphrase This Document

Need a fresh take? Get an instant paraphrase of this document with our AI Paraphraser
Document Page
changes frequently and an upgrade requires for maintaining the demand of the product. For
instance demand of Apple’s Iphone, gazettes, clothes, cars, etc. changes within a year and
consumer requires upgraded version of that product.
EXPLAIN THE LAW OF SUPPLY, MOVEMENT ALONG THE SAME
SUPPLYCURVE (WITH THE AID OF DIAGRAM) AND CHANGES IN SUPPLY
CURVE WITH ITS FACTORS (WITH THE AID OF DIAGRAM)
Law of Supply
The law of supply is the microeconomic law which states that because all the various
components are equal, as the cost or reasonable administration increases, the level of
merchandising or administration that suppliers offers will also increase, and vice versa. The law
flexibly states that as the cost of an item increases, suppliers will try to maximize their benefits
by expanding what's available for purchase.
Document Page
Interpretation: The above diagram shows positive relationship between quantities supplied and
price variables. As price increases from £3 to £5, the quantity also increases from 30 to 70,000
Kiloliters. This is because, suppliers usually wants to sell their product at higher prices to gain
high profit margin. That’s why whenever price of the product increases, suppliers delivers more
products and reduces supplies when price declines.
Movement along the supply curve
Movement along the supply curve can be seen when supply curve shifts left and right side due to
the factors other than price.
Document Page
This diagram showed a decrease in supply it can be represented by a shift of supply curve to the
left. Sellers are now willing to supply less than they were willing to supply before. For example,
they were previously willing to supply a total of 60 liters per week at a price of £4.50 per liter.
Now, after the decrease in supply, they are willing to sell a total of 50 liters per week at the same
price of £4.50 per liters.
Factors affecting movement along the supply curve
1. Changes in raw material cost: Raw material is input factor of production; any change in this
input level effects supply of the product in the market. For instance, if the price of crude oil
increases with no changes in petrol price; than suppliers will reduce petrol supply in the market
because they are facing loss.
2. Changes in wage rate: As like above factor, wage rate also effects movement in supply curve;
because wages are associated with labor that is also a part of input for production. Any changes
tabler-icon-diamond-filled.svg

Secure Best Marks with AI Grader

Need help grading? Try our AI Grader for instant feedback on your assignments.
Document Page
in the price of input factors impact the cost of production. If wage rate increases with no changes
in price, than supplier will reduce supply because of less profit margin.
Document Page
Task 2
20th century economics theories and 21st century economic theories
Comparing 20th and 21st century with modern inequality theory of economics:
Karl Max Theory: Economic inequality refers to the differences in money between people's
social events, people's meetings or countries. Unbalanced features of money from time to time
include pay imbalance, abundance inequality or abundance opening. Money experts usually
focus on three measurable systems for analyzing the disadvantages of money: wealth, pay, and
consumption. The issue of money irregularity is related to dress ideas, correct results and
reference letters. The irrational characteristics of money are a combination of social demands,
certain times, financial structures and systems. The term can refer to wage or abundance
improvements over time or to changes in wages and abundance over an extended period. There
are some mathematical tables to measure the money difference. The coefficient is the most
common document, but there are two different strategies (Leshem, 2016).
Supportive Model: In modern business practices; the concept of imbalance is used to determine
the specific conditions of a person's currency. In considering this study; classified countries are
vague, imaginative and ingenious. The parts taken for testing are; unemployment rate, per capita
salary, skill level, human pollution and future opportunities. Prior to the 20th century, the basis
of the study was the per capita pay per country; which is that the normal distribution of money
has prevented the prospect of committing the inconsistency of these measures in keeping the
country high.
Comparison based on GDP:
From the 20th to the twenty-first century, the monetary advancement of any country is viewed as
dependent on their development in the obligation to generally advance or GDP; upheld by its
different segments, for instance, installment, capital spending, issuance/presentation and
missions by the public authority. Be that as it may, in the present mechanical practice; this
thought has vanished. Right now, a few nations are indicating improvement profitability with
feasible turn of events; for instance, measures to recuperate ozone inclusion are changing,
Document Page
attempting to bring more nurseries and plants with outside air. Recently shaped nations have
started to acknowledge the centrality of the earth and the inclination to fix their nations from
arising debacles, for example, loss of assets, natural changes and heaps of interstitial infection.
unique. Up until now, cutting edge control of appraisals is transforming into pre-GDP measures
by nations to separate the viability of made nations.
Replacement of old theories based on assumption with practical integration of technical theories:
20th century market investigators have made a few presumptions dependent on what/if
suppositions and results are; nonetheless, this has nothing to do with the prior conditions that
caused the 2008 emergency. To beat this; Leading 21st century monetary investigators have
rolled out numerous improvements, and yet in light of old basics, for example, old presumptions,
they have likewise not had a lot of an effect. Notwithstanding, the present business practice
includes various chronicled reactivation projects to look at the particular effect of the framework
on outcomes or yield.
Neo-traditional sociology expects that everybody specialists act judiciously in their own personal
responsibility. In differentiation, action in sociology accentuates unselfishness. this can be once
people act with a great deal of consideration and decency than would be the situation in the event
that they acted sanely. Unselfishness is usually coupled to the idea of disparity aversion i.e.
humans don't care for inconsistent outcomes.(Spencer, 1990)
There square measure a few mental component inclinations which will affect conduct. One is
that the Anchoring result once people trust intensely on an audacious bit of information to help
the North American country construct a decision. Another is that the openness heuristic any
place we will in general over-gauge the opportunity of one thing occurring because of a similar
occasion has either happened as of late or because of, we will in general feel enthusiastic a
couple of past comparative occasions. The hopefulness predisposition discover that people will
in general be too guaranteed concerning the final product of arranged activities and decisions and
in this way the deficiency inclination is that the propensity to value one thing a ton of if it's idea
of as rare.(Spencer, 1990)
tabler-icon-diamond-filled.svg

Paraphrase This Document

Need a fresh take? Get an instant paraphrase of this document with our AI Paraphraser
Document Page
A significant side of movement hypothesis is misfortune repugnance. the major arrangement
behind misfortune abhorrence is that people feel misfortunes preferably more over increases. we
will in general observe this as a rule in currency showcases for example once trade financial
specialists hold their speculation positions with paper misfortunes excessively long (wanting to it
share expenses can recuperate) and sell their venture positions with paper gains too early.
(Spencer, 1990)
Final reasoned comment
Non-traditional sociology has designed models of balance that have become more married to the
lives of real people and groups. In our crowded world the vulnerability of any place where the
new practice in general cannot use a "one size fits all" model to understand the movement of a
non-socio-economic economy. at least experience is the answer, as Paul Ormerod said: “A
master of money no longer equates to a good background in sociology if you don't know the
most active subjects of the social sciences. "(Spencer, 1971)
Document Page
Conclusion
Typically, human beings will demand two that is buying more of an excellent or service to
reduce the more expensive costs. An exchange tax that moves on the interest loop from one to
another and is referred to as an exchange of the required amount. When all is said and done, the
sellers are entitled to a more substantial cost than the declining costs. A change of direction leads
to gracefully close development near the curve, starting with one factor and then the next. In a
diagram, market equilibrium is where the curves intersect with grace and demand. The charge at
this crossover point is the balance rate and the rate is the balance. As buyers and advertisers
interface, the market will be vulnerable to step balancing and cost balancing.
Document Page
References
Sloman, j. (2003) Economic. 5th edn. Essex: Pearson Education Limited, p. 37.
Spencer, M. (1971) Contemporary economics. 7th edn. New York: Worth Publishers Inc, pp. 46-
48
Marx, K., 1972. The marx-engels reader (Vol. 4). New York: Norton.
Kadak, T., 2011. Creation of a supportive model for designing and improving the performance
management system of an organization. Case studies (Doctoral thesis on economics,
Tallinn University of Technology, Tallinn).
AMADEO, K. (2019) The Law of Demand Explained Using Examples in the U.S. Economy,
The Balance. Available at: https://www.thebalance.com/law-of-demand-definition-
explained-examples-3305707
Definition of Change in Supply | Higher Rock Education (2018). Available at:
https://www.higherrockeducation.org/glossary-of-terms/change-in-supply
Whelan, J. and Msefer, K. (1996) ECONOMIC SUPPLY & DEMAND, Ocw.mit.edu. Available
at: https://ocw.mit.edu/courses/sloan-school-of-management/15-988-system-dynamics-
self-study-fall-1998-spring-1999/readings/economics.pdf
S, S. (2018) Difference Between Movement and Shift in Demand Curve (with Figure and
Comparison Chart) - Key Differences, Key Differences. Available at:
https://keydifferences.com/difference-between-movement-and-shift-in-demand-
curve.html
chevron_up_icon
1 out of 16
circle_padding
hide_on_mobile
zoom_out_icon
logo.png

Your All-in-One AI-Powered Toolkit for Academic Success.

Available 24*7 on WhatsApp / Email

[object Object]