Simulation Analysis Report: Supreme Auto Performance
VerifiedAdded on 2020/07/23
|23
|7638
|207
Report
AI Summary
This report analyzes the simulation of Supreme Auto, examining its performance across four rounds. The company aimed to achieve specific market shares for its car models (Optimums, Grand, and Drift), reduce costs, and increase gross margins. The simulation results reveal the production, sales, and unsold stock for each model, along with key financial metrics such as outstanding debt, return on assets, current ratio, gross margin, and profit per employee. The report evaluates the company's progress towards its objectives, highlighting variances between rounds and reflecting on team performance and learning. The analysis emphasizes the importance of resource utilization, market share expansion, and financial health, including liquidity and profitability ratios, to achieve sustainable business growth. The report also assesses the impact of launching the new Drift model and its contribution to the company's overall success. The report concludes with a discussion of the company's financial performance, market share, and the team's learning outcomes.
Assignment B
Paraphrase This Document
Need a fresh take? Get an instant paraphrase of this document with our AI Paraphraser
Table of Contents
INTRODUCTION...........................................................................................................................3
Company performance................................................................................................................3
Learning....................................................................................................................................12
Conclusion ................................................................................................................................17
Team Performance....................................................................................................................17
REFERENCES..............................................................................................................................20
INTRODUCTION
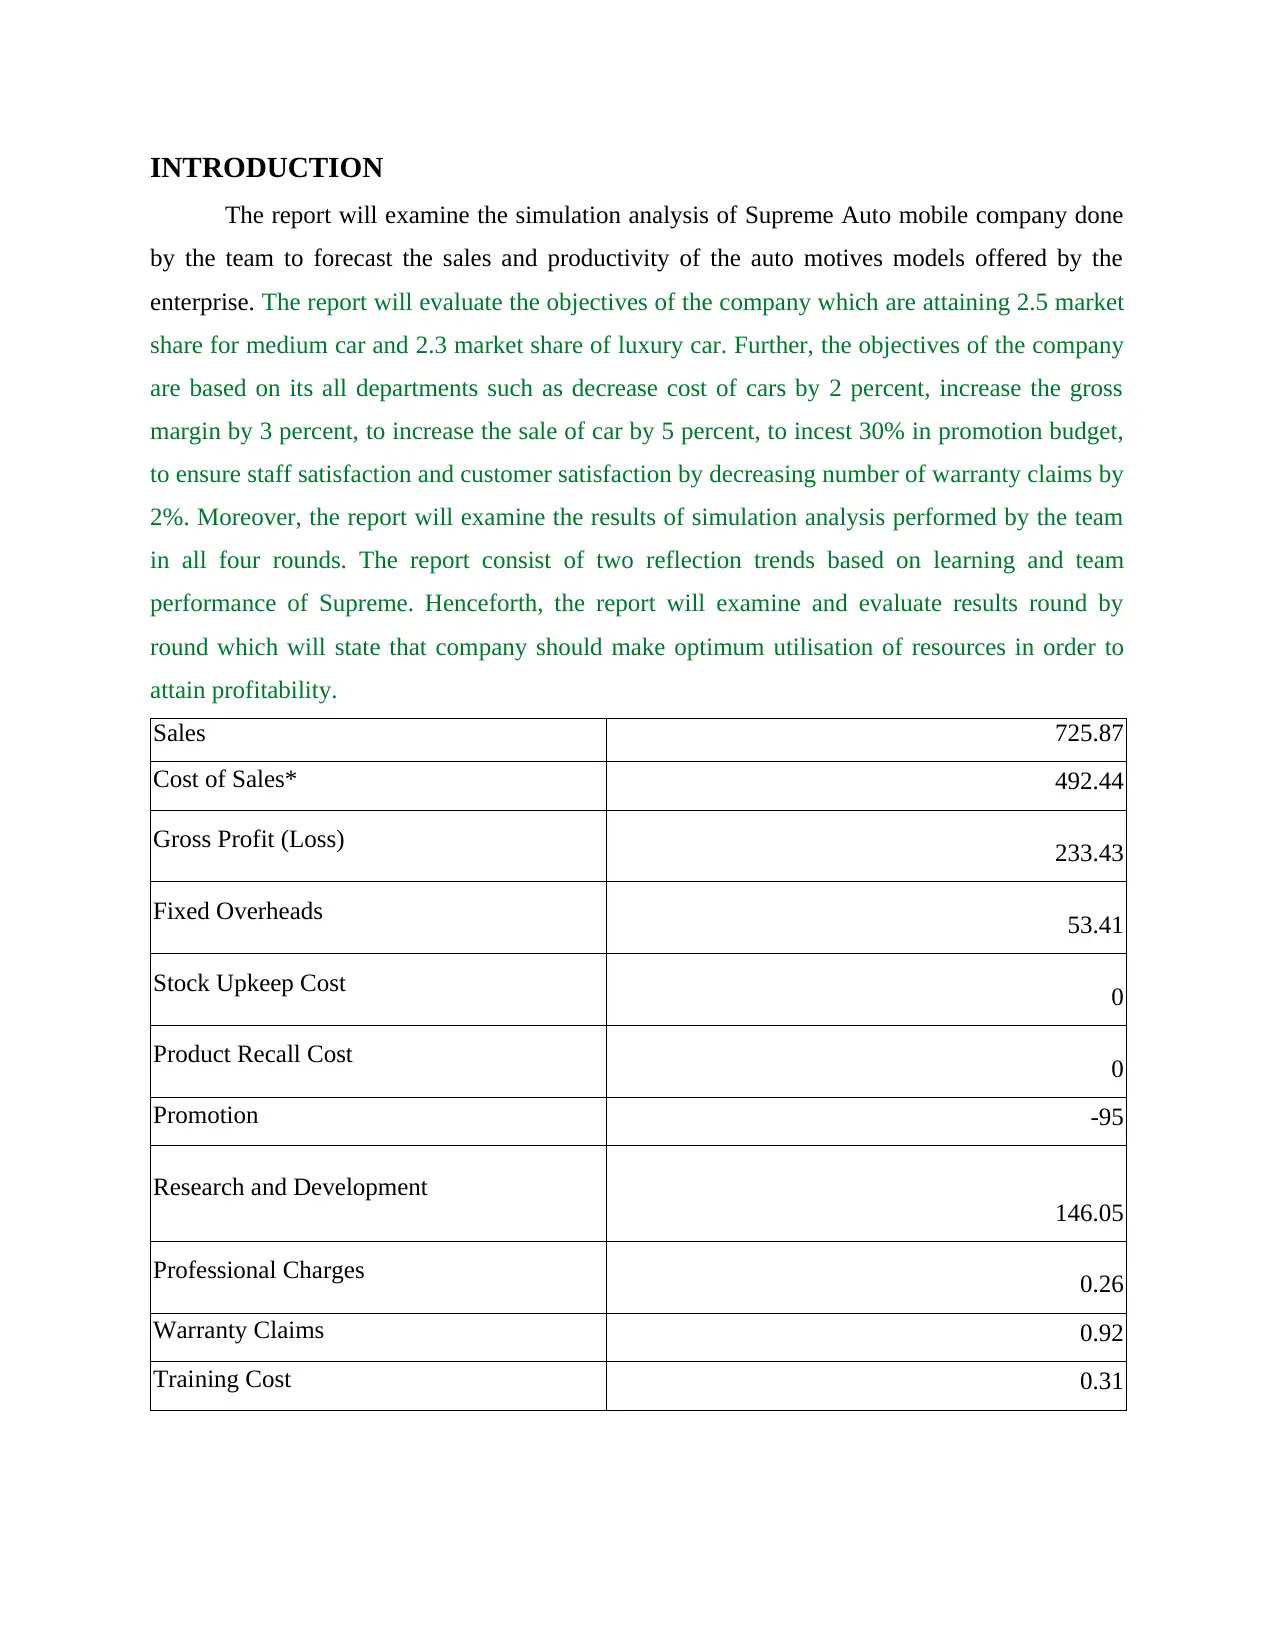
The report will examine the simulation analysis of Supreme Auto mobile company done
by the team to forecast the sales and productivity of the auto motives models offered by the
enterprise. The report will evaluate the objectives of the company which are attaining 2.5 market
share for medium car and 2.3 market share of luxury car. Further, the objectives of the company
are based on its all departments such as decrease cost of cars by 2 percent, increase the gross
margin by 3 percent, to increase the sale of car by 5 percent, to incest 30% in promotion budget,
to ensure staff satisfaction and customer satisfaction by decreasing number of warranty claims by
2%. Moreover, the report will examine the results of simulation analysis performed by the team
in all four rounds. The report consist of two reflection trends based on learning and team
performance of Supreme. Henceforth, the report will examine and evaluate results round by
round which will state that company should make optimum utilisation of resources in order to
attain profitability.
Sales 725.87
Cost of Sales* 492.44
Gross Profit (Loss) 233.43
Fixed Overheads 53.41
Stock Upkeep Cost 0
Product Recall Cost 0
Promotion -95
Research and Development
146.05
Professional Charges 0.26
Warranty Claims 0.92
Training Cost 0.31
⊘ This is a preview!⊘
Do you want full access?
Subscribe today to unlock all pages.
Trusted by 1+ million students worldwide
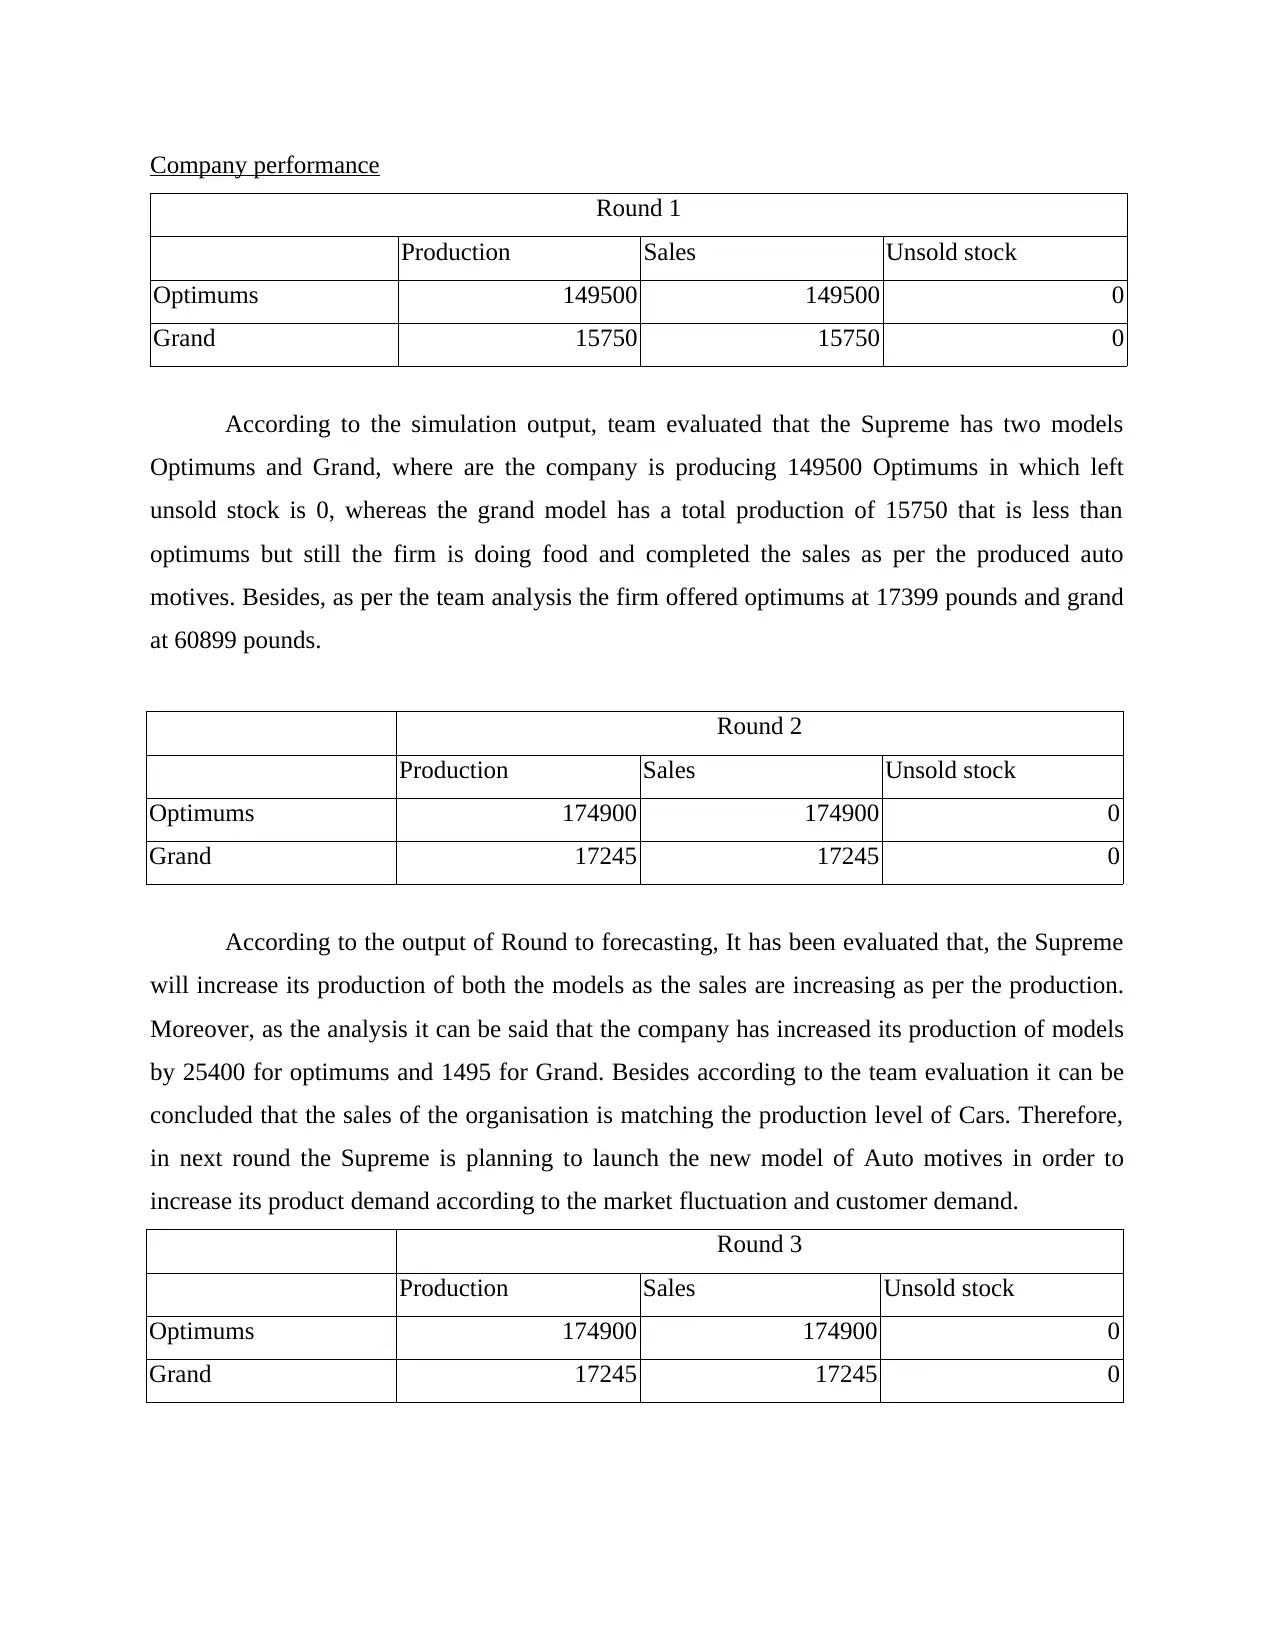
Company performance
Round 1
Production Sales Unsold stock
Optimums 149500 149500 0
Grand 15750 15750 0
According to the simulation output, team evaluated that the Supreme has two models
Optimums and Grand, where are the company is producing 149500 Optimums in which left
unsold stock is 0, whereas the grand model has a total production of 15750 that is less than
optimums but still the firm is doing food and completed the sales as per the produced auto
motives. Besides, as per the team analysis the firm offered optimums at 17399 pounds and grand
at 60899 pounds.
Round 2
Production Sales Unsold stock
Optimums 174900 174900 0
Grand 17245 17245 0
According to the output of Round to forecasting, It has been evaluated that, the Supreme
will increase its production of both the models as the sales are increasing as per the production.
Moreover, as the analysis it can be said that the company has increased its production of models
by 25400 for optimums and 1495 for Grand. Besides according to the team evaluation it can be
concluded that the sales of the organisation is matching the production level of Cars. Therefore,
in next round the Supreme is planning to launch the new model of Auto motives in order to
increase its product demand according to the market fluctuation and customer demand.
Round 3
Production Sales Unsold stock
Optimums 174900 174900 0
Grand 17245 17245 0
Paraphrase This Document
Need a fresh take? Get an instant paraphrase of this document with our AI Paraphraser
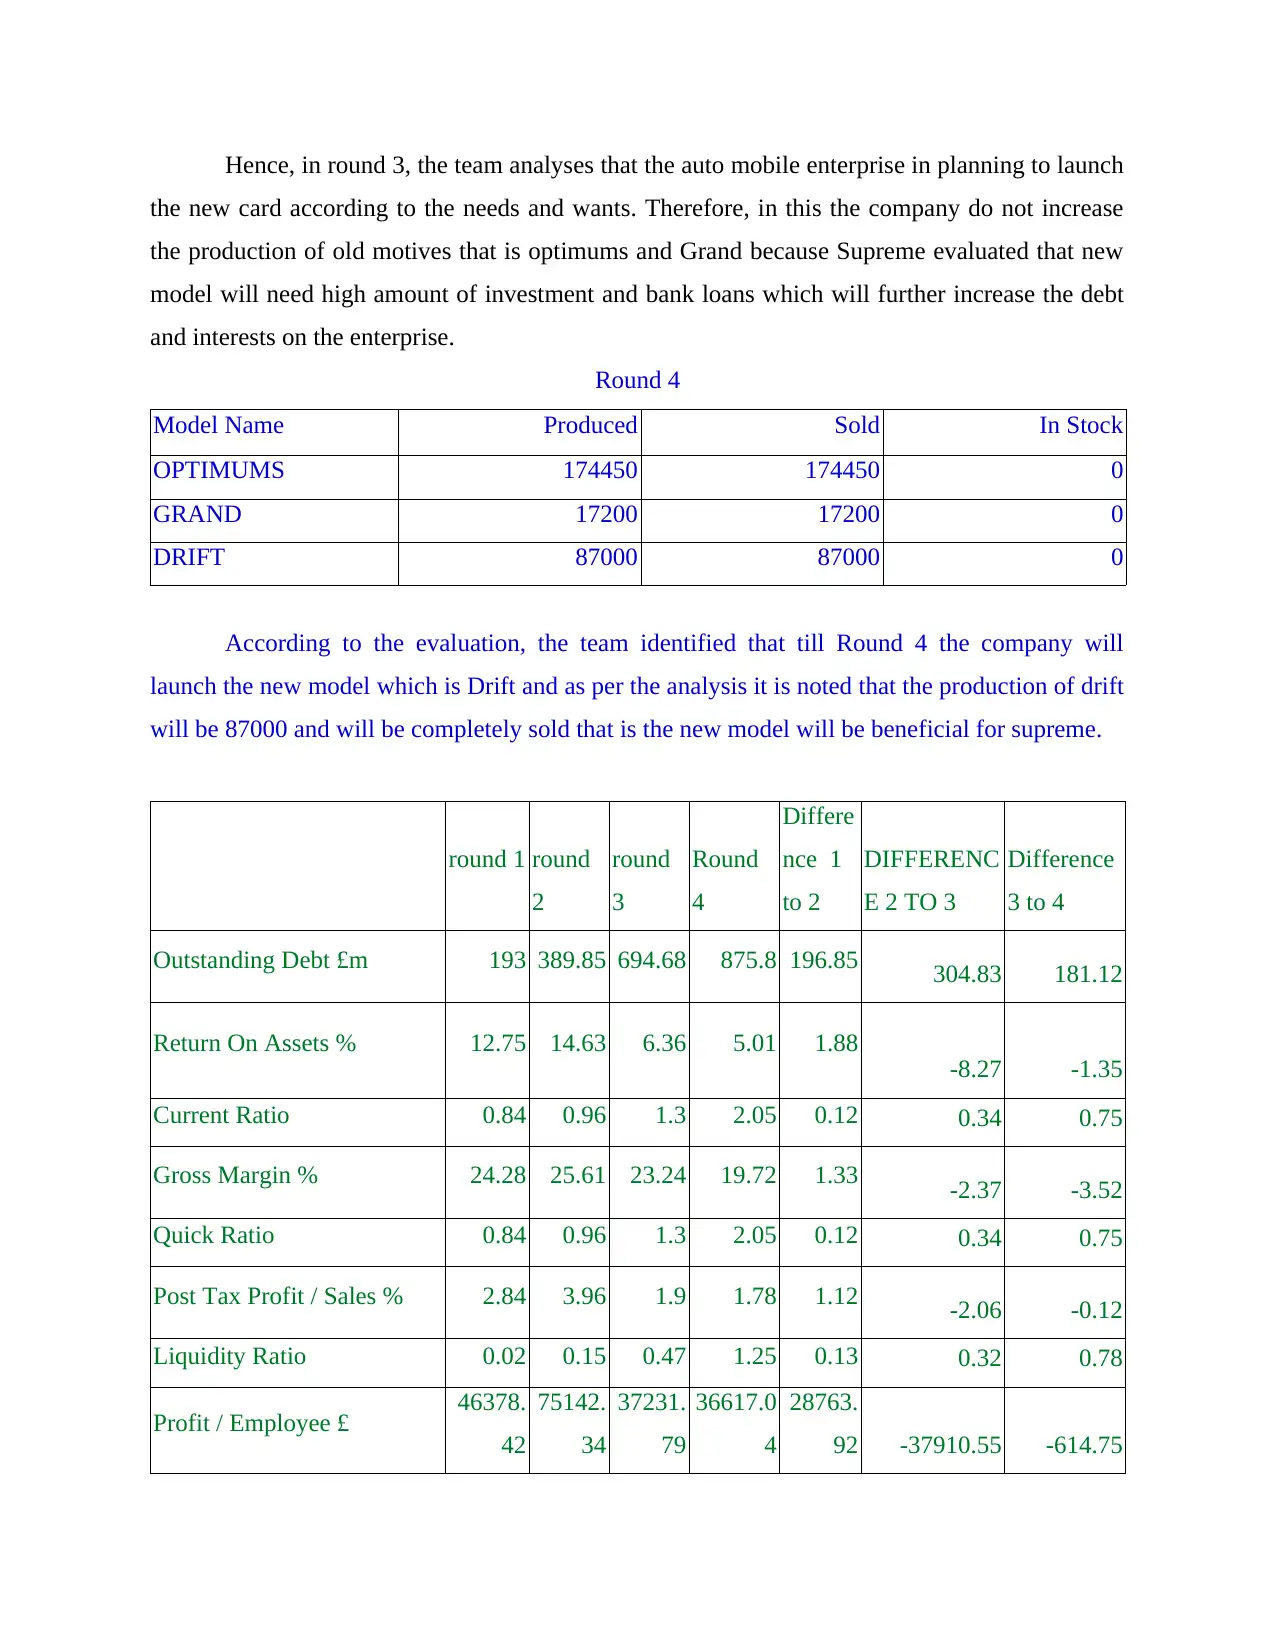
Hence, in round 3, the team analyses that the auto mobile enterprise in planning to launch
the new card according to the needs and wants. Therefore, in this the company do not increase
the production of old motives that is optimums and Grand because Supreme evaluated that new
model will need high amount of investment and bank loans which will further increase the debt
and interests on the enterprise.
Round 4
Model Name Produced Sold In Stock
OPTIMUMS 174450 174450 0
GRAND 17200 17200 0
DRIFT 87000 87000 0
According to the evaluation, the team identified that till Round 4 the company will
launch the new model which is Drift and as per the analysis it is noted that the production of drift
will be 87000 and will be completely sold that is the new model will be beneficial for supreme.
round 1 round
2
round
3
Round
4
Differe
nce 1
to 2
DIFFERENC
E 2 TO 3
Difference
3 to 4
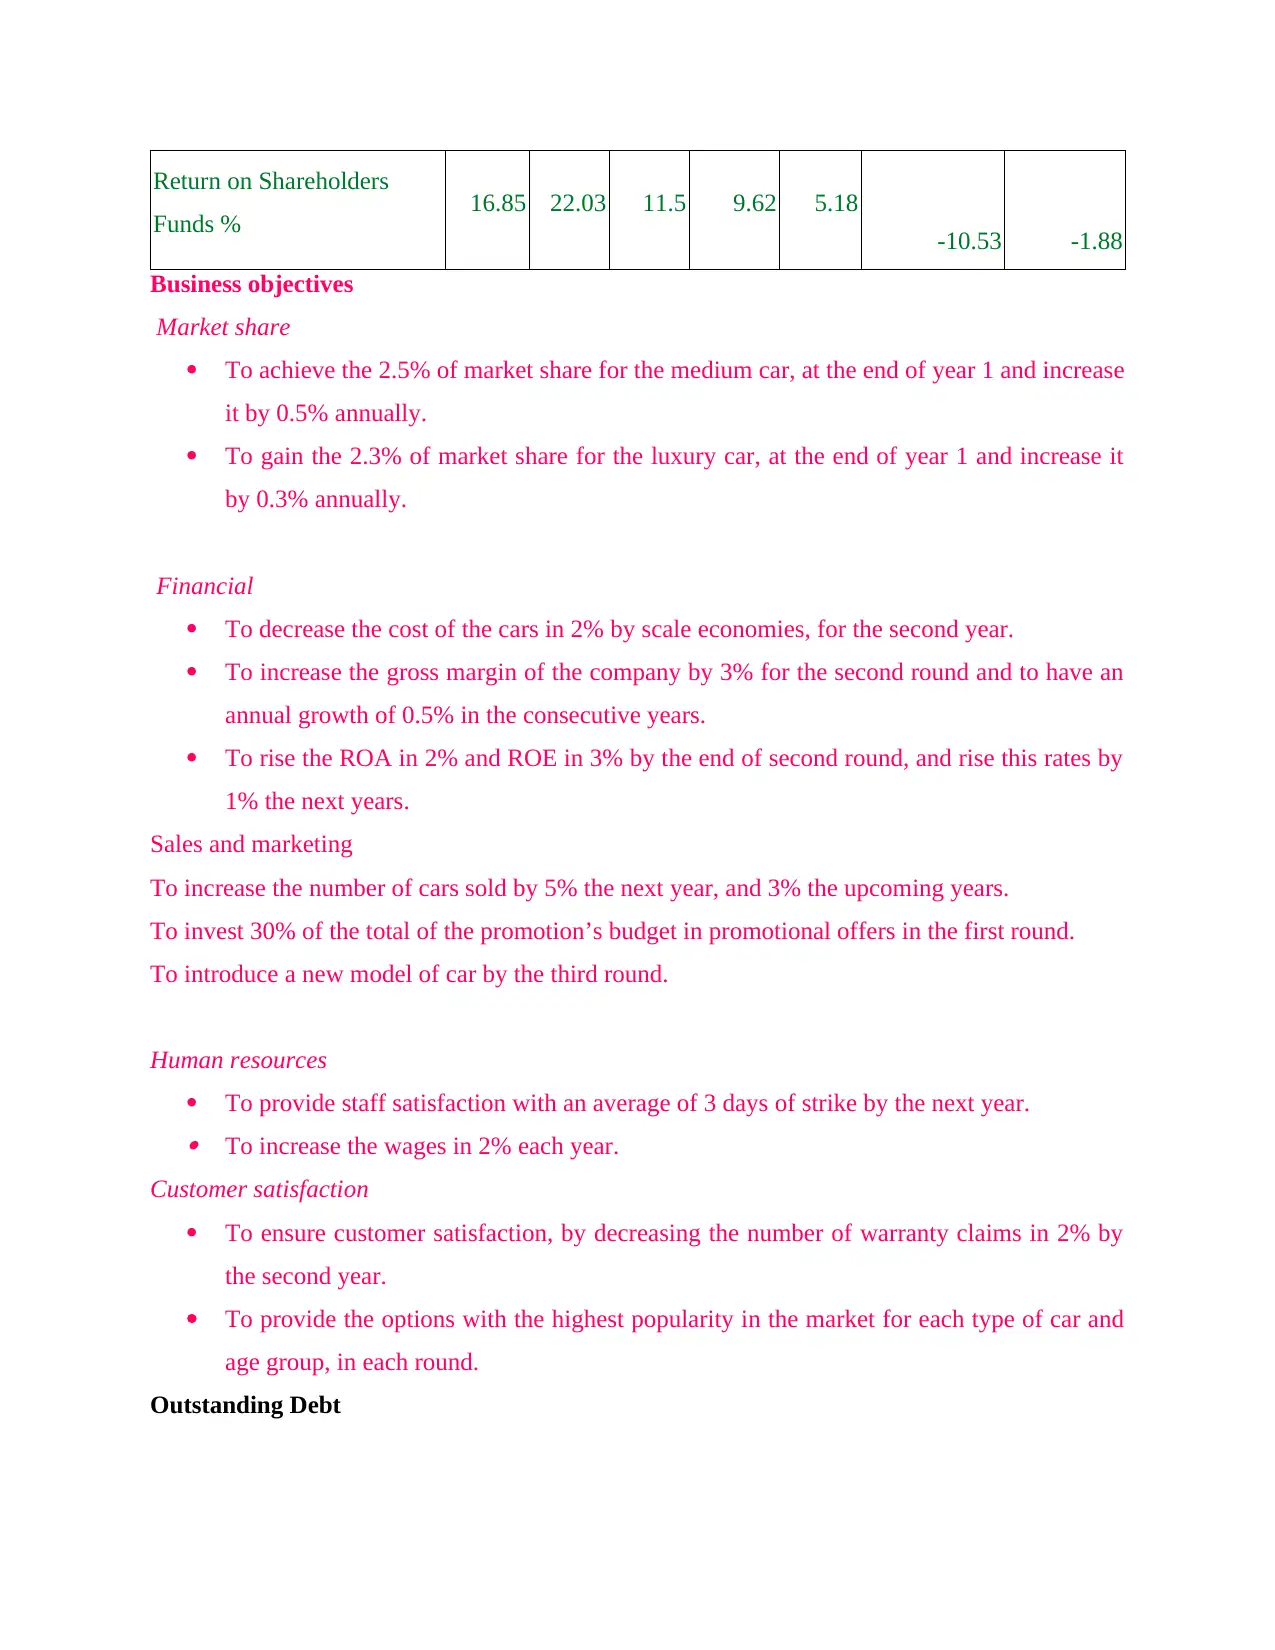
Outstanding Debt £m 193 389.85 694.68 875.8 196.85 304.83 181.12
Return On Assets % 12.75 14.63 6.36 5.01 1.88
-8.27 -1.35
Current Ratio 0.84 0.96 1.3 2.05 0.12 0.34 0.75
Gross Margin % 24.28 25.61 23.24 19.72 1.33 -2.37 -3.52
Quick Ratio 0.84 0.96 1.3 2.05 0.12 0.34 0.75
Post Tax Profit / Sales % 2.84 3.96 1.9 1.78 1.12 -2.06 -0.12
Liquidity Ratio 0.02 0.15 0.47 1.25 0.13 0.32 0.78
Profit / Employee £ 46378.
42
75142.
34
37231.
79
36617.0
4
28763.
92 -37910.55 -614.75
the new card according to the needs and wants. Therefore, in this the company do not increase
the production of old motives that is optimums and Grand because Supreme evaluated that new
model will need high amount of investment and bank loans which will further increase the debt
and interests on the enterprise.
Round 4
Model Name Produced Sold In Stock
OPTIMUMS 174450 174450 0
GRAND 17200 17200 0
DRIFT 87000 87000 0
According to the evaluation, the team identified that till Round 4 the company will
launch the new model which is Drift and as per the analysis it is noted that the production of drift
will be 87000 and will be completely sold that is the new model will be beneficial for supreme.
round 1 round
2
round
3
Round
4
Differe
nce 1
to 2
DIFFERENC
E 2 TO 3
Difference
3 to 4
Outstanding Debt £m 193 389.85 694.68 875.8 196.85 304.83 181.12
Return On Assets % 12.75 14.63 6.36 5.01 1.88
-8.27 -1.35
Current Ratio 0.84 0.96 1.3 2.05 0.12 0.34 0.75
Gross Margin % 24.28 25.61 23.24 19.72 1.33 -2.37 -3.52
Quick Ratio 0.84 0.96 1.3 2.05 0.12 0.34 0.75
Post Tax Profit / Sales % 2.84 3.96 1.9 1.78 1.12 -2.06 -0.12
Liquidity Ratio 0.02 0.15 0.47 1.25 0.13 0.32 0.78
Profit / Employee £ 46378.
42
75142.
34
37231.
79
36617.0
4
28763.
92 -37910.55 -614.75
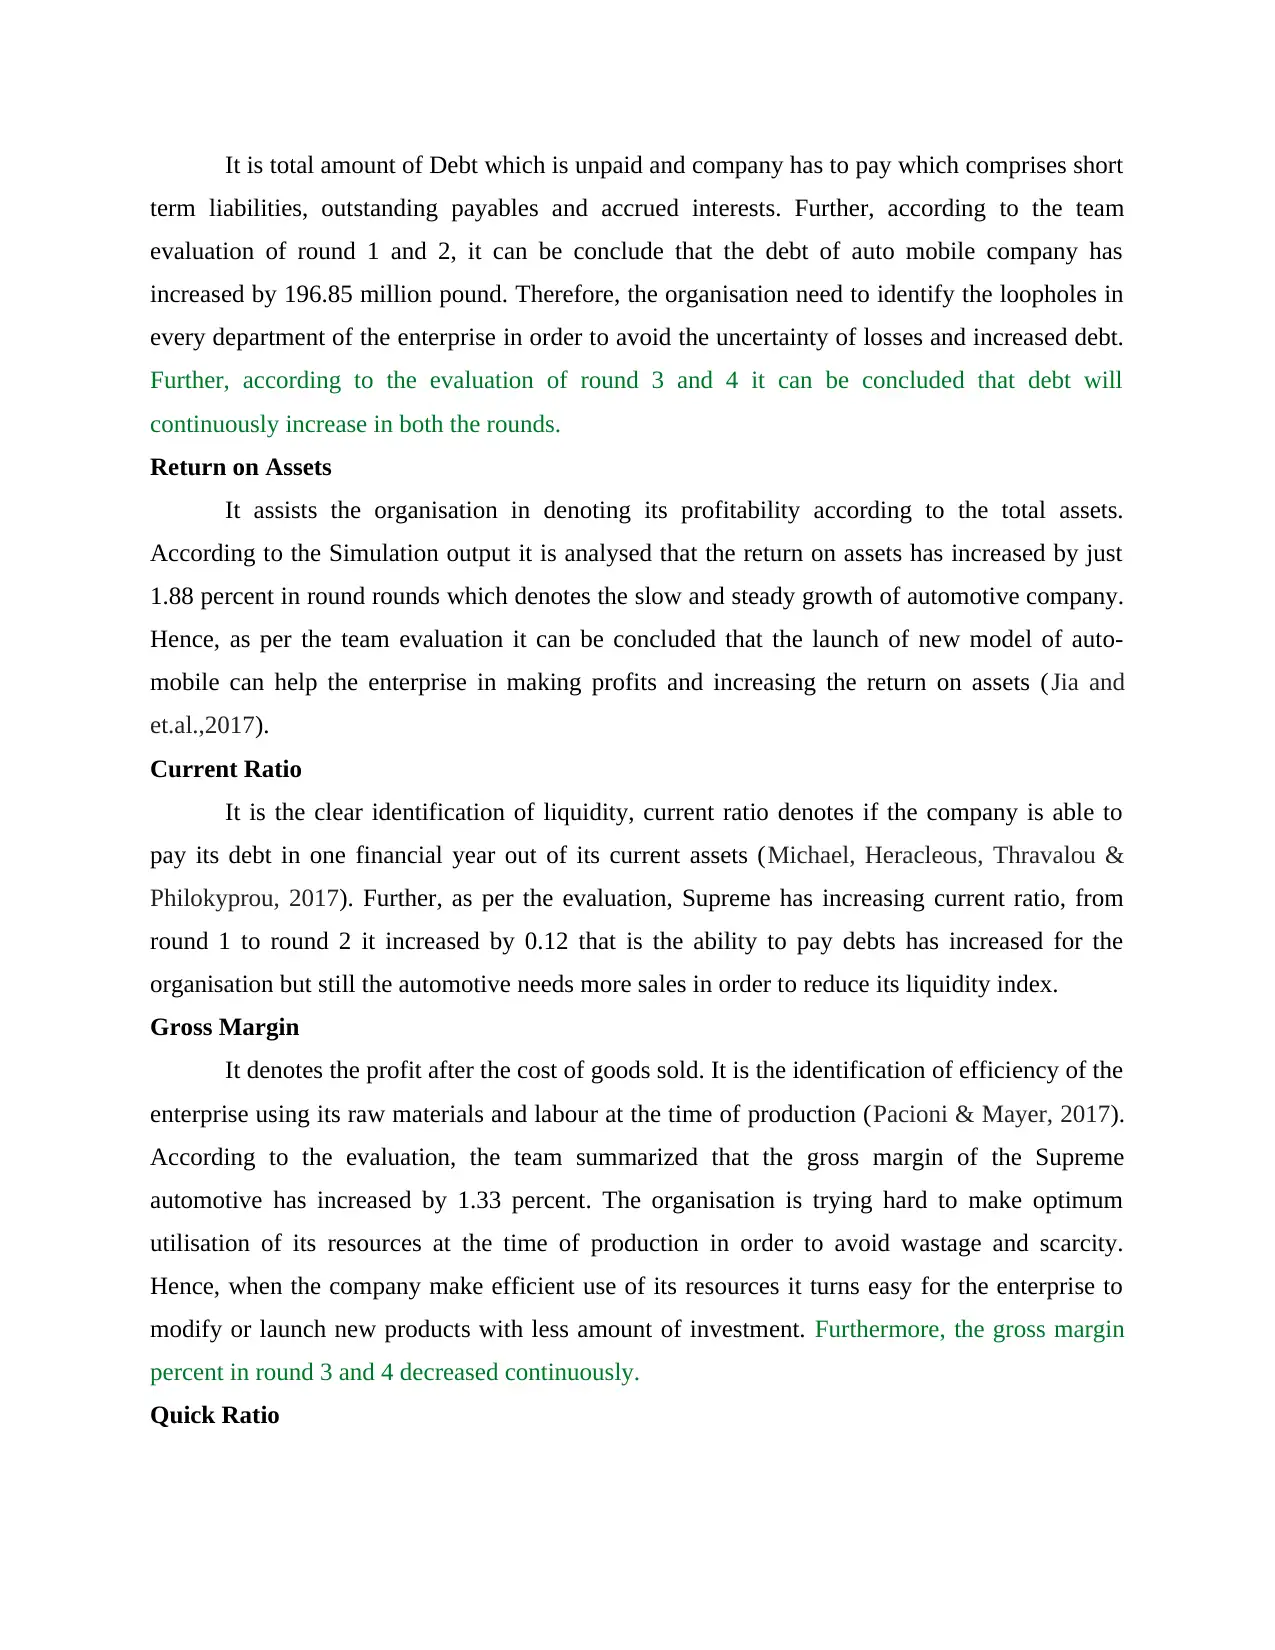
Return on Shareholders
Funds % 16.85 22.03 11.5 9.62 5.18
-10.53 -1.88
Business objectives
Market share
To achieve the 2.5% of market share for the medium car, at the end of year 1 and increase
it by 0.5% annually.
To gain the 2.3% of market share for the luxury car, at the end of year 1 and increase it
by 0.3% annually.
Financial
To decrease the cost of the cars in 2% by scale economies, for the second year.
To increase the gross margin of the company by 3% for the second round and to have an
annual growth of 0.5% in the consecutive years.
To rise the ROA in 2% and ROE in 3% by the end of second round, and rise this rates by
1% the next years.
Sales and marketing
To increase the number of cars sold by 5% the next year, and 3% the upcoming years.
To invest 30% of the total of the promotion’s budget in promotional offers in the first round.
To introduce a new model of car by the third round.
Human resources
To provide staff satisfaction with an average of 3 days of strike by the next year. To increase the wages in 2% each year.
Customer satisfaction
To ensure customer satisfaction, by decreasing the number of warranty claims in 2% by
the second year.
To provide the options with the highest popularity in the market for each type of car and
age group, in each round.
Outstanding Debt
⊘ This is a preview!⊘
Do you want full access?
Subscribe today to unlock all pages.
Trusted by 1+ million students worldwide
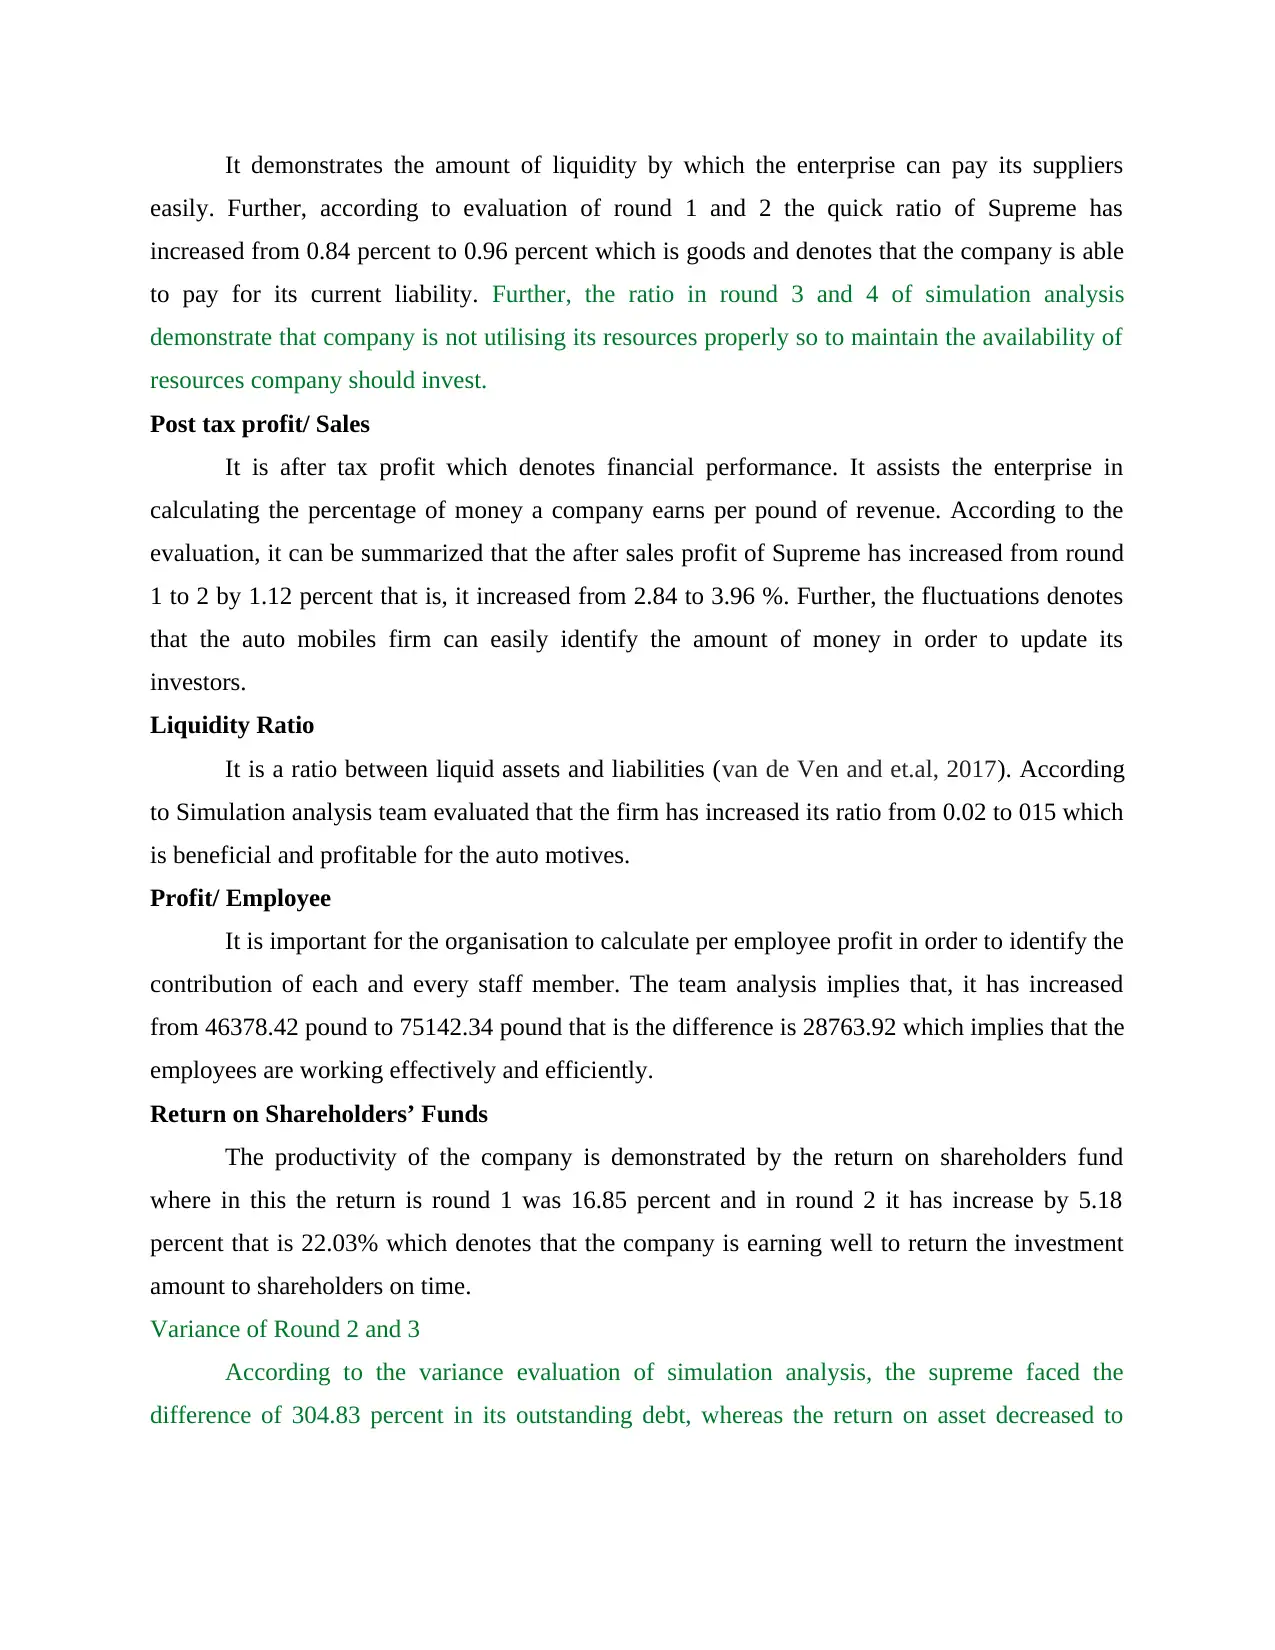
It is total amount of Debt which is unpaid and company has to pay which comprises short
term liabilities, outstanding payables and accrued interests. Further, according to the team
evaluation of round 1 and 2, it can be conclude that the debt of auto mobile company has
increased by 196.85 million pound. Therefore, the organisation need to identify the loopholes in
every department of the enterprise in order to avoid the uncertainty of losses and increased debt.
Further, according to the evaluation of round 3 and 4 it can be concluded that debt will
continuously increase in both the rounds.
Return on Assets
It assists the organisation in denoting its profitability according to the total assets.
According to the Simulation output it is analysed that the return on assets has increased by just
1.88 percent in round rounds which denotes the slow and steady growth of automotive company.
Hence, as per the team evaluation it can be concluded that the launch of new model of auto-
mobile can help the enterprise in making profits and increasing the return on assets ( Jia and
et.al.,2017).
Current Ratio
It is the clear identification of liquidity, current ratio denotes if the company is able to
pay its debt in one financial year out of its current assets (Michael, Heracleous, Thravalou &
Philokyprou, 2017). Further, as per the evaluation, Supreme has increasing current ratio, from
round 1 to round 2 it increased by 0.12 that is the ability to pay debts has increased for the
organisation but still the automotive needs more sales in order to reduce its liquidity index.
Gross Margin
It denotes the profit after the cost of goods sold. It is the identification of efficiency of the
enterprise using its raw materials and labour at the time of production (Pacioni & Mayer, 2017).
According to the evaluation, the team summarized that the gross margin of the Supreme
automotive has increased by 1.33 percent. The organisation is trying hard to make optimum
utilisation of its resources at the time of production in order to avoid wastage and scarcity.
Hence, when the company make efficient use of its resources it turns easy for the enterprise to
modify or launch new products with less amount of investment. Furthermore, the gross margin
percent in round 3 and 4 decreased continuously.
Quick Ratio
Paraphrase This Document
Need a fresh take? Get an instant paraphrase of this document with our AI Paraphraser
It demonstrates the amount of liquidity by which the enterprise can pay its suppliers
easily. Further, according to evaluation of round 1 and 2 the quick ratio of Supreme has
increased from 0.84 percent to 0.96 percent which is goods and denotes that the company is able
to pay for its current liability. Further, the ratio in round 3 and 4 of simulation analysis
demonstrate that company is not utilising its resources properly so to maintain the availability of
resources company should invest.
Post tax profit/ Sales
It is after tax profit which denotes financial performance. It assists the enterprise in
calculating the percentage of money a company earns per pound of revenue. According to the
evaluation, it can be summarized that the after sales profit of Supreme has increased from round
1 to 2 by 1.12 percent that is, it increased from 2.84 to 3.96 %. Further, the fluctuations denotes
that the auto mobiles firm can easily identify the amount of money in order to update its
investors.
Liquidity Ratio
It is a ratio between liquid assets and liabilities (van de Ven and et.al, 2017). According
to Simulation analysis team evaluated that the firm has increased its ratio from 0.02 to 015 which
is beneficial and profitable for the auto motives.
Profit/ Employee
It is important for the organisation to calculate per employee profit in order to identify the
contribution of each and every staff member. The team analysis implies that, it has increased
from 46378.42 pound to 75142.34 pound that is the difference is 28763.92 which implies that the
employees are working effectively and efficiently.
Return on Shareholders’ Funds
The productivity of the company is demonstrated by the return on shareholders fund
where in this the return is round 1 was 16.85 percent and in round 2 it has increase by 5.18
percent that is 22.03% which denotes that the company is earning well to return the investment
amount to shareholders on time.
Variance of Round 2 and 3
According to the variance evaluation of simulation analysis, the supreme faced the
difference of 304.83 percent in its outstanding debt, whereas the return on asset decreased to
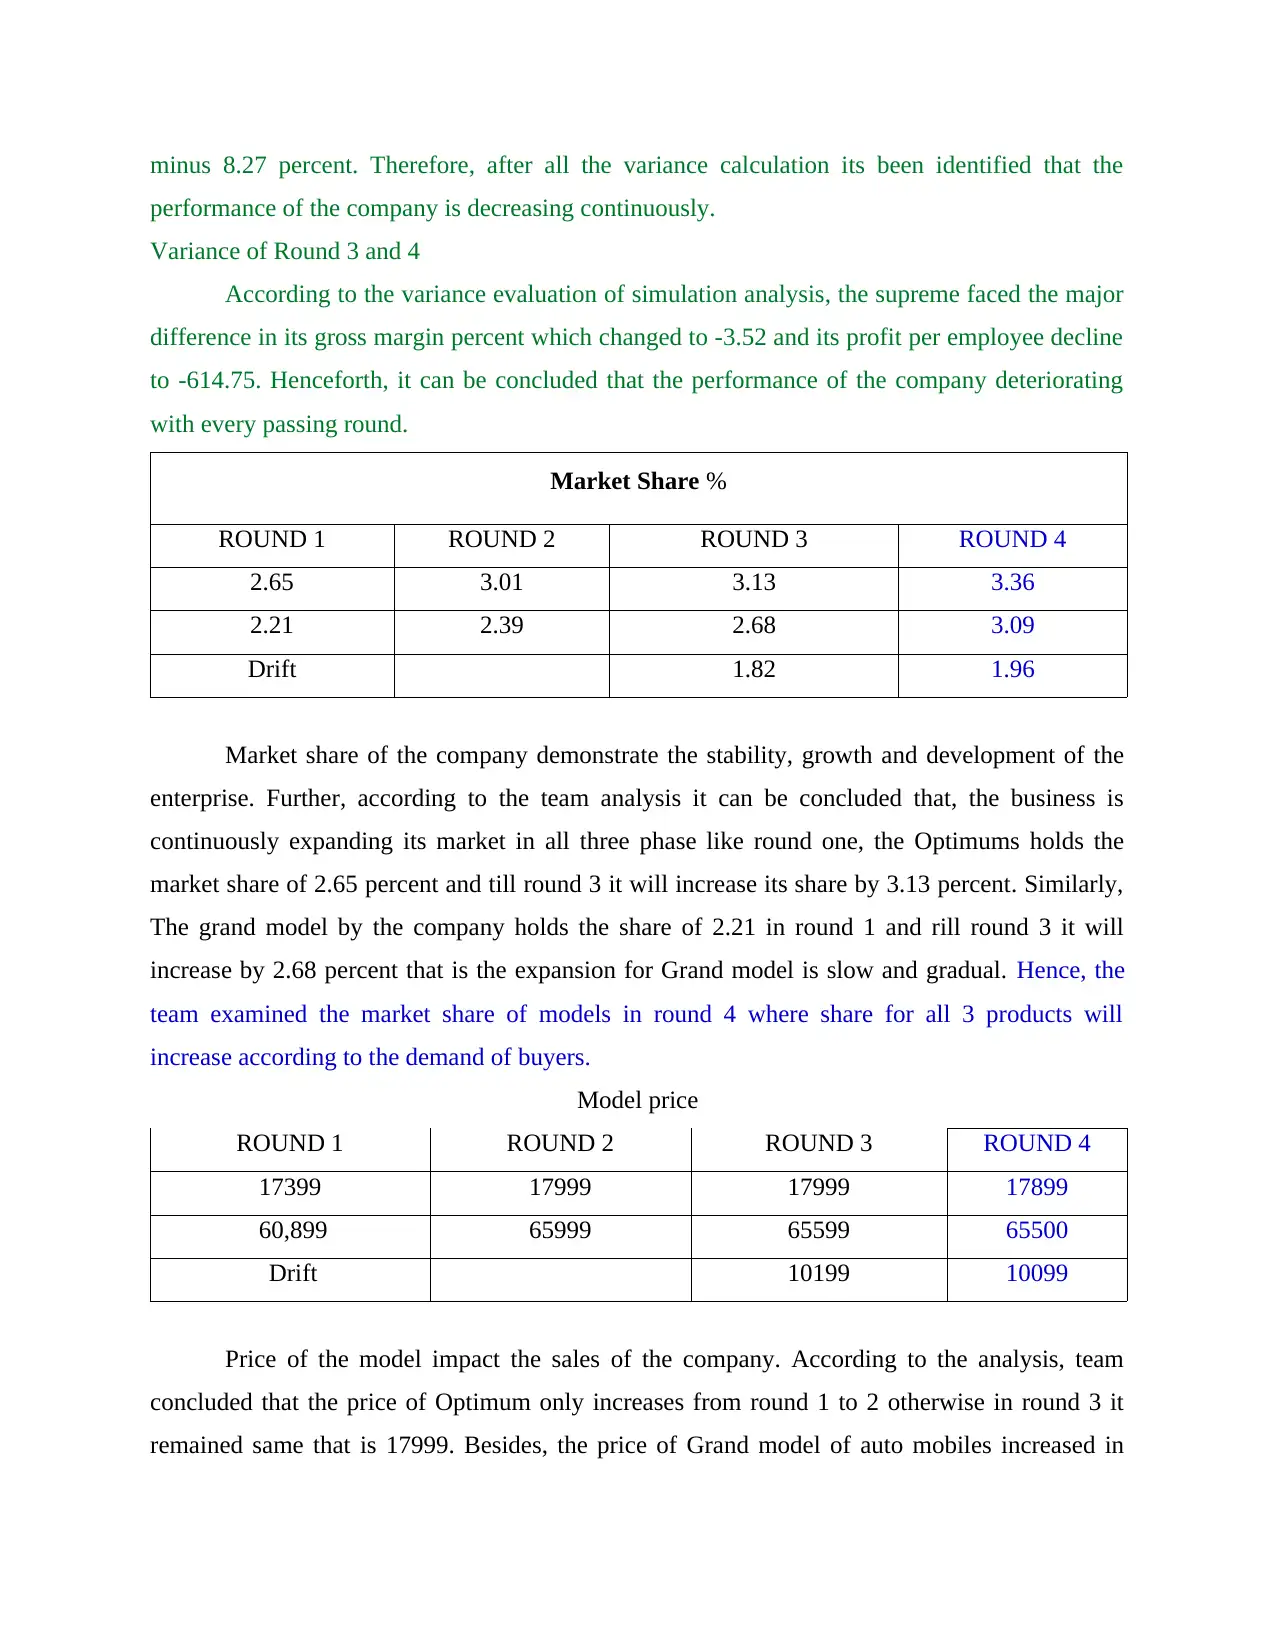
minus 8.27 percent. Therefore, after all the variance calculation its been identified that the
performance of the company is decreasing continuously.
Variance of Round 3 and 4
According to the variance evaluation of simulation analysis, the supreme faced the major
difference in its gross margin percent which changed to -3.52 and its profit per employee decline
to -614.75. Henceforth, it can be concluded that the performance of the company deteriorating
with every passing round.
Market Share %
ROUND 1 ROUND 2 ROUND 3 ROUND 4
2.65 3.01 3.13 3.36
2.21 2.39 2.68 3.09
Drift 1.82 1.96
Market share of the company demonstrate the stability, growth and development of the
enterprise. Further, according to the team analysis it can be concluded that, the business is
continuously expanding its market in all three phase like round one, the Optimums holds the
market share of 2.65 percent and till round 3 it will increase its share by 3.13 percent. Similarly,
The grand model by the company holds the share of 2.21 in round 1 and rill round 3 it will
increase by 2.68 percent that is the expansion for Grand model is slow and gradual. Hence, the
team examined the market share of models in round 4 where share for all 3 products will
increase according to the demand of buyers.
Model price
ROUND 1 ROUND 2 ROUND 3 ROUND 4
17399 17999 17999 17899
60,899 65999 65599 65500
Drift 10199 10099
Price of the model impact the sales of the company. According to the analysis, team
concluded that the price of Optimum only increases from round 1 to 2 otherwise in round 3 it
remained same that is 17999. Besides, the price of Grand model of auto mobiles increased in
⊘ This is a preview!⊘
Do you want full access?
Subscribe today to unlock all pages.
Trusted by 1+ million students worldwide
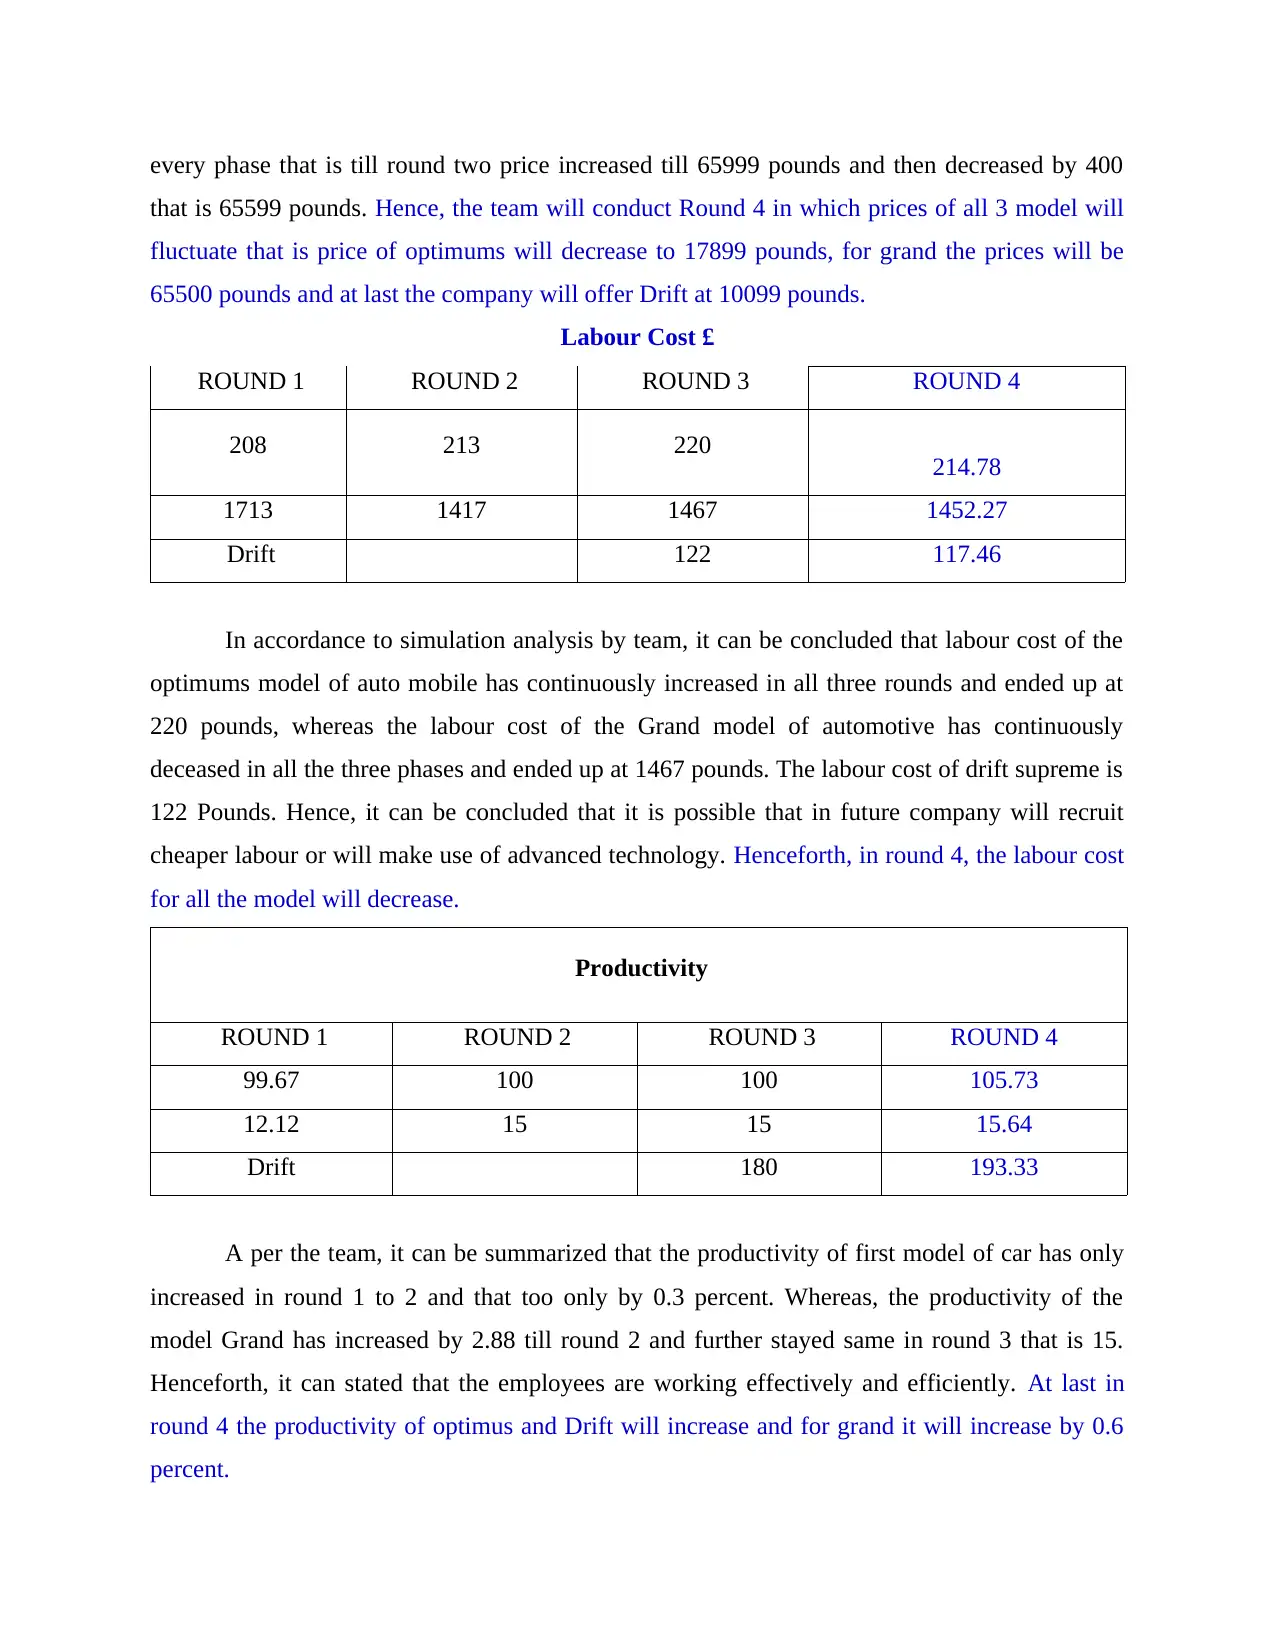
every phase that is till round two price increased till 65999 pounds and then decreased by 400
that is 65599 pounds. Hence, the team will conduct Round 4 in which prices of all 3 model will
fluctuate that is price of optimums will decrease to 17899 pounds, for grand the prices will be
65500 pounds and at last the company will offer Drift at 10099 pounds.
Labour Cost £
ROUND 1 ROUND 2 ROUND 3 ROUND 4
208 213 220 214.78
1713 1417 1467 1452.27
Drift 122 117.46
In accordance to simulation analysis by team, it can be concluded that labour cost of the
optimums model of auto mobile has continuously increased in all three rounds and ended up at
220 pounds, whereas the labour cost of the Grand model of automotive has continuously
deceased in all the three phases and ended up at 1467 pounds. The labour cost of drift supreme is
122 Pounds. Hence, it can be concluded that it is possible that in future company will recruit
cheaper labour or will make use of advanced technology. Henceforth, in round 4, the labour cost
for all the model will decrease.
Productivity
ROUND 1 ROUND 2 ROUND 3 ROUND 4
99.67 100 100 105.73
12.12 15 15 15.64
Drift 180 193.33
A per the team, it can be summarized that the productivity of first model of car has only
increased in round 1 to 2 and that too only by 0.3 percent. Whereas, the productivity of the
model Grand has increased by 2.88 till round 2 and further stayed same in round 3 that is 15.
Henceforth, it can stated that the employees are working effectively and efficiently. At last in
round 4 the productivity of optimus and Drift will increase and for grand it will increase by 0.6
percent.
Paraphrase This Document
Need a fresh take? Get an instant paraphrase of this document with our AI Paraphraser
Design and Options Cost £
ROUND 1 ROUND 2 ROUND 3 ROUND 4
3888 4195 4065 4161.46
15988 16073 15031 16073.41
Drift 1431 1526.1
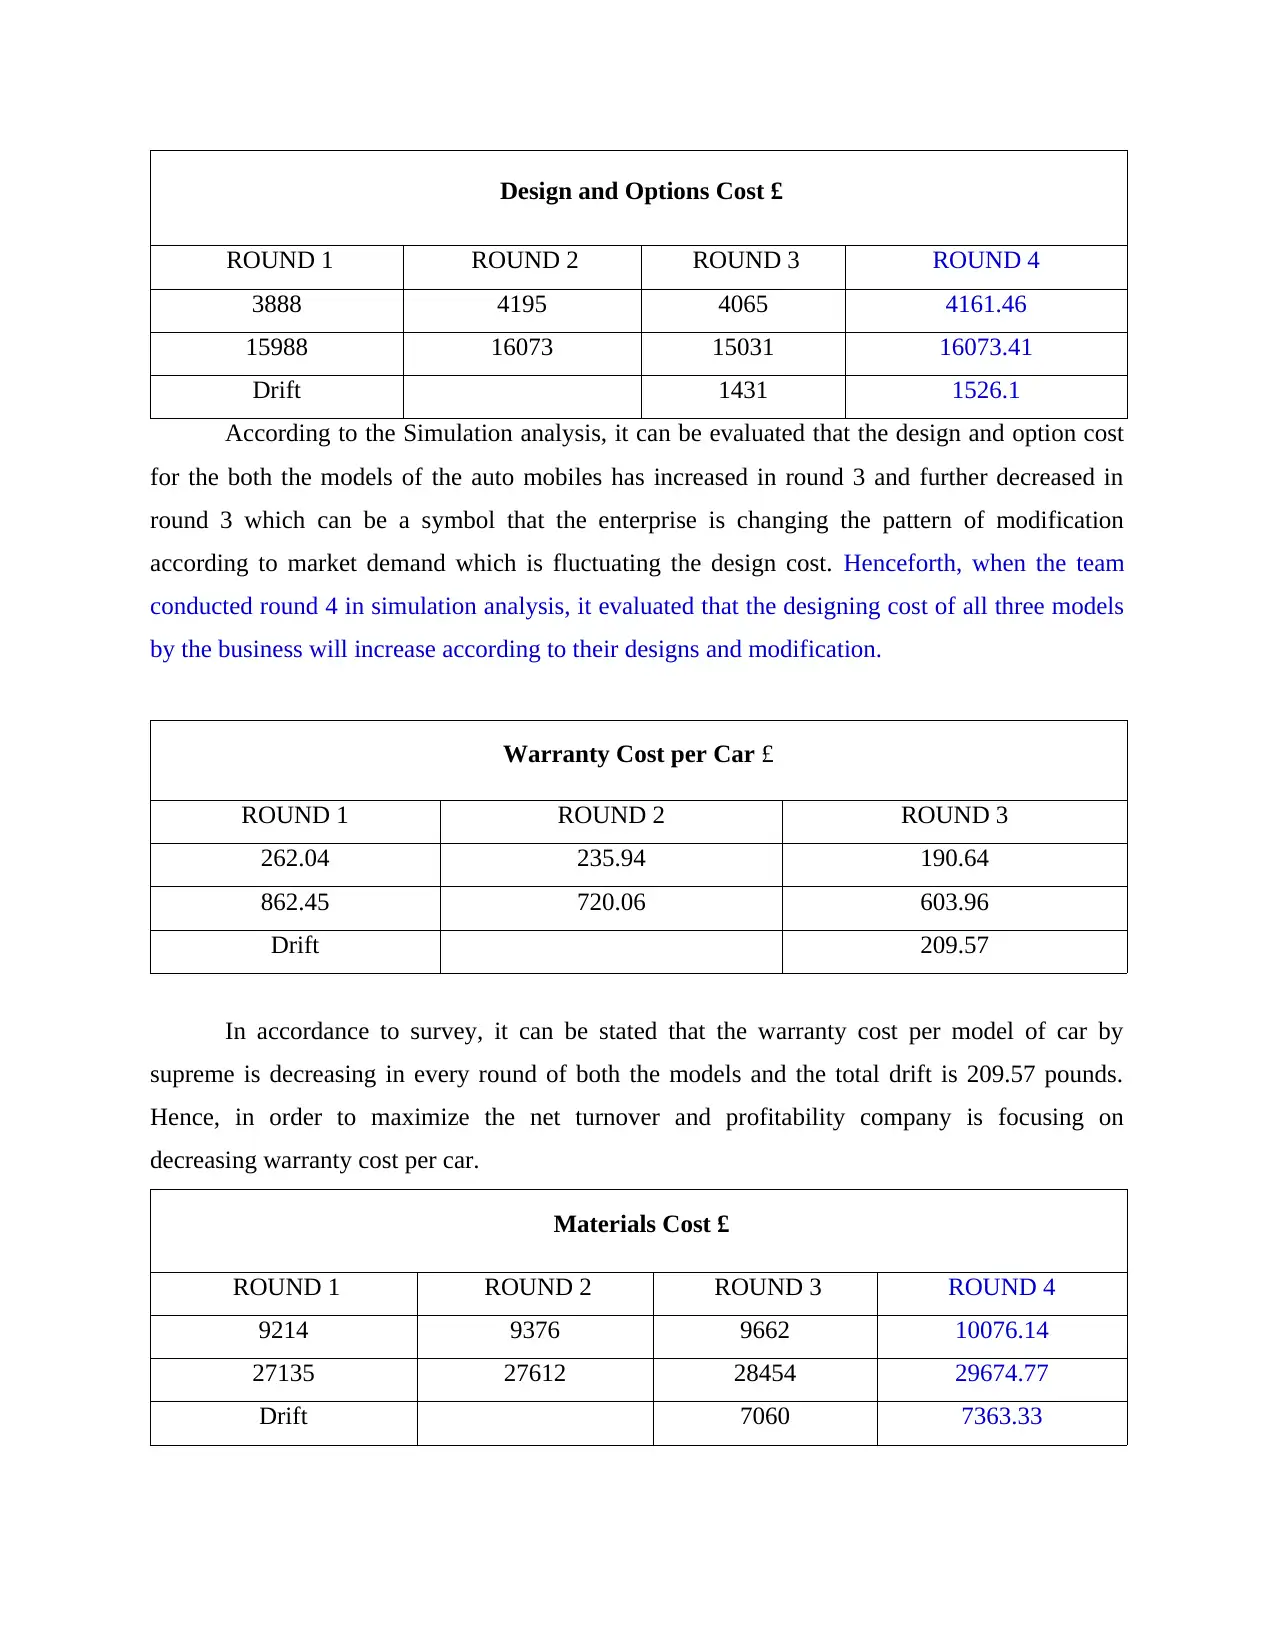
According to the Simulation analysis, it can be evaluated that the design and option cost
for the both the models of the auto mobiles has increased in round 3 and further decreased in
round 3 which can be a symbol that the enterprise is changing the pattern of modification
according to market demand which is fluctuating the design cost. Henceforth, when the team
conducted round 4 in simulation analysis, it evaluated that the designing cost of all three models
by the business will increase according to their designs and modification.
Warranty Cost per Car £
ROUND 1 ROUND 2 ROUND 3
262.04 235.94 190.64
862.45 720.06 603.96
Drift 209.57
In accordance to survey, it can be stated that the warranty cost per model of car by
supreme is decreasing in every round of both the models and the total drift is 209.57 pounds.
Hence, in order to maximize the net turnover and profitability company is focusing on
decreasing warranty cost per car.
Materials Cost £
ROUND 1 ROUND 2 ROUND 3 ROUND 4
9214 9376 9662 10076.14
27135 27612 28454 29674.77
Drift 7060 7363.33
ROUND 1 ROUND 2 ROUND 3 ROUND 4
3888 4195 4065 4161.46
15988 16073 15031 16073.41
Drift 1431 1526.1
According to the Simulation analysis, it can be evaluated that the design and option cost
for the both the models of the auto mobiles has increased in round 3 and further decreased in
round 3 which can be a symbol that the enterprise is changing the pattern of modification
according to market demand which is fluctuating the design cost. Henceforth, when the team
conducted round 4 in simulation analysis, it evaluated that the designing cost of all three models
by the business will increase according to their designs and modification.
Warranty Cost per Car £
ROUND 1 ROUND 2 ROUND 3
262.04 235.94 190.64
862.45 720.06 603.96
Drift 209.57
In accordance to survey, it can be stated that the warranty cost per model of car by
supreme is decreasing in every round of both the models and the total drift is 209.57 pounds.
Hence, in order to maximize the net turnover and profitability company is focusing on
decreasing warranty cost per car.
Materials Cost £
ROUND 1 ROUND 2 ROUND 3 ROUND 4
9214 9376 9662 10076.14
27135 27612 28454 29674.77
Drift 7060 7363.33
As-per the team survey by simulation analysis, the material cost of the both the models
has increased in all 3 rounds but there is a major difference in the material cost of both the
models that is Optimums model by Supreme has material cost of 9214 pounds which has
increased till 9662 pounds till round 3 whereas the material cost of grand model of the auto
mobile is 27135 pounds in round 1 and till round 1 it increases to 28454 which demonstrate that
the company should focus on decreasing the investment cost of Grand model in order to have
stable profitable growth. Henceforth, according to team evaluation of round 4, the organisation
concluded that material cost of all three models by Supreme will increase.
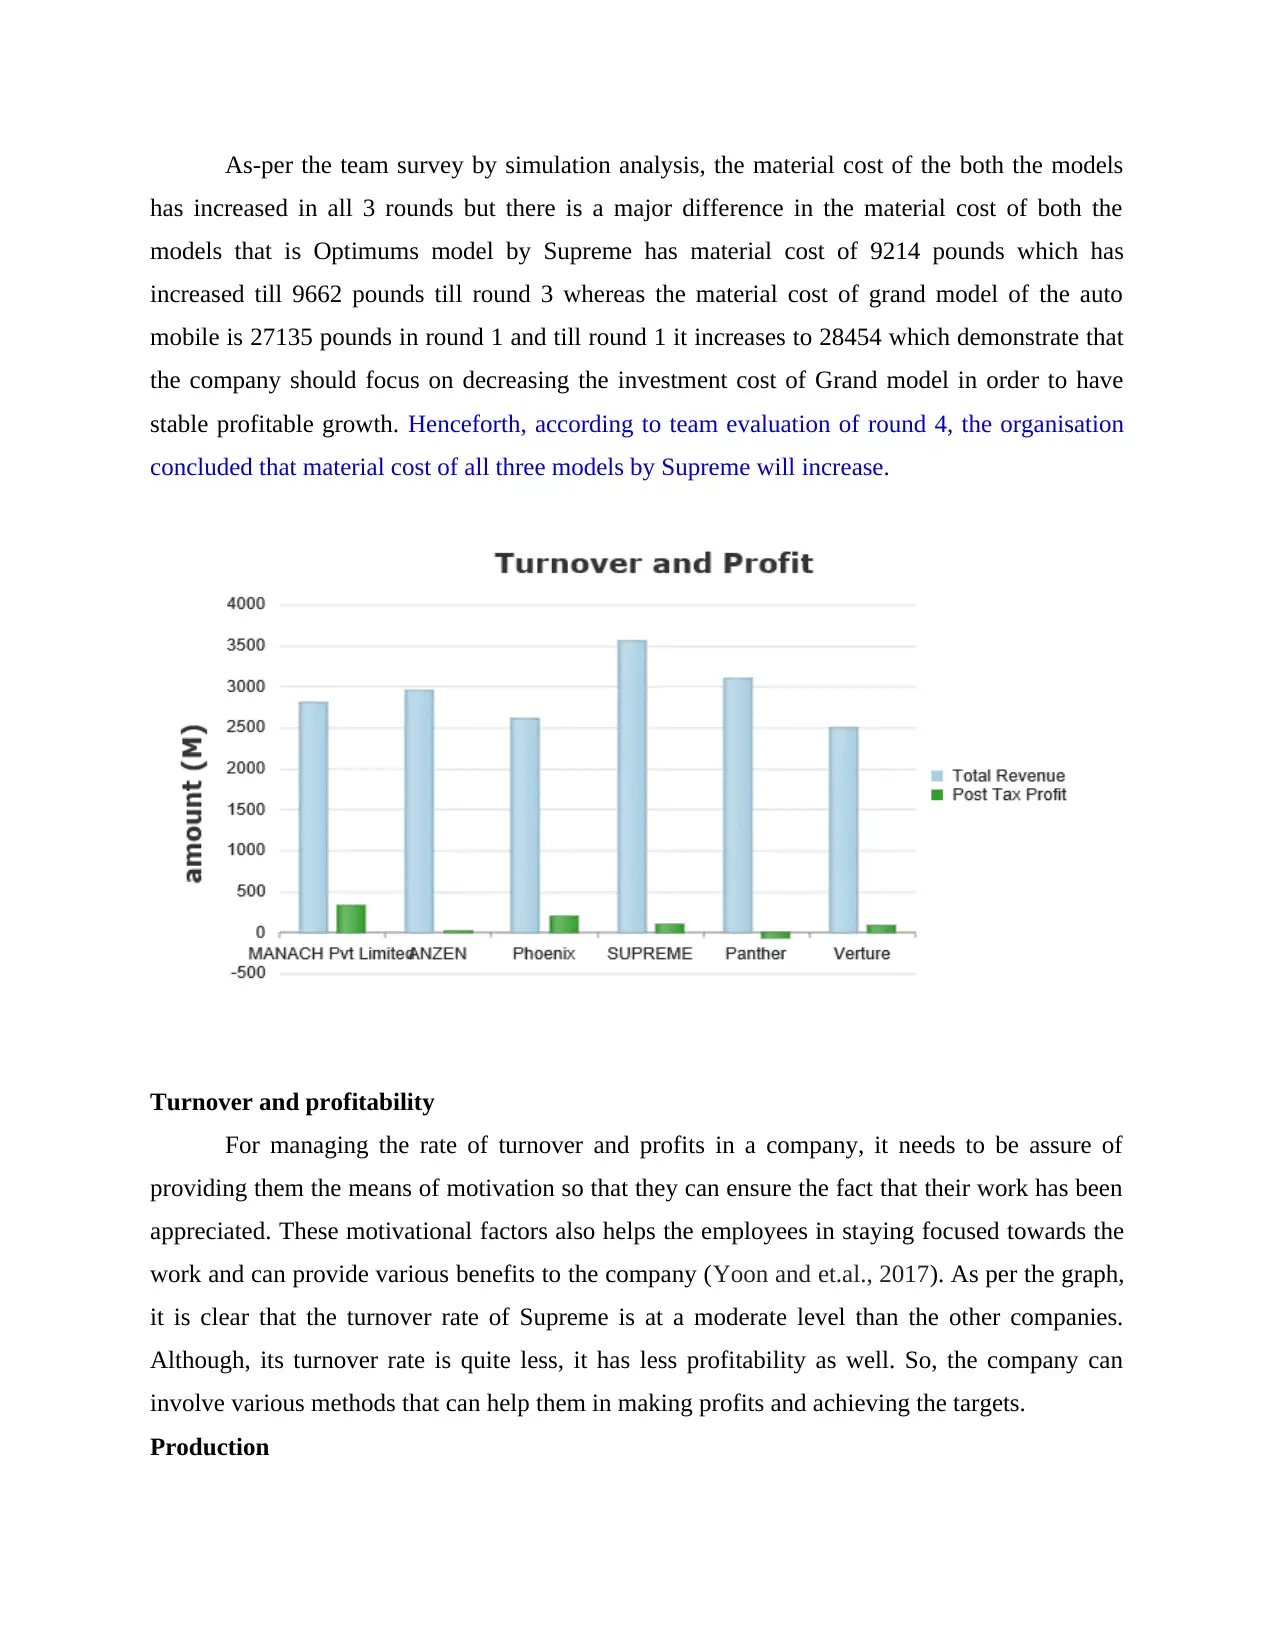
Turnover and profitability
For managing the rate of turnover and profits in a company, it needs to be assure of
providing them the means of motivation so that they can ensure the fact that their work has been
appreciated. These motivational factors also helps the employees in staying focused towards the
work and can provide various benefits to the company (Yoon and et.al., 2017). As per the graph,
it is clear that the turnover rate of Supreme is at a moderate level than the other companies.
Although, its turnover rate is quite less, it has less profitability as well. So, the company can
involve various methods that can help them in making profits and achieving the targets.
Production
has increased in all 3 rounds but there is a major difference in the material cost of both the
models that is Optimums model by Supreme has material cost of 9214 pounds which has
increased till 9662 pounds till round 3 whereas the material cost of grand model of the auto
mobile is 27135 pounds in round 1 and till round 1 it increases to 28454 which demonstrate that
the company should focus on decreasing the investment cost of Grand model in order to have
stable profitable growth. Henceforth, according to team evaluation of round 4, the organisation
concluded that material cost of all three models by Supreme will increase.
Turnover and profitability
For managing the rate of turnover and profits in a company, it needs to be assure of
providing them the means of motivation so that they can ensure the fact that their work has been
appreciated. These motivational factors also helps the employees in staying focused towards the
work and can provide various benefits to the company (Yoon and et.al., 2017). As per the graph,
it is clear that the turnover rate of Supreme is at a moderate level than the other companies.
Although, its turnover rate is quite less, it has less profitability as well. So, the company can
involve various methods that can help them in making profits and achieving the targets.
Production
⊘ This is a preview!⊘
Do you want full access?
Subscribe today to unlock all pages.
Trusted by 1+ million students worldwide
1 out of 23
Related Documents


Your All-in-One AI-Powered Toolkit for Academic Success.
+13062052269
info@desklib.com
Available 24*7 on WhatsApp / Email
![[object Object]](/_next/static/media/star-bottom.7253800d.svg)
Unlock your academic potential
Copyright © 2020–2026 A2Z Services. All Rights Reserved. Developed and managed by ZUCOL.