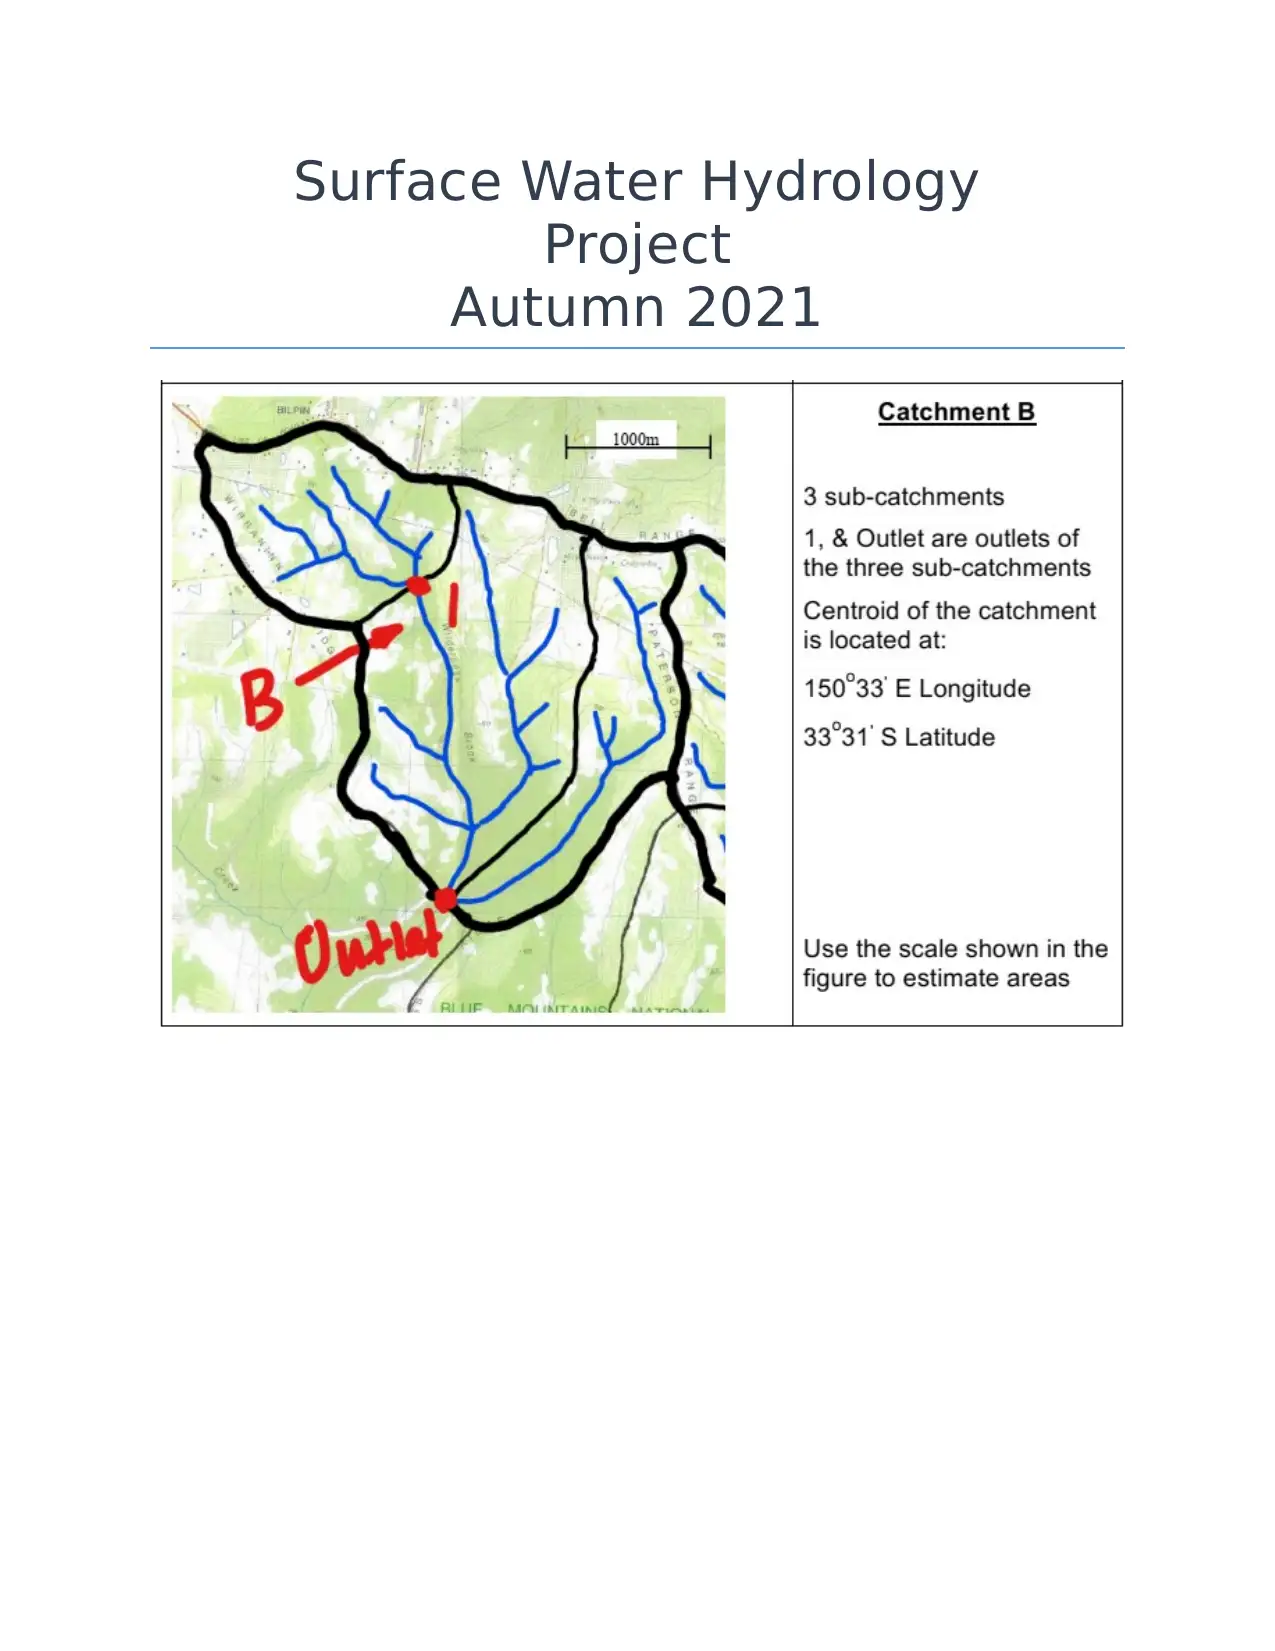
Surface Water Hydrology Project Autumn 2021: Catchment B Analysis

Verified

Added on  2021/06/12

|34
|746
|93
Project
AI Summary
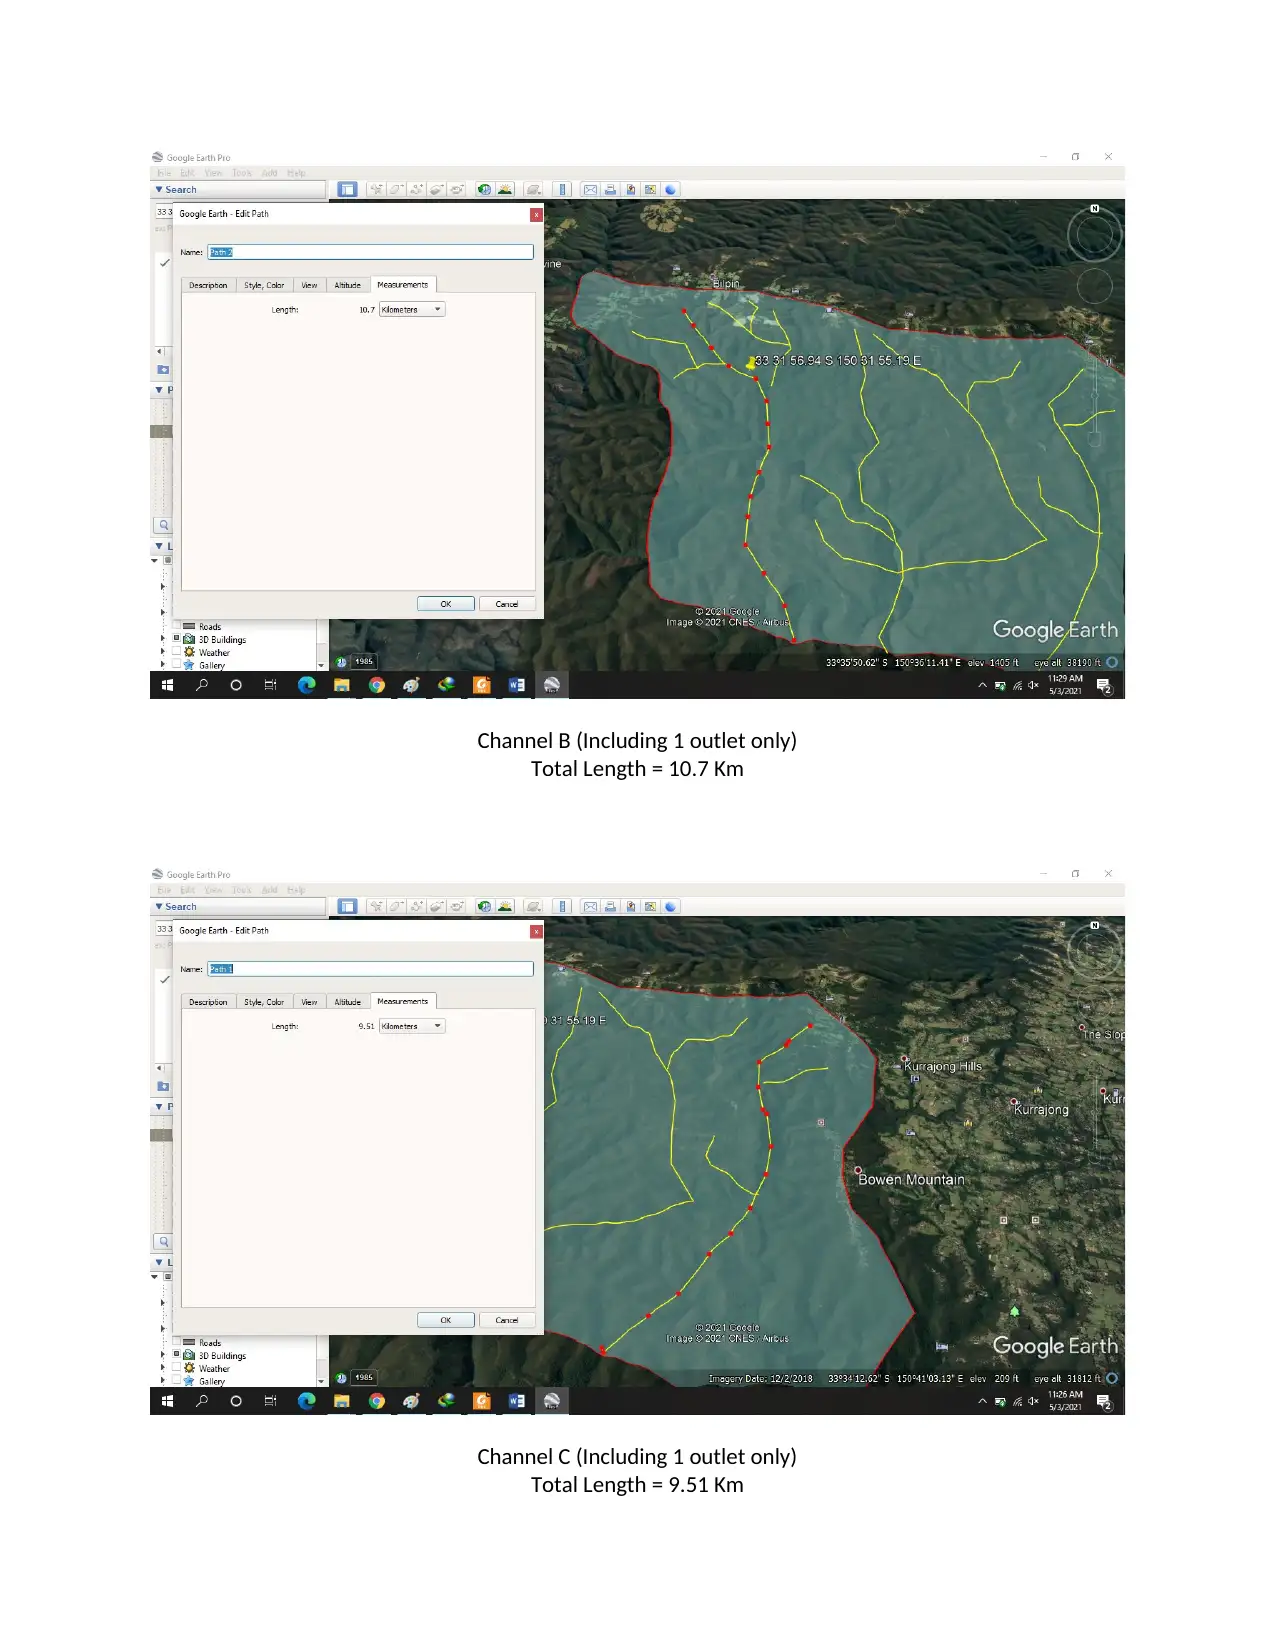
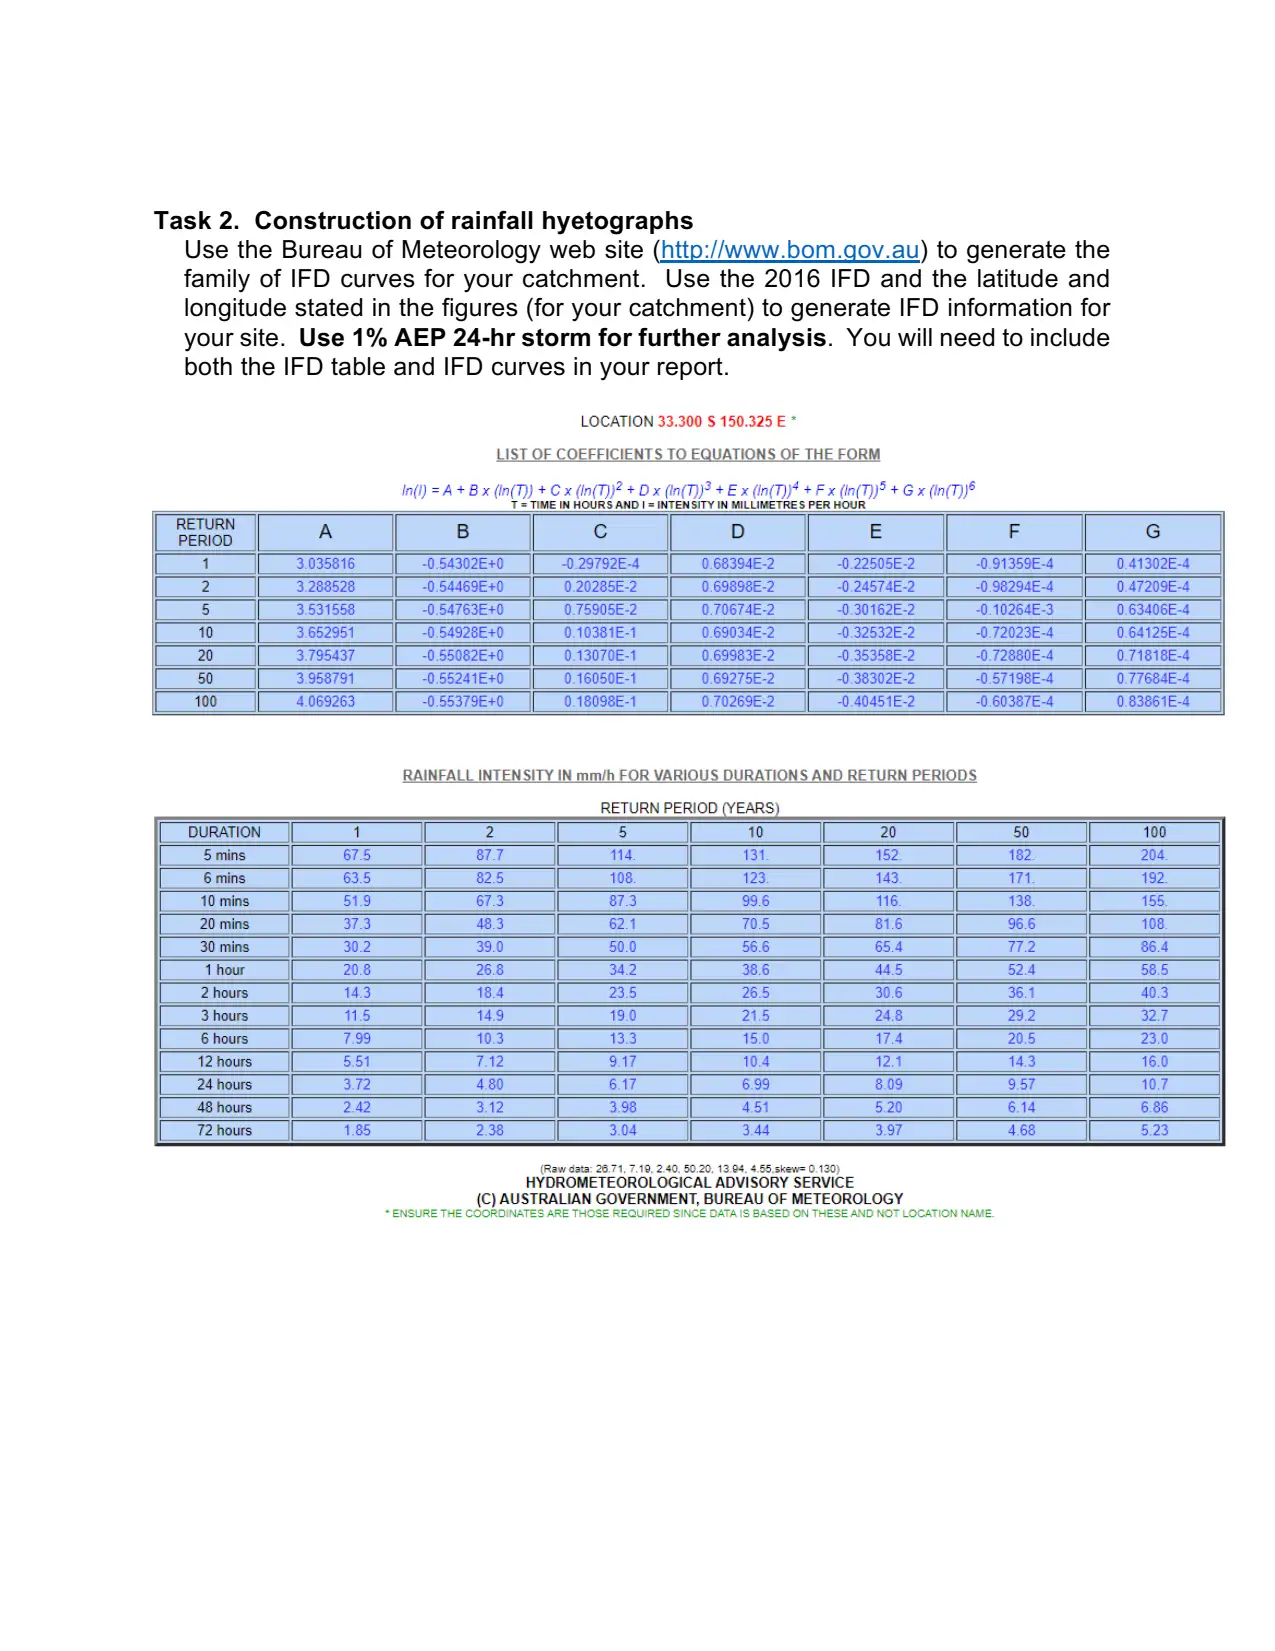
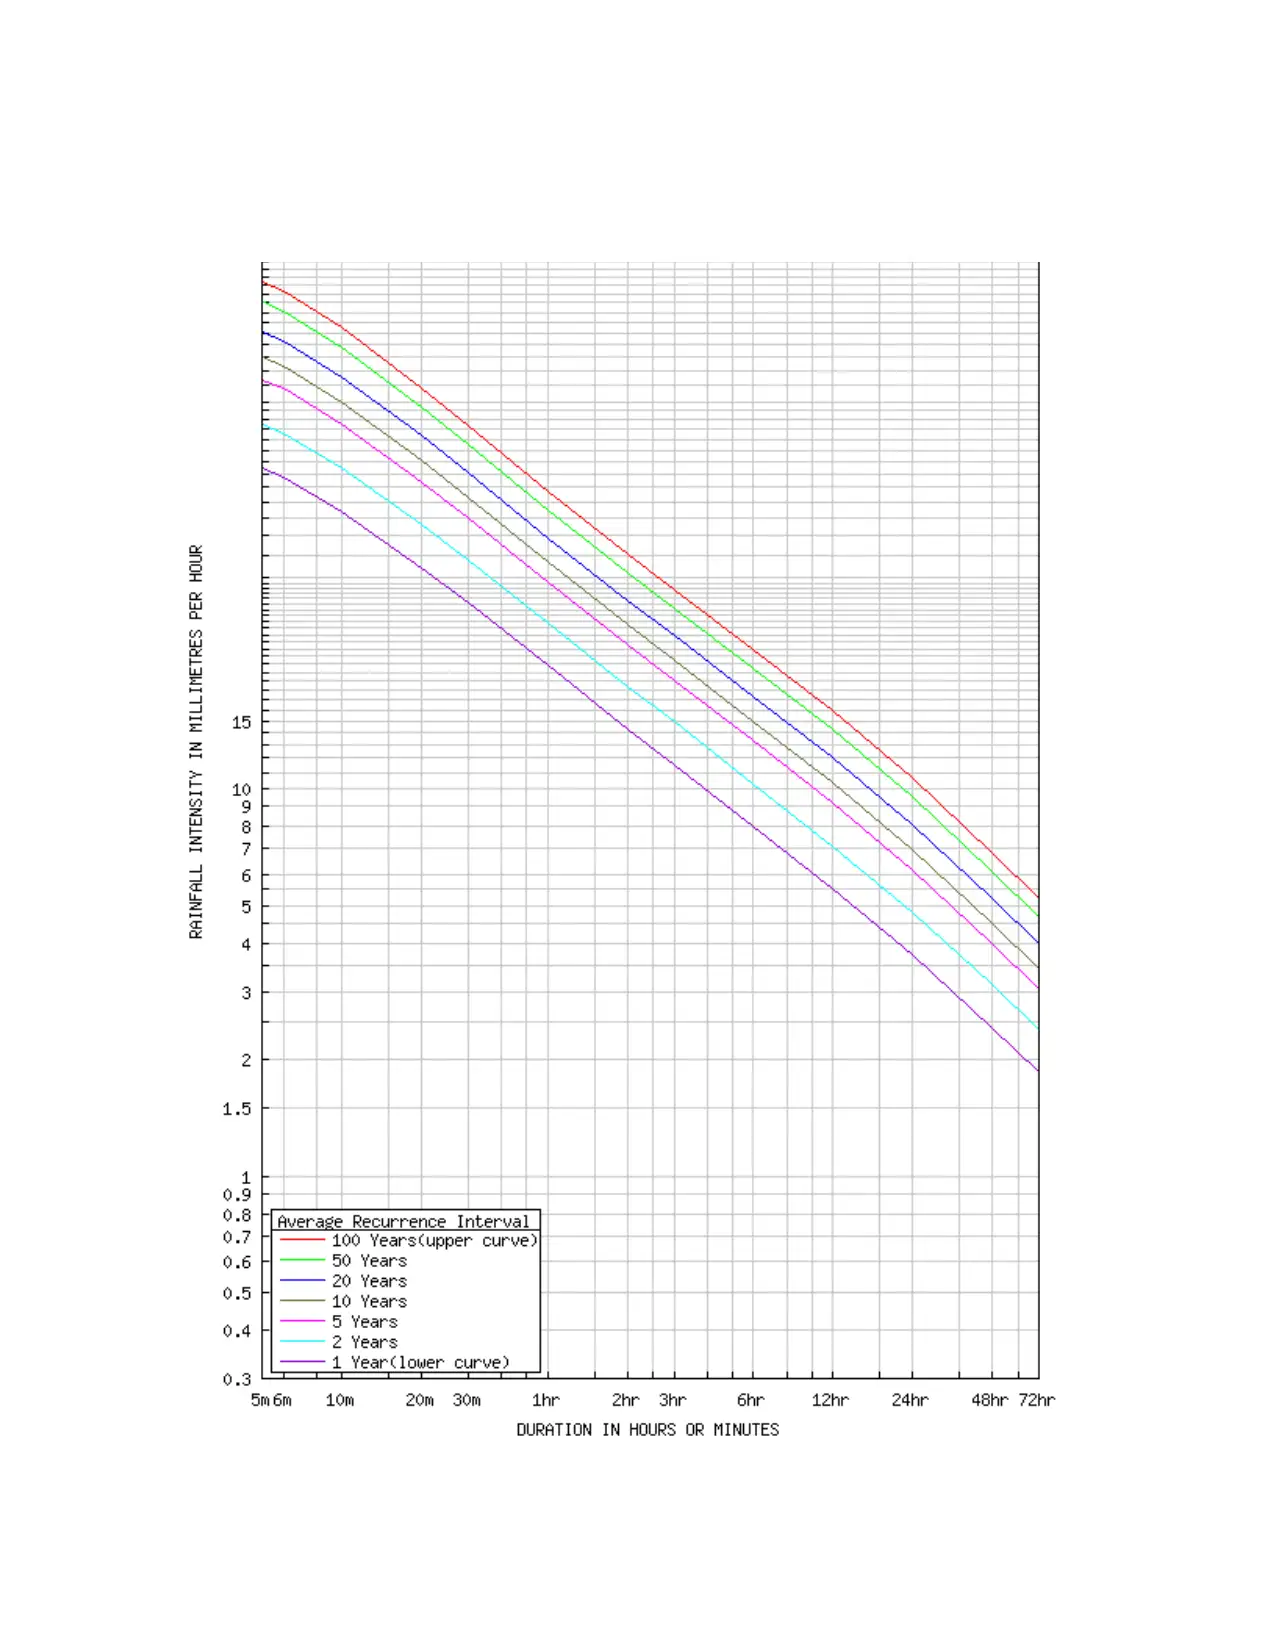
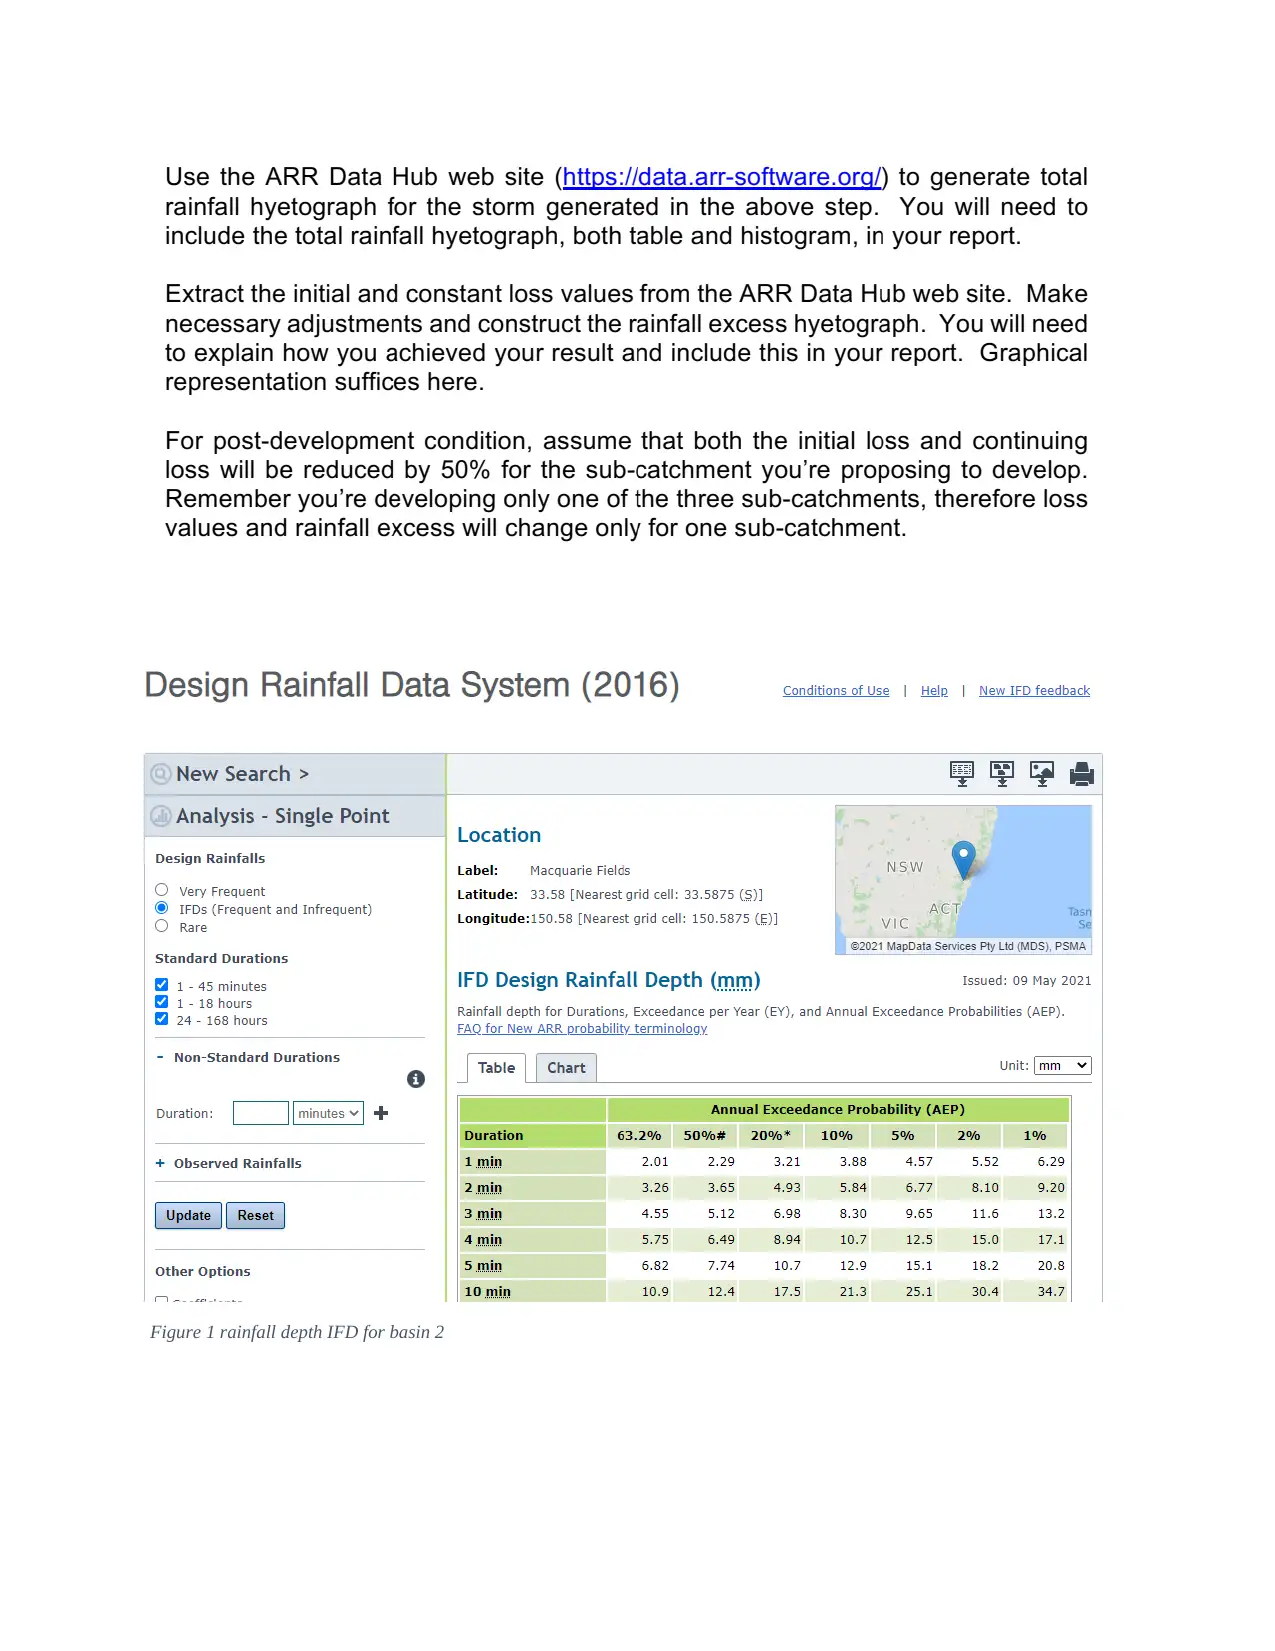
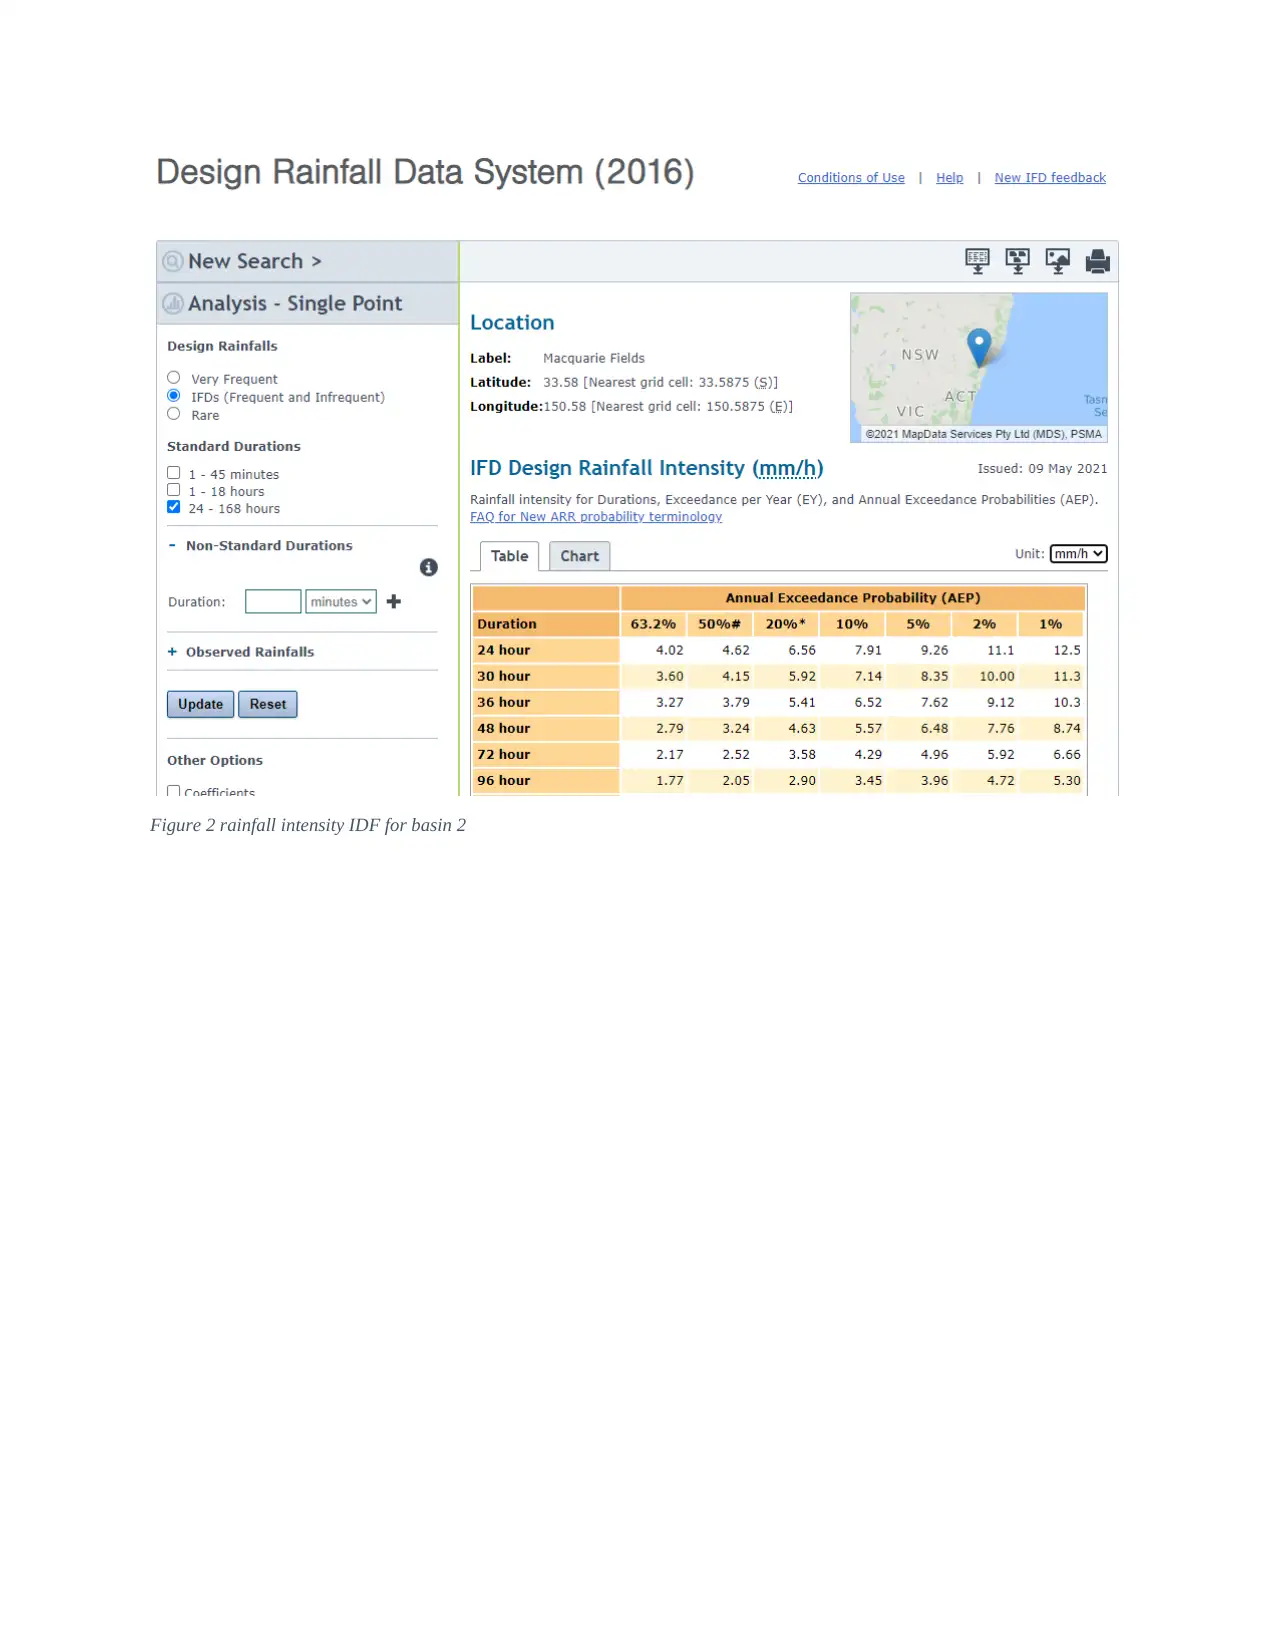
This Surface Water Hydrology Project, conducted in Autumn 2021, focuses on the analysis of Catchment B near Macquarie Field. The project begins with the allocation and physical parameter estimation of the basin, calculating the area and channel lengths. It then delves into rainfall intensity and depth calculations using IDF curves and AEP. The core of the project involves the application of the Unit Hydrograph method to predict flood hydrographs, supported by detailed calculations and Excel sheets. The Muskingum routing method is utilized to analyze flow, with step-by-step calculations of routing parameters and discharge. Furthermore, the project includes HEC-HMS files to verify calculations and present the storm hydrograph. The project concludes with results, conclusions, and recommendations, emphasizing the importance of advanced learning models and computational simulations for future improvements. The project provides a comprehensive analysis of the catchment, incorporating various hydrological methods and tools.
Document Page
Surface Water Hydrology
Project
Autumn 2021
tabler-icon-diamond-filled.svg

Paraphrase This Document

Need a fresh take? Get an instant paraphrase of this document with our AI Paraphraser
Document Page
INTRODUCTION
PHYSICAL PARAMETERS ESTIMATION.
Allocation of basin/watershed.
The Catchment assigned to me according to my Roll No. was Catchment B, this Catchment B is
situated near Macquarie Field, Picnic Point area has a centroid situated at 33 o 358 S latitude and
150 o 35 E longitude.
Using Approximation 1000m
We can convert the said Catchment area as
Document Page
1 - Area of the Sub-Catchment
Sub-Catchment Area
1 2.89 Km2
2 5.85 Km2
3 3.36 Km2
Total 12.1 KM2
2 – Total Area of the Catchment-B
Document Page
121 Square Kilometer = 12.1 Square Kilometer as per Given Approximation
Similarly, Area calculated as 12.1 Km2
3 – Length of Channels
Length of Channel as
Channel A (Including 1 and 2 outlet)
Total Length = 9.83 Km
tabler-icon-diamond-filled.svg

Paraphrase This Document

Need a fresh take? Get an instant paraphrase of this document with our AI Paraphraser
Document Page
Channel B (Including 1 outlet only)
Total Length = 10.7 Km
Channel C (Including 1 outlet only)
Total Length = 9.51 Km
Document Page
Document Page
tabler-icon-diamond-filled.svg

Paraphrase This Document

Need a fresh take? Get an instant paraphrase of this document with our AI Paraphraser
Document Page
Figure 1 rainfall depth IFD for basin 2
Document Page
Figure 2 rainfall intensity IDF for basin 2
Document Page
Figure 3 Rainfall depth (mm) chart
tabler-icon-diamond-filled.svg

Paraphrase This Document

Need a fresh take? Get an instant paraphrase of this document with our AI Paraphraser
Document Page
Figure 4 Rainfall intensity (mm/hr) chart
Document Page
Relationship used here is
AEP = 1e( 1
ARI )
AEP = 1e(1
10 )
= 1-0.90483 =0.095*100 = 9.5%
chevron_up_icon
1 out of 34
circle_padding
hide_on_mobile
zoom_out_icon
[object Object]