Surface Water Hydrology Assignment 2 Solution - ENGIN5201, 2019
VerifiedAdded on 2022/11/14
|6
|361
|27
Homework Assignment
AI Summary
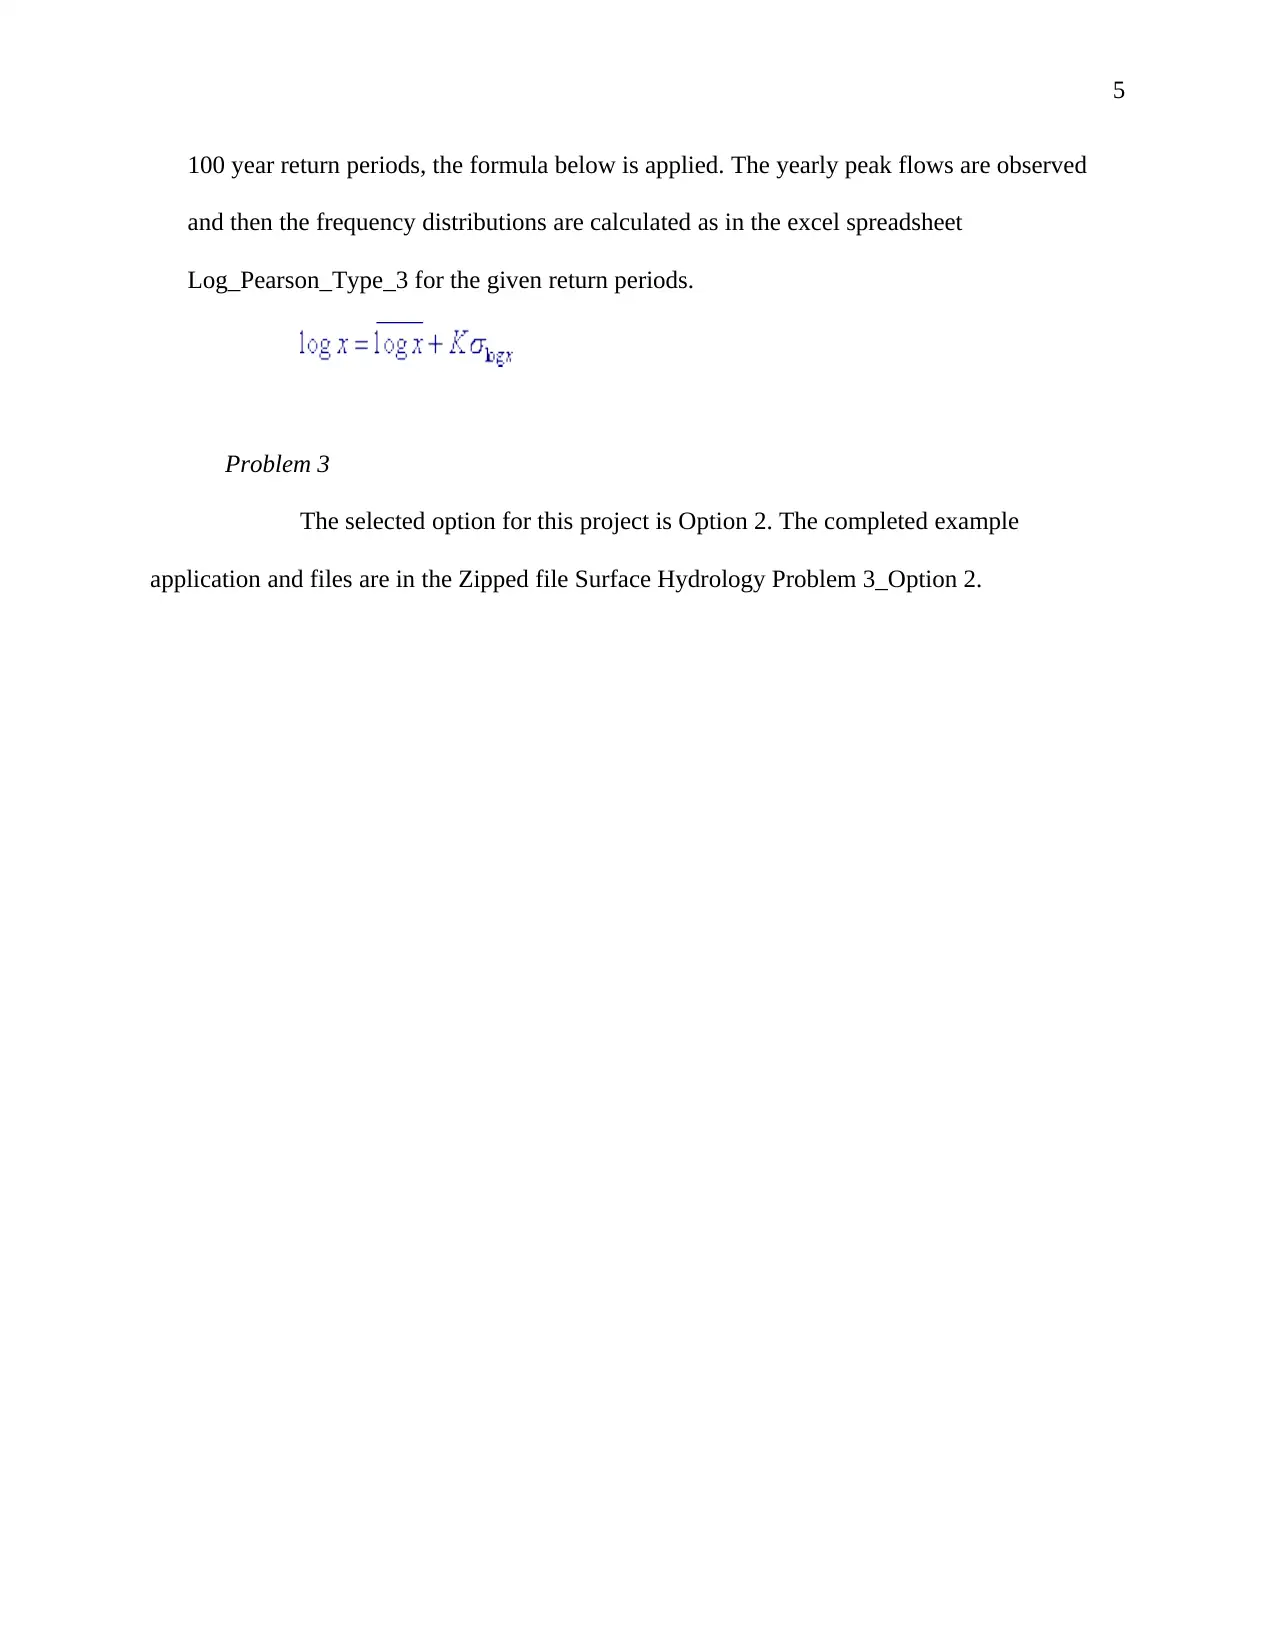
This document presents a comprehensive solution to a Surface Water Hydrology assignment (ENGIN5201). The assignment focuses on analyzing streamflow data from the Murray River. The solution includes identifying and describing the river's location, downloading and processing daily streamflow data, generating statistical summaries (daily, monthly, seasonal, and annual), and creating frequency plots using log scales. The document also demonstrates the application of the Log-Pearson Type III distribution to calculate flood frequency distributions for various return periods. Finally, the solution includes the completed example application files as required by the assignment brief. The analysis covers key aspects of hydrological modeling and data interpretation.

1 out of 6
Related Documents


Your All-in-One AI-Powered Toolkit for Academic Success.
+13062052269
info@desklib.com
Available 24*7 on WhatsApp / Email
![[object Object]](/_next/static/media/star-bottom.7253800d.svg)
Copyright © 2020–2026 A2Z Services. All Rights Reserved. Developed and managed by ZUCOL.