University Health: Survival Analysis Homework - Problem Solutions
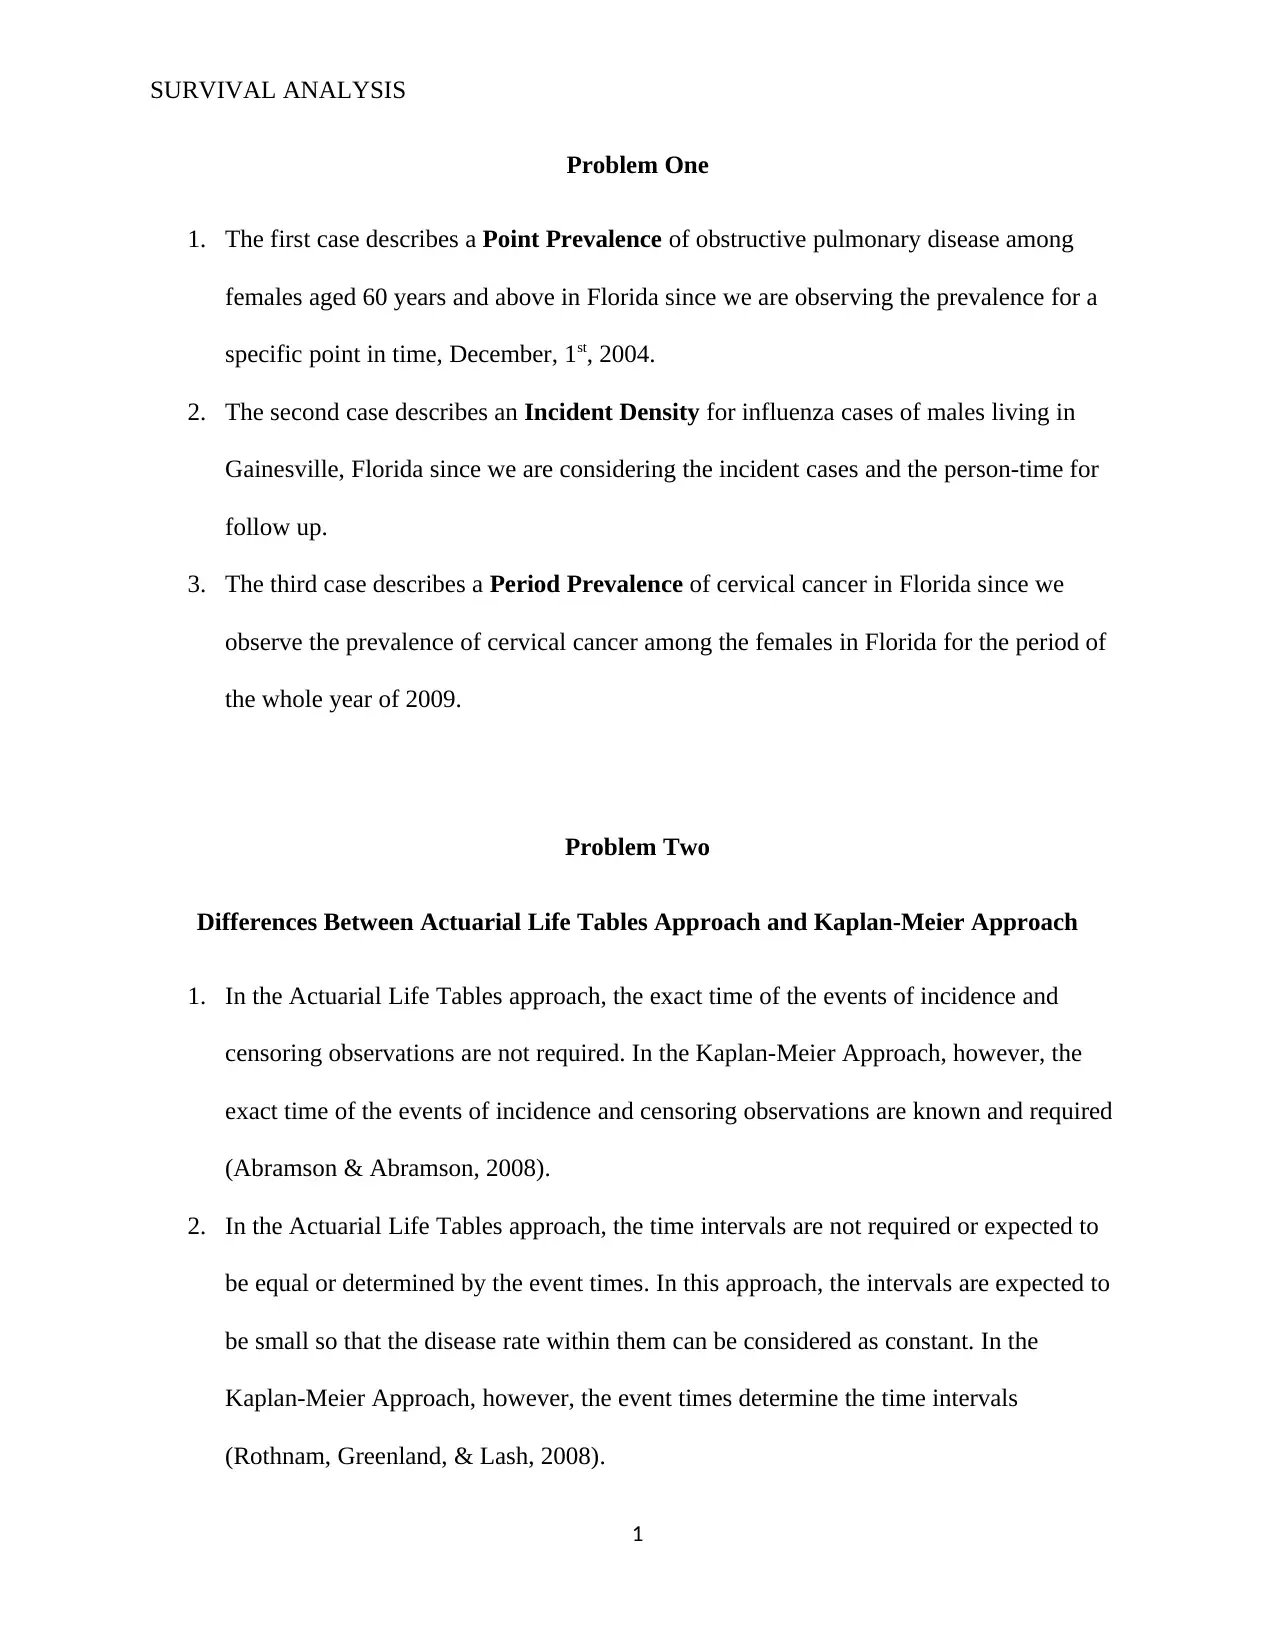
VerifiedAdded on 2023/04/23
|7
|1136
|298
Homework Assignment
AI Summary
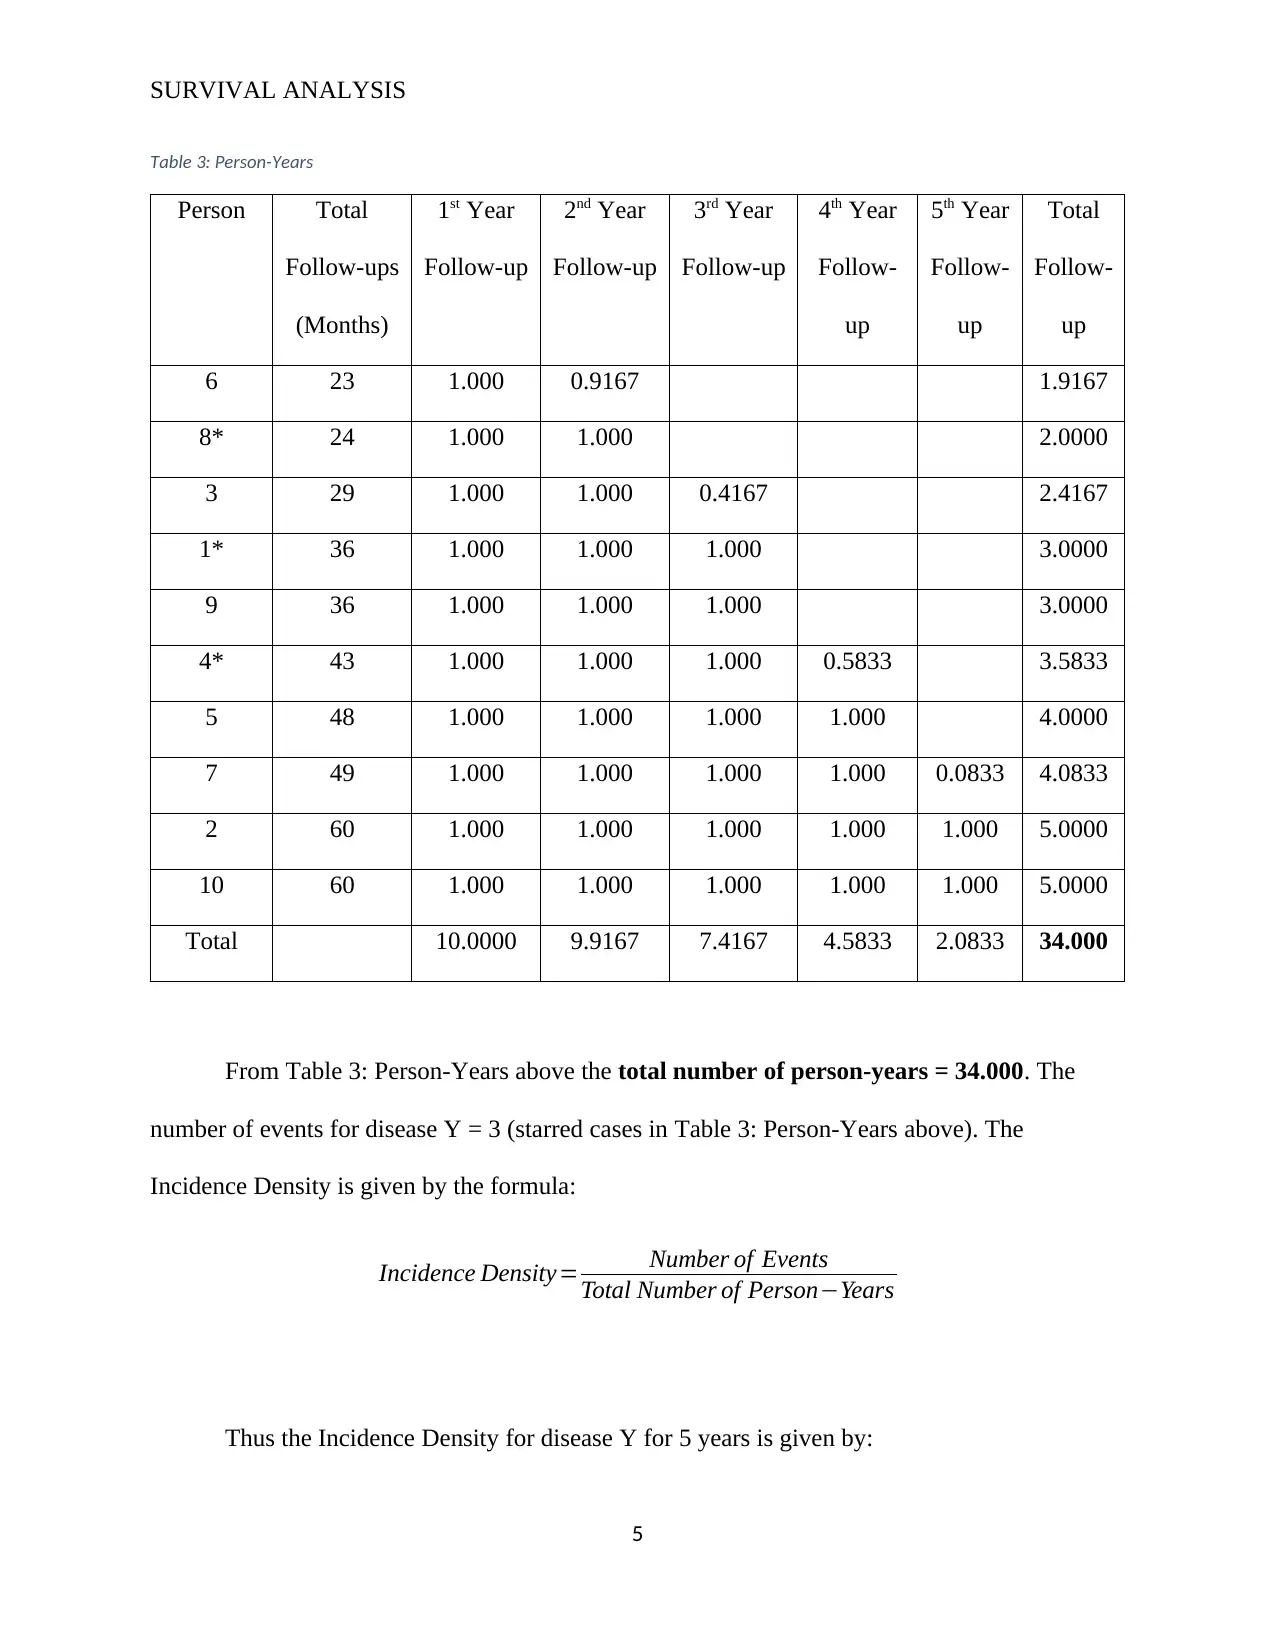
This homework assignment provides solutions to problems related to survival analysis. The first problem defines and differentiates between various measures of disease occurrence such as point prevalence, incidence density, and period prevalence. The second problem explores the differences between Actuarial Life Tables and the Kaplan-Meier approach, highlighting their assumptions. The third problem involves calculations using both Actuarial Life Tables and Kaplan-Meier methods, including the determination of cumulative probabilities of survival and event occurrence. The fourth problem focuses on calculating incidence density using person-years data. The assignment offers detailed calculations and interpretations, making it a valuable resource for understanding survival analysis in public health.

SURVIVAL ANALYSIS
Problem One
1. The first case describes a Point Prevalence of obstructive pulmonary disease among
females aged 60 years and above in Florida since we are observing the prevalence for a
specific point in time, December, 1st, 2004.
2. The second case describes an Incident Density for influenza cases of males living in
Gainesville, Florida since we are considering the incident cases and the person-time for
follow up.
3. The third case describes a Period Prevalence of cervical cancer in Florida since we
observe the prevalence of cervical cancer among the females in Florida for the period of
the whole year of 2009.
Problem Two
Differences Between Actuarial Life Tables Approach and Kaplan-Meier Approach
1. In the Actuarial Life Tables approach, the exact time of the events of incidence and
censoring observations are not required. In the Kaplan-Meier Approach, however, the
exact time of the events of incidence and censoring observations are known and required
(Abramson & Abramson, 2008).
2. In the Actuarial Life Tables approach, the time intervals are not required or expected to
be equal or determined by the event times. In this approach, the intervals are expected to
be small so that the disease rate within them can be considered as constant. In the
Kaplan-Meier Approach, however, the event times determine the time intervals
(Rothnam, Greenland, & Lash, 2008).
1
Paraphrase This Document
Need a fresh take? Get an instant paraphrase of this document with our AI Paraphraser

SURVIVAL ANALYSIS
General Assumptions of both Actuarial Life Tables Approach and Kaplan-Meier
Approach
1. It is assumed that if the recruitment period for the individuals taking part in the given
study is over a long period, then we can say that there would be no secular trends (Jones,
Rice, Bago, & Balia, 2013).
2. It is also assumed that the censoring is not dependent on the survival, hence independent
(Ann & Patty, 2016).
Problem Three
The following formulas will be used in the calculation of the Cumulative Probability of
the Event (1) and the Cumulative Probability of Survival (2) using the Actuarial Life Table
Approach:
1. No . of Cases at Risk=No . of Cases at the Start of Period−No . of Withdraws During Period
2. Conditional Probability of the Event= No . of Deaths During Period
No . of Cases at Risk
3. Conditional Probability of Survival=1−Conditional Probability of the Event
2

SURVIVAL ANALYSIS
Table 1: Solution for Actuarial Life Tables Approach
Interval
(Month
s)
J
No. of
cases
at start
of
period
No. of
deaths
during
period
No. of
withdr
aws
during
period
No. of
cases at
risk
Conditio
nal
probabilit
y of the
event
Conditio
nal
probabilit
y of
survival
Cumulat
ive
probabili
ty of
survival
(2)
Cumulat
ive
probabili
ty of the
event
(1)
[0-5] 10 2 1 9 0.2222 0.7778 0.7778 0.2222
[6-10] 7 2 1 6 0.3333 0.6667 0.5186 0.0741
[11-15] 4 3 0 4 0.7500 0.2500 0.1297 0.0556
[16-20] 1 1 0 1 1.000 0.0000 0.0000 0.0556
The table below gives the Conditional Probability of the Event, Conditional Probability
of Survival and Cumulative Probability of Survival using the Kaplan-Meier Approach for part
(3) of Problem Three.
The following equations were used to calculate the Conditional Probability of the Event,
Conditional Probability of Survival and Cumulative Probability of Survival for the table below:
1. Conditional Probability of the Event= No . of Deaths During Period
No . of Cases at Start of Period
2. Conditional Probability of Survival=1−Conditional Probability of the Event
3
⊘ This is a preview!⊘
Do you want full access?
Subscribe today to unlock all pages.

Trusted by 1+ million students worldwide

SURVIVAL ANALYSIS
Table 2: Solution for Kaplan-Meier Approach
Interval
(Month
s)
J
No. of
cases
at start
of
period
No. of
deaths
No. of
censore
d
Conditio
nal
probabili
ty of the
event
(3)
Conditio
nal
probabili
ty of
survival
(3)
Cumulat
ive
probabili
ty of
survival
(3)
Cumulati
ve
probabilit
y of the
event
0 – 3 10 1 0 0.1000 0.9000 0.9000 0.1000
4 – 5 9 1 1 0.1111 0.8889 0.8000 0.0111
6 – 7 7 1 0 0.1429 0.8571 0.6857 0.0016
8 – 10 6 1 1 0.1667 0.8333 0.5714 0.0003
11 – 12 4 1 0 0.2500 0.7500 0.4286 0.0000
13 3 1 0 0.3333 0.6667 0.2858 0.0000
14 – 15 2 1 0 0.5000 0.5000 0.1429 0.0000
16 – 20 1 1 0 1.0000 0.0000 0.0000 0.0000
Problem Four
4
Paraphrase This Document
Need a fresh take? Get an instant paraphrase of this document with our AI Paraphraser

SURVIVAL ANALYSIS
Table 3: Person-Years
Person Total
Follow-ups
(Months)
1st Year
Follow-up
2nd Year
Follow-up
3rd Year
Follow-up
4th Year
Follow-
up
5th Year
Follow-
up
Total
Follow-
up
6 23 1.000 0.9167 1.9167
8* 24 1.000 1.000 2.0000
3 29 1.000 1.000 0.4167 2.4167
1* 36 1.000 1.000 1.000 3.0000
9 36 1.000 1.000 1.000 3.0000
4* 43 1.000 1.000 1.000 0.5833 3.5833
5 48 1.000 1.000 1.000 1.000 4.0000
7 49 1.000 1.000 1.000 1.000 0.0833 4.0833
2 60 1.000 1.000 1.000 1.000 1.000 5.0000
10 60 1.000 1.000 1.000 1.000 1.000 5.0000
Total 10.0000 9.9167 7.4167 4.5833 2.0833 34.000
From Table 3: Person-Years above the total number of person-years = 34.000. The
number of events for disease Y = 3 (starred cases in Table 3: Person-Years above). The
Incidence Density is given by the formula:
Incidence Density= Number of Events
Total Number of Person−Years
Thus the Incidence Density for disease Y for 5 years is given by:
5

SURVIVAL ANALYSIS
Incidence Density for disease Y for 5 Years= 3
34.000
Incidence Density for disease Y for 5 Years=0.0882 per person year
6
Incidence Density for disease Y for 5 Years= 3
34.000
Incidence Density for disease Y for 5 Years=0.0882 per person year
6
⊘ This is a preview!⊘
Do you want full access?
Subscribe today to unlock all pages.

Trusted by 1+ million students worldwide

SURVIVAL ANALYSIS
References
Abramson, J. H., & Abramson, Z. H. (2008). Research Methods in Community Medicine:
Surveys, Epidemiology Research, Programme Evaluation, Clinical Trials. 6th Edition.
Chichester, England: Hoboken, N.J., Wiley.
Ann, C. L., & Patty, V. A. (2016). Population-Based Nursing [Electronic Resource]: Cocepts
and Competencies for Advanced Practice 2nd Edition. New York: Springer Publishing
Company.
Jones, A. M., Rice, N., Bago, D. T., & Balia, S. (2013). Duration Data. Applied Health
Economics, 139-181.
Rothnam, K., Greenland, S., & Lash, T. (2008). Modern Epidemiology (3rd ed.). New York:
Lippincott Williams & Wilkins.
7
1 out of 7
Your All-in-One AI-Powered Toolkit for Academic Success.
+13062052269
info@desklib.com
Available 24*7 on WhatsApp / Email
Unlock your academic potential
Copyright © 2020–2026 A2Z Services. All Rights Reserved. Developed and managed by ZUCOL.