Epidemiology Survival Analysis: Calculation and Interpretation

Verified

Added on  2022/09/09

|9
|1331
|19
Homework Assignment
AI Summary
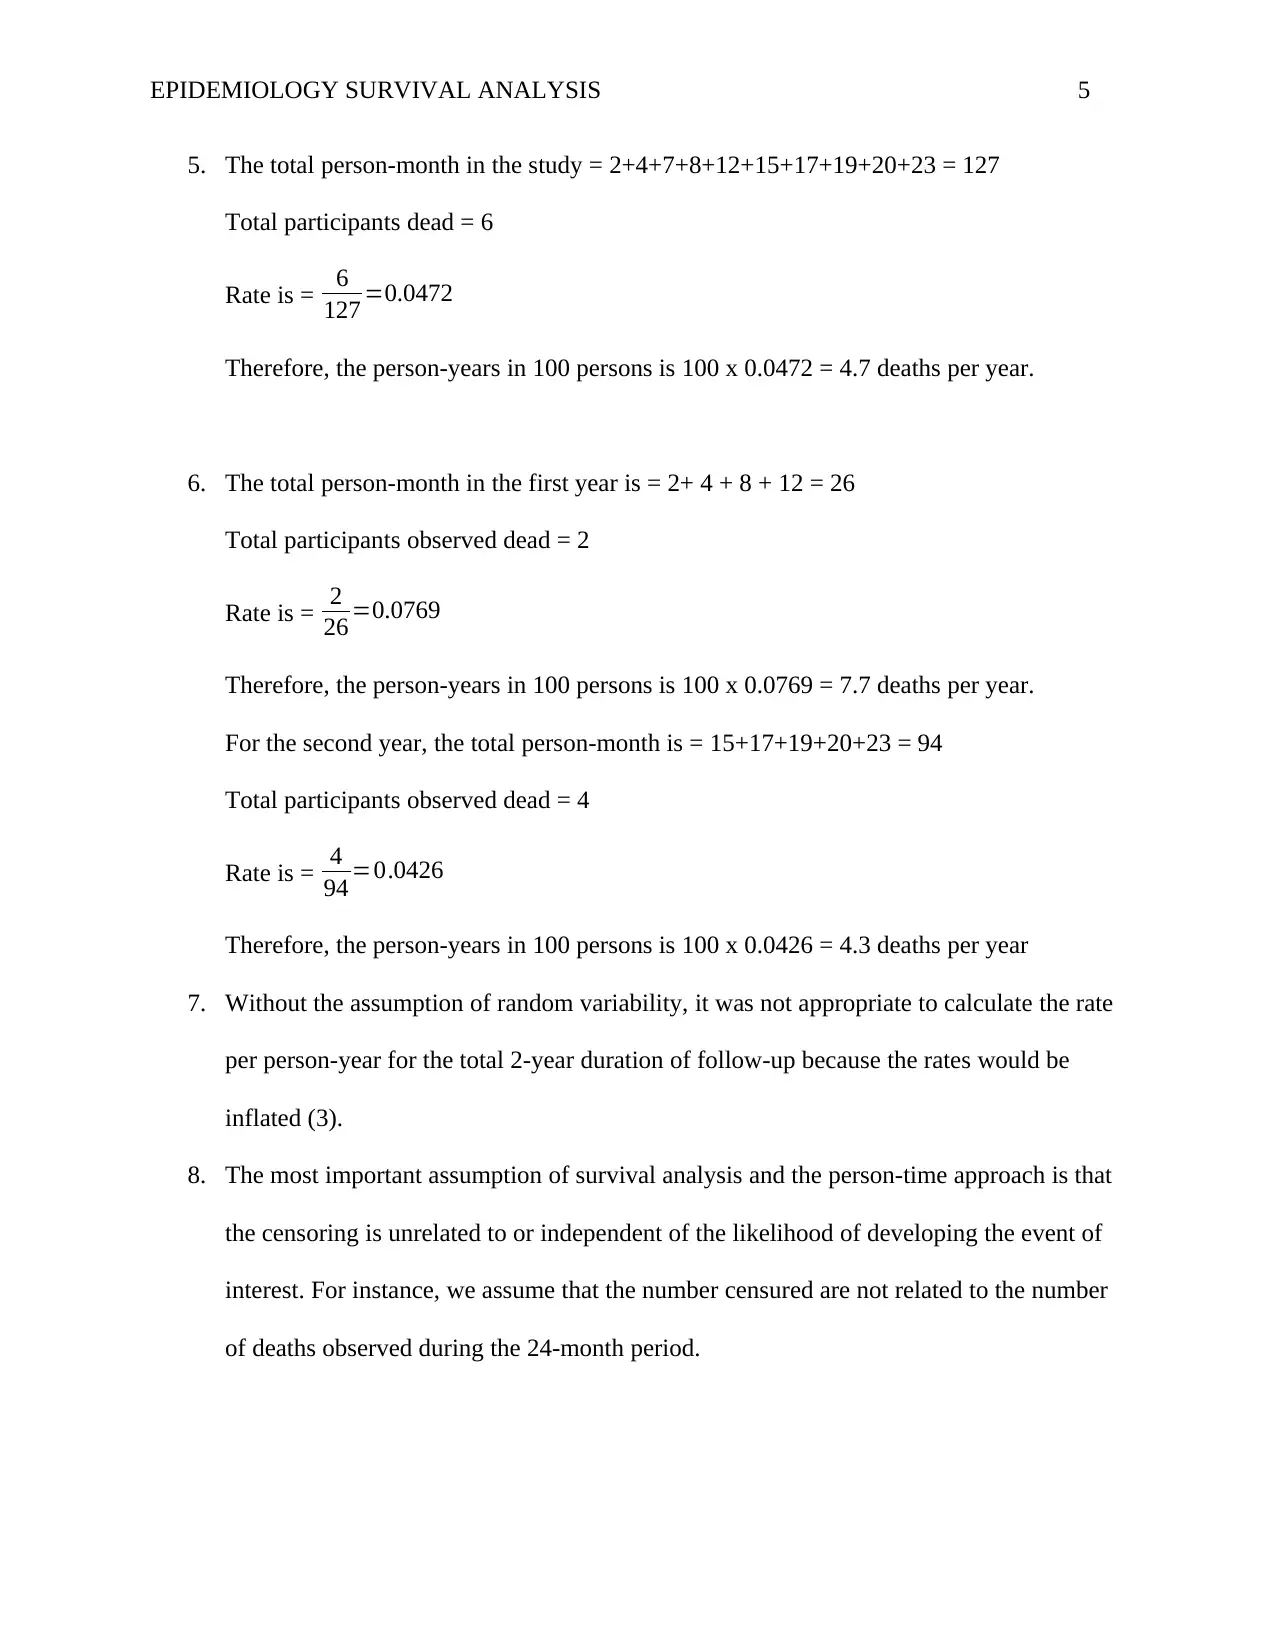
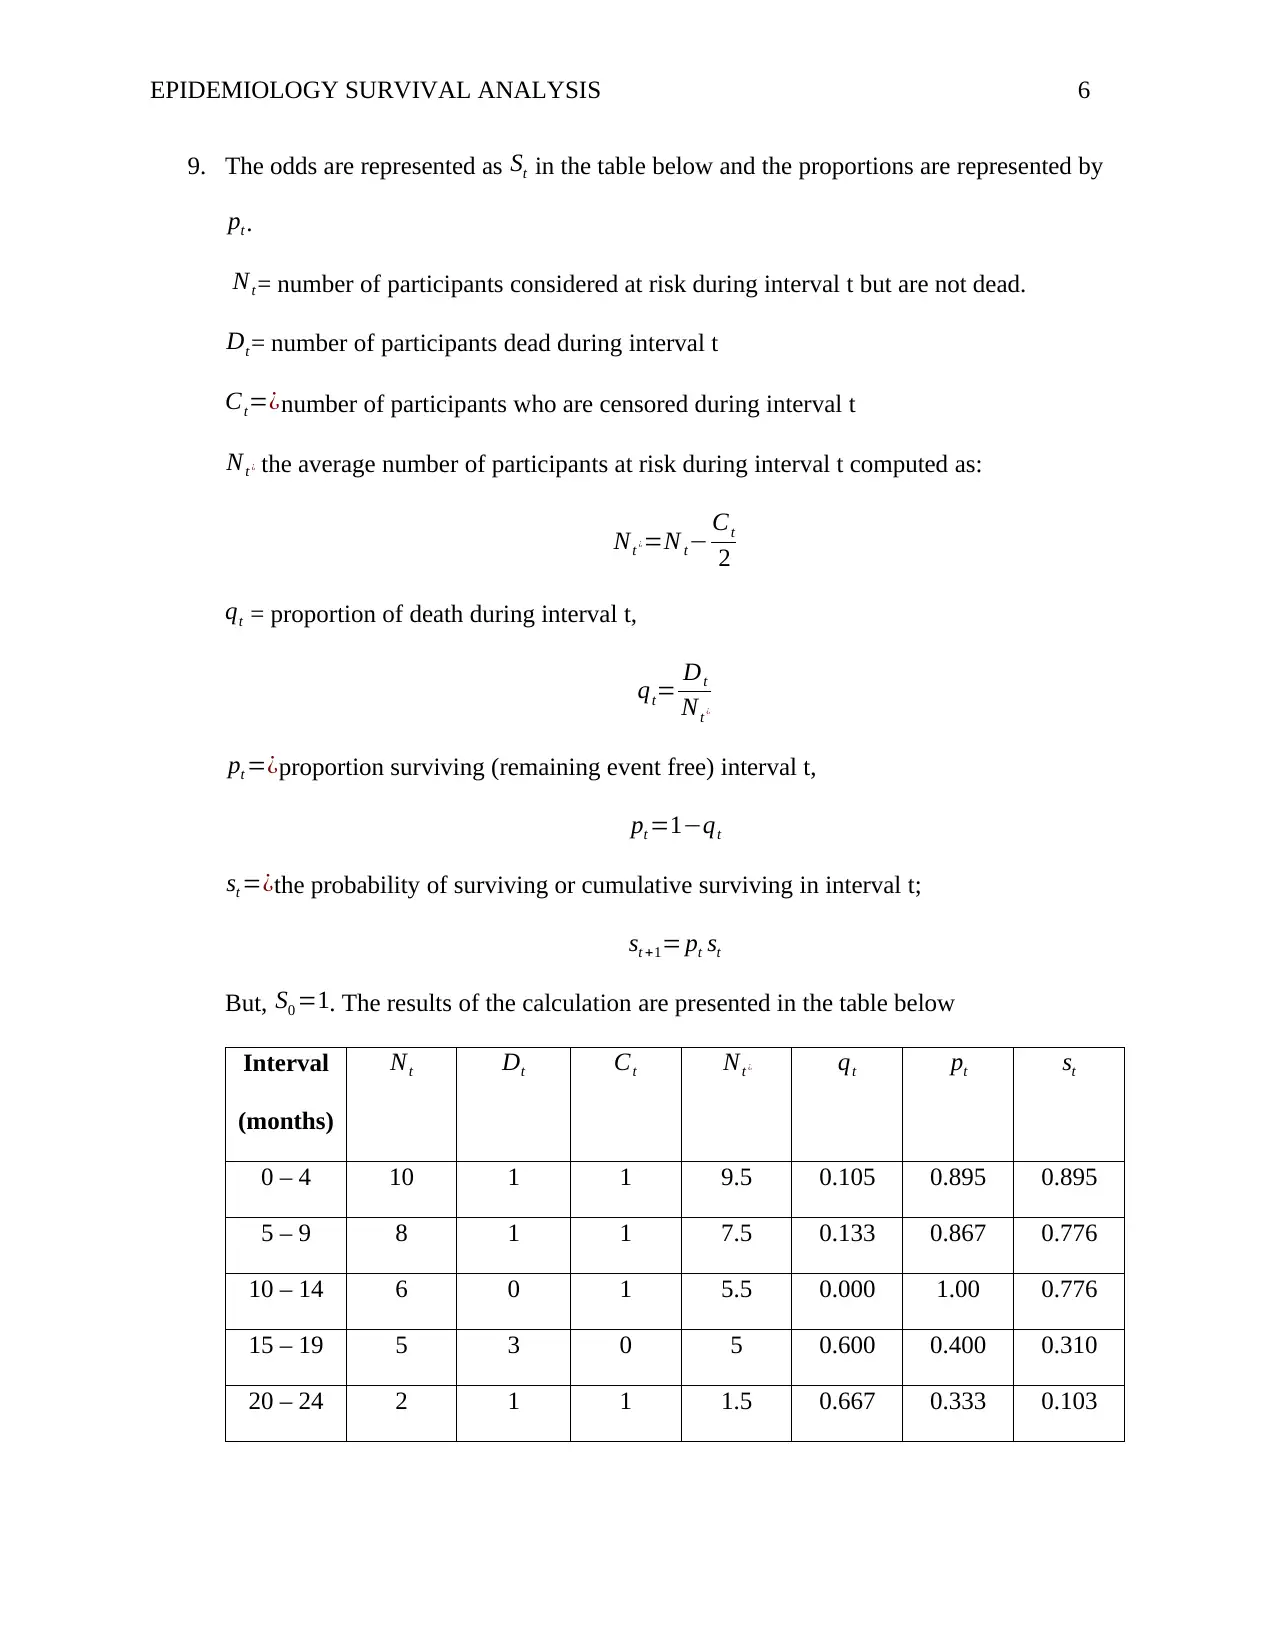
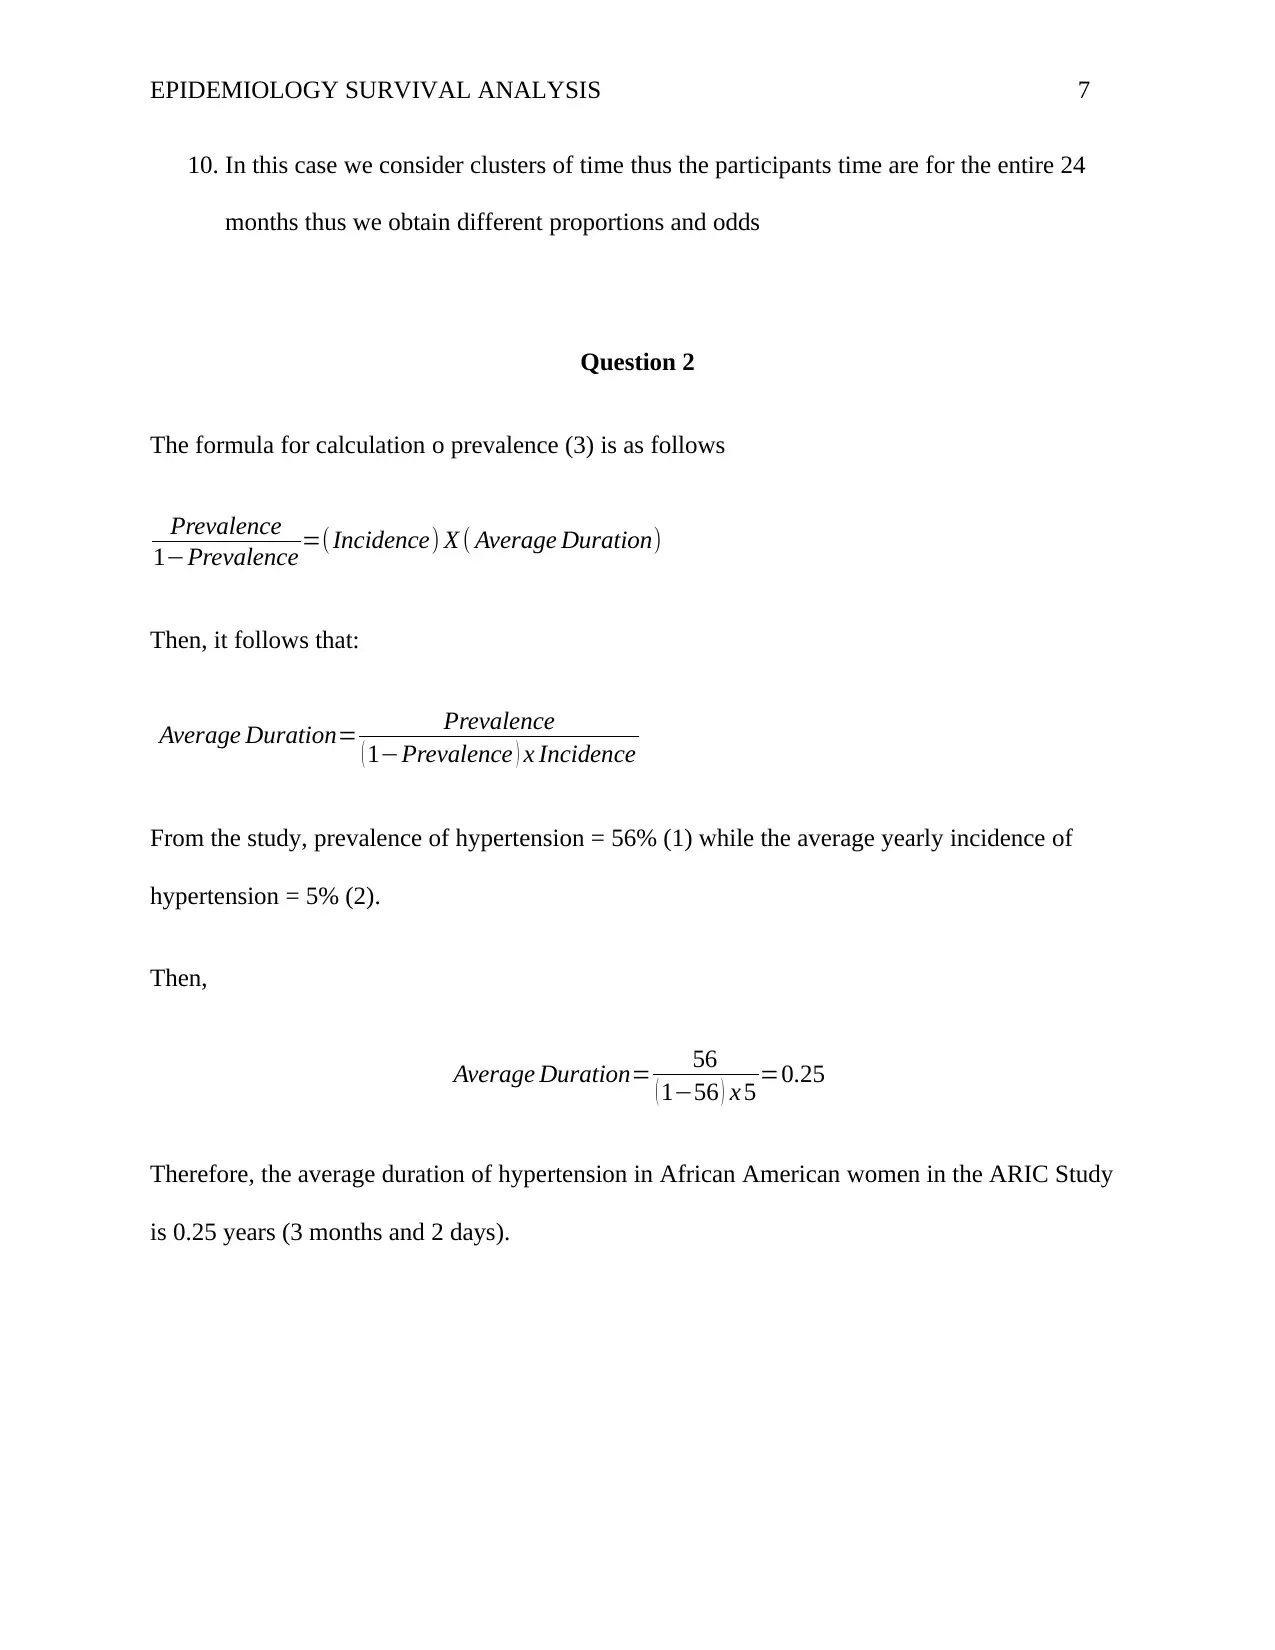
This assignment solution addresses a prospective study with a 2-year follow-up, analyzing survival data to calculate probabilities of death, survival, and cumulative survival. It determines the cumulative survival probability at the end of the follow-up period and contrasts it with the simple proportion surviving. The solution calculates death rates per 100 person-years, separately for the first and second years, and discusses the underlying assumptions of survival analysis and the person-time approach. It further explores the proportion and odds of death, explaining the differences in this context. The second part of the solution focuses on the Atherosclerosis Risk in Communities (ARIC) cohort study, using baseline prevalence and incidence data of hypertension in African American women to estimate the average duration of hypertension. Detailed calculations and interpretations are provided throughout, with references to relevant research papers.
Document Page
Running head: EPIDEMIOLOGY SURVIVAL ANALYSIS 1
Epidemiology Survival Analysis
Name
Institution
Date
tabler-icon-diamond-filled.svg

Paraphrase This Document

Need a fresh take? Get an instant paraphrase of this document with our AI Paraphraser
Document Page
EPIDEMIOLOGY SURVIVAL ANALYSIS 2
Question 1.
A prospective study with a 2-year (24-month) follow-up was conducted. Results are shown in the table for
individuals who either died or were censored before the end of the follow-up period. (75 marks)
Follow up time, in months Event
2 Death
4 Censored
7 Censored
8 Death
12 Censored
15 Death
17 Death
19 Death
20 Censored
23 Death
1. Using the data from the table, for all deaths calculate (1) the probability of death at the exact time
when each death occurred, (2) the probability of survival beyond the time when each death
occurred, and (3) the cumulative probabilities of survival.
2. What is the cumulative survival probability at the end of the follow-up period?
3. What is the simple proportion of individuals apparently surviving (i.e., not observed to die) through
the end of the study’s observation period?
4. Why are the simple proportion surviving and the cumulative probability of survival different?
5. Using the same data, calculate the overall death rate per 100 person-years. (To facilitate your
calculations, you may wish to calculate the number of person-months and then convert that to the
number of person-years.)
6. Calculate the rates separately for the first and second years of follow-up. (For this calculation,
assume that the individual who withdrew at month 12 withdrew just after midnight on the last day
of the month.)
7. Assuming that there was no random variability, was it appropriate to calculate the rate per
person-year for the total 2-year duration of follow-up?
8. What is the most important assumption underlying the use of both survival analysis and the
person-time approach?
9. Now, assume that the length of follow-up was the same for all individuals (except those who
died). Calculate the proportion of deaths and the odds of death in this cohort.
10. Why are these figures so different in this study?
Question 2.
The baseline point prevalence of hypertension in African American women aged 45 to 64 years included
in the Atherosclerosis Risk in Communities (ARIC) cohort study (Ref 1) was found to be 56%. In this
study, over a follow-up period of 6 years, the average yearly incidence of hypertension in African
American women was estimated to be about 5% and stable over the years(Ref 2). Using these data,
estimate the average duration of hypertension in African American women in the ARIC Study. (25 marks)
Document Page
EPIDEMIOLOGY SURVIVAL ANALYSIS 3
Epidemiology Survival Analysis
Question 1
1. Using the data from the table we are able to calculate the following
(1) The probability of death at the exact time when each death occurred (P(Death)) is the
total number dead up to that time divided by the number of participants (3).
P ( Death )= Number Dead
Number of participants
(2) The probability of survival beyond the time when each death occurred, (P(Survive))
is one minus the probability of death.
P ( Survive )=1P ( Death )
(3) The cumulative probabilities of survival (cumulative P(survive)) is the probability
surviving in during the previous death multiplied by the probability during the current
death.
cumulative P ( survive )=P ( Survive ) previous death x P ( Survive ) current death
The results are summarized in table below.
Follow Up
Time (Month)
Event P(Death) P(Survive) Cumulative
P(Survive)
2 Death 1
10 =0.100 0.900 0.900
Document Page
EPIDEMIOLOGY SURVIVAL ANALYSIS 4
8 Death 2
10 =0.200 0.800 0.720
15 Death 3
10 =0.300 0.700 0.504
17 Death 4
10 =0.400 0.600 0.302
19 Death 5
10 =0.500 0.500 0.151
23 Death 6
10 =0.600 0.400 0.060
2. From table above the cumulative survival probability at the end of the follow-up period is
0.060.
3. The simple proportion of individuals apparently surviving through the end of the study’s
observation period (P (apparently surviving)) is the number of persons censored divided
by the total number of participants
P ( apparently surviving ) = Number Censored
Number of Participants
P ( apparently surviving ) = 4
10 =0.400
4. The difference in the simple proportion surviving and the cumulative probability of
survival a rise from the calculation of the two estimates. The cumulative probability of
survival takes into account the probability of surviving during a previous occurrence of
death while the simple proportion of survival is just the number not observed to die as
ratio of the number of participants. Additionally, the cumulative probability of surviving
assume that the censured participants are also dead.
tabler-icon-diamond-filled.svg

Paraphrase This Document

Need a fresh take? Get an instant paraphrase of this document with our AI Paraphraser
Document Page
EPIDEMIOLOGY SURVIVAL ANALYSIS 5
5. The total person-month in the study = 2+4+7+8+12+15+17+19+20+23 = 127
Total participants dead = 6
Rate is = 6
127 =0.0472
Therefore, the person-years in 100 persons is 100 x 0.0472 = 4.7 deaths per year.
6. The total person-month in the first year is = 2+ 4 + 8 + 12 = 26
Total participants observed dead = 2
Rate is = 2
26 =0.0769
Therefore, the person-years in 100 persons is 100 x 0.0769 = 7.7 deaths per year.
For the second year, the total person-month is = 15+17+19+20+23 = 94
Total participants observed dead = 4
Rate is = 4
94 =0.0426
Therefore, the person-years in 100 persons is 100 x 0.0426 = 4.3 deaths per year
7. Without the assumption of random variability, it was not appropriate to calculate the rate
per person-year for the total 2-year duration of follow-up because the rates would be
inflated (3).
8. The most important assumption of survival analysis and the person-time approach is that
the censoring is unrelated to or independent of the likelihood of developing the event of
interest. For instance, we assume that the number censured are not related to the number
of deaths observed during the 24-month period.
Document Page
EPIDEMIOLOGY SURVIVAL ANALYSIS 6
9. The odds are represented as St in the table below and the proportions are represented by
pt.
Nt= number of participants considered at risk during interval t but are not dead.
Dt= number of participants dead during interval t
Ct=¿number of participants who are censored during interval t
Nt ¿ the average number of participants at risk during interval t computed as:
Nt ¿=N t Ct
2
qt = proportion of death during interval t,
qt= Dt
Nt ¿
pt =¿proportion surviving (remaining event free) interval t,
pt =1qt
st =¿the probability of surviving or cumulative surviving in interval t;
st +1= pt st
But, S0 =1. The results of the calculation are presented in the table below
Interval
(months)
Nt Dt Ct Nt ¿ qt pt st
0 – 4 10 1 1 9.5 0.105 0.895 0.895
5 – 9 8 1 1 7.5 0.133 0.867 0.776
10 – 14 6 0 1 5.5 0.000 1.00 0.776
15 – 19 5 3 0 5 0.600 0.400 0.310
20 – 24 2 1 1 1.5 0.667 0.333 0.103
Document Page
EPIDEMIOLOGY SURVIVAL ANALYSIS 7
10. In this case we consider clusters of time thus the participants time are for the entire 24
months thus we obtain different proportions and odds
Question 2
The formula for calculation o prevalence (3) is as follows
Prevalence
1Prevalence =( Incidence) X ( Average Duration)
Then, it follows that:
Average Duration= Prevalence
( 1Prevalence ) x Incidence
From the study, prevalence of hypertension = 56% (1) while the average yearly incidence of
hypertension = 5% (2).
Then,
Average Duration= 56
( 156 ) x 5 =0.25
Therefore, the average duration of hypertension in African American women in the ARIC Study
is 0.25 years (3 months and 2 days).
tabler-icon-diamond-filled.svg

Paraphrase This Document

Need a fresh take? Get an instant paraphrase of this document with our AI Paraphraser
Document Page
EPIDEMIOLOGY SURVIVAL ANALYSIS 8
References:
1. Harris MM, Stevens J, Thomas N, Schreiner P, Folsom AR. Associations of fat distribution
and obesity with hypertension in a bi-ethnic population: the ARIC Study. Obesity Res.
2000;8:516-524.
2. Fuchs FD, Chambless LE, Whelton PK, Nieto FJ, Heiss G. Alcohol consumption and the
incidence of hypertension: the Atherosclerosis Risk in Communities Study. Hypertension.
2001;37:1242-1250.
3. Survival Analysis. (2019). Sphweb.bumc.bu.edu. Retrieved 13 December 2019, from
http://sphweb.bumc.bu.edu/otlt/MPH-Modules/BS/BS704_Survival/BS704_Survival_print.html
Document Page
EPIDEMIOLOGY SURVIVAL ANALYSIS 9
chevron_up_icon
1 out of 9
circle_padding
hide_on_mobile
zoom_out_icon
[object Object]