UBLLYF-15-2: Energy Modeling Report for Energy Simulations
VerifiedAdded on 2023/01/18
|16
|3867
|52
Report
AI Summary
This energy modeling report delves into analytical modeling procedures and energy simulations within the context of sustainability. The report outlines business objectives, provides an overview of energy modeling, and discusses data selection, preparation, and analysis. It presents a case study on target marketing and explores model selection, validation, and implementation. The report includes detailed analysis of building characteristics and energy performance measures, such as lighting, HVAC optimization, and plug load reduction. It also examines the impact of various energy-saving strategies, including wall insulation, window film, and high-efficiency lighting, and presents model results with energy savings estimations. The methodology section details the energy modeling performance measures, including the impact of insulation, window retrofits, and day lighting controls. The report concludes with discussions on model management, server equipment, and HVAC optimization, offering a comprehensive analysis of energy efficiency opportunities and tenant improvements.

Energy Modeling Report 1
ENERGY MODELING REPORT
Student ID Number
Module Code
Year Module Run
Assessment Title: Component B – Energy Modeling Report
ENERGY MODELING REPORT
Student ID Number
Module Code
Year Module Run
Assessment Title: Component B – Energy Modeling Report
Paraphrase This Document
Need a fresh take? Get an instant paraphrase of this document with our AI Paraphraser
Energy Modeling Report 2
ANALYTIC MODELLING PROCUDURES
1.
Abstract 1
a. Business Objectives - Asking Right Questions! 1
b. Overview of Energy Modeling 1
c. Energy Modeling 2
2. Selecting Data for Modeling 3
3. A Case Study - Target Marketing 3
4. Prepare Data 4
5. Analyze and Transform Variables 5
a. Random Sampling (Train and Test) 5
6. Model Selection 6
a. Build/Develop/Train Models 6
7. Validate/Test Models 7
8. Document Methodology and Models 8
9. Implement Models 9
10. Model Management: Monitoring and Performance Tracking 10
Energy Modeling Report 3
1. Abstract
This report contains the analytical models of study that was used by the structural planners
for the purpose of predicting the computer programmed software in determining then h required
content, the workload behavior and measure the effects of both software and hardware system
functioning of work. Modeling provides the planner with all the available opportunities to study
and make various discoveries on the different patterns of the system of work. However, various
measures need to be taken into consideration to avoid modeling errors, predictions, and even
analysis (Bernal & Dufo, 2009).
a. Objectives of Analytical Modeling
The aim of this report is to build various analytical modeling designs to the consumers to
access and make use of the system performance. Analytical modeling enables the users to
understand proper behavior on system workloads and the hardware. Provide a basis for
prediction of certain elements of work within the input system and the other parts of the
component. The analytical model makes of speeding the hardware and even slow down workload
patterns for the purpose of measuring the existing systems. The effective plan is for future
performance and business planning of the projection capacity within the model and other
sources. To transform the existing business requirements into useful data processing, basing the
sufficient reinforcement on the workloads (Deshmukh & Deshmukh, 2008).
2. Overview of Energy Modeling
⊘ This is a preview!⊘
Do you want full access?
Subscribe today to unlock all pages.
Trusted by 1+ million students worldwide
Energy Modeling Report 4
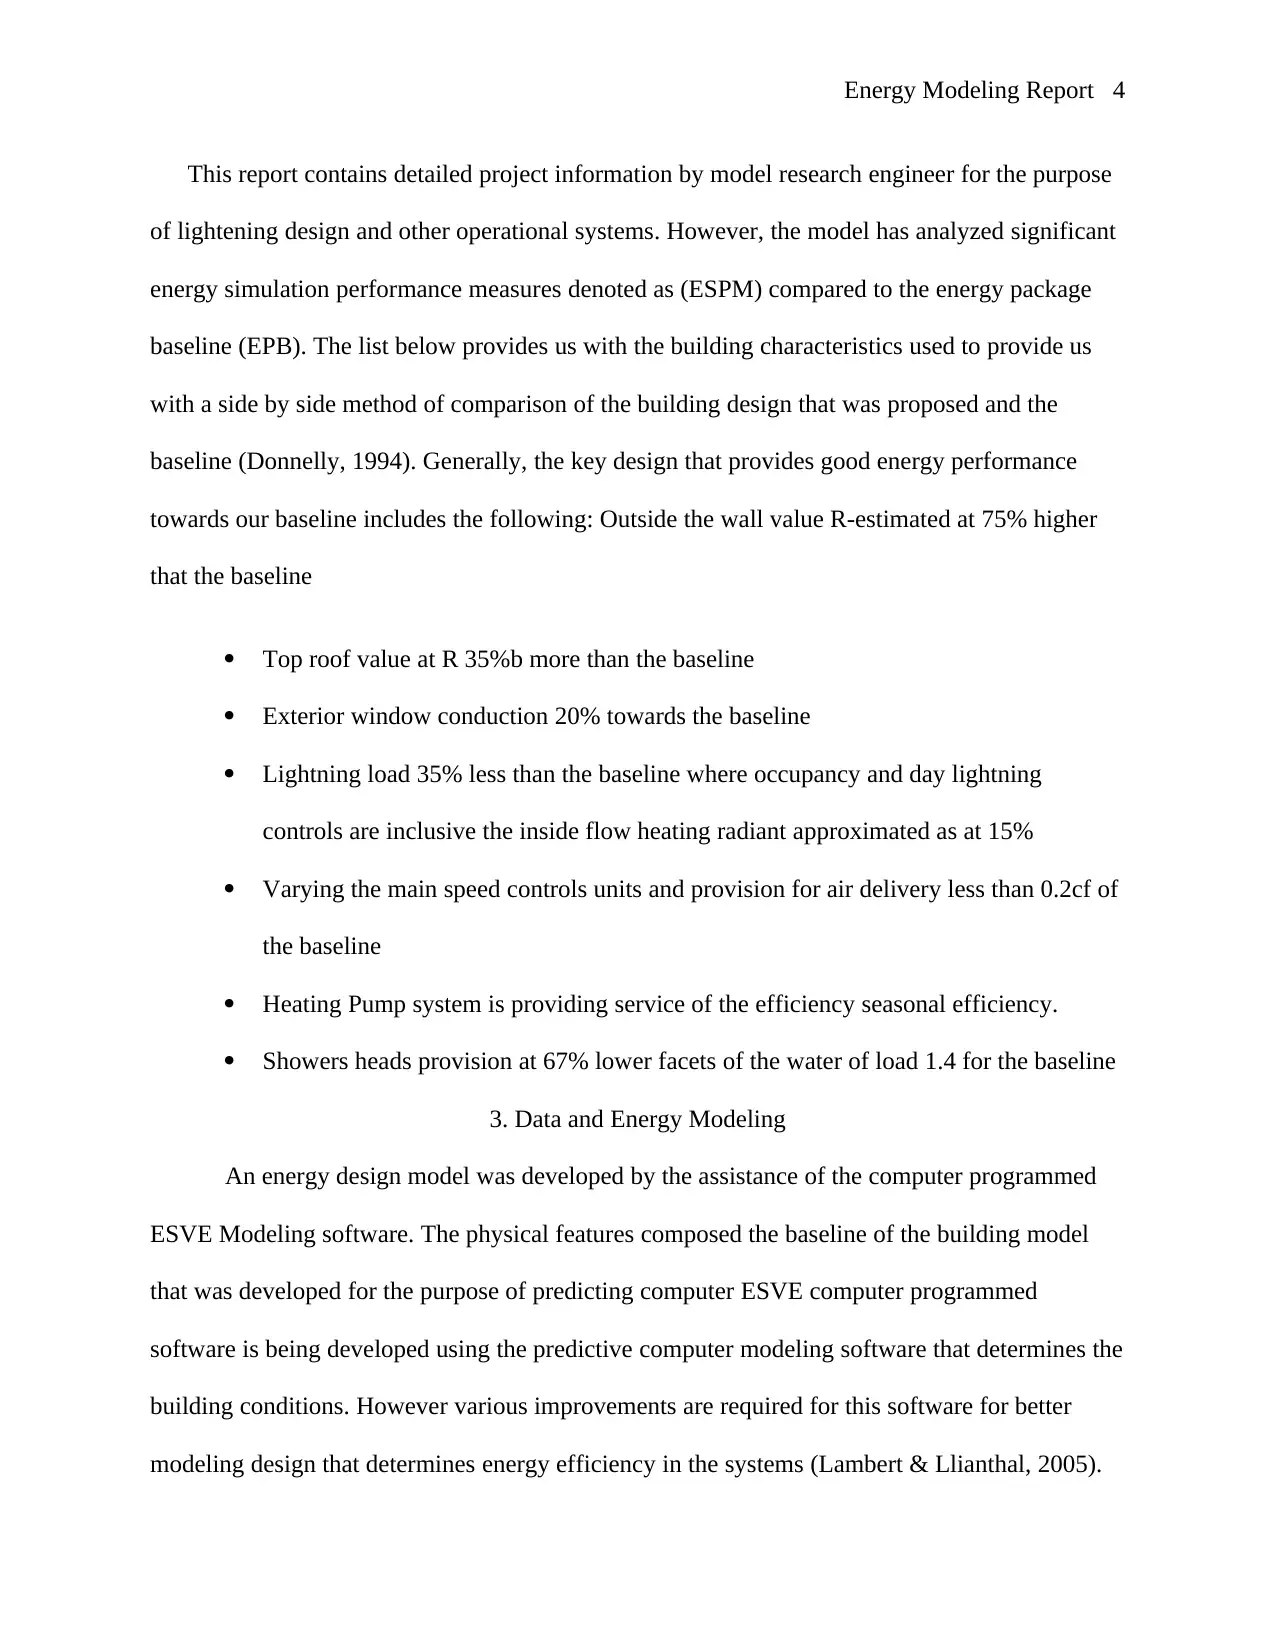
This report contains detailed project information by model research engineer for the purpose
of lightening design and other operational systems. However, the model has analyzed significant
energy simulation performance measures denoted as (ESPM) compared to the energy package
baseline (EPB). The list below provides us with the building characteristics used to provide us
with a side by side method of comparison of the building design that was proposed and the
baseline (Donnelly, 1994). Generally, the key design that provides good energy performance
towards our baseline includes the following: Outside the wall value R-estimated at 75% higher
that the baseline
Top roof value at R 35%b more than the baseline
Exterior window conduction 20% towards the baseline
Lightning load 35% less than the baseline where occupancy and day lightning
controls are inclusive the inside flow heating radiant approximated as at 15%
Varying the main speed controls units and provision for air delivery less than 0.2cf of
the baseline
Heating Pump system is providing service of the efficiency seasonal efficiency.
Showers heads provision at 67% lower facets of the water of load 1.4 for the baseline
3. Data and Energy Modeling
An energy design model was developed by the assistance of the computer programmed
ESVE Modeling software. The physical features composed the baseline of the building model
that was developed for the purpose of predicting computer ESVE computer programmed
software is being developed using the predictive computer modeling software that determines the
building conditions. However various improvements are required for this software for better
modeling design that determines energy efficiency in the systems (Lambert & Llianthal, 2005).
Paraphrase This Document
Need a fresh take? Get an instant paraphrase of this document with our AI Paraphraser
Energy Modeling Report 5
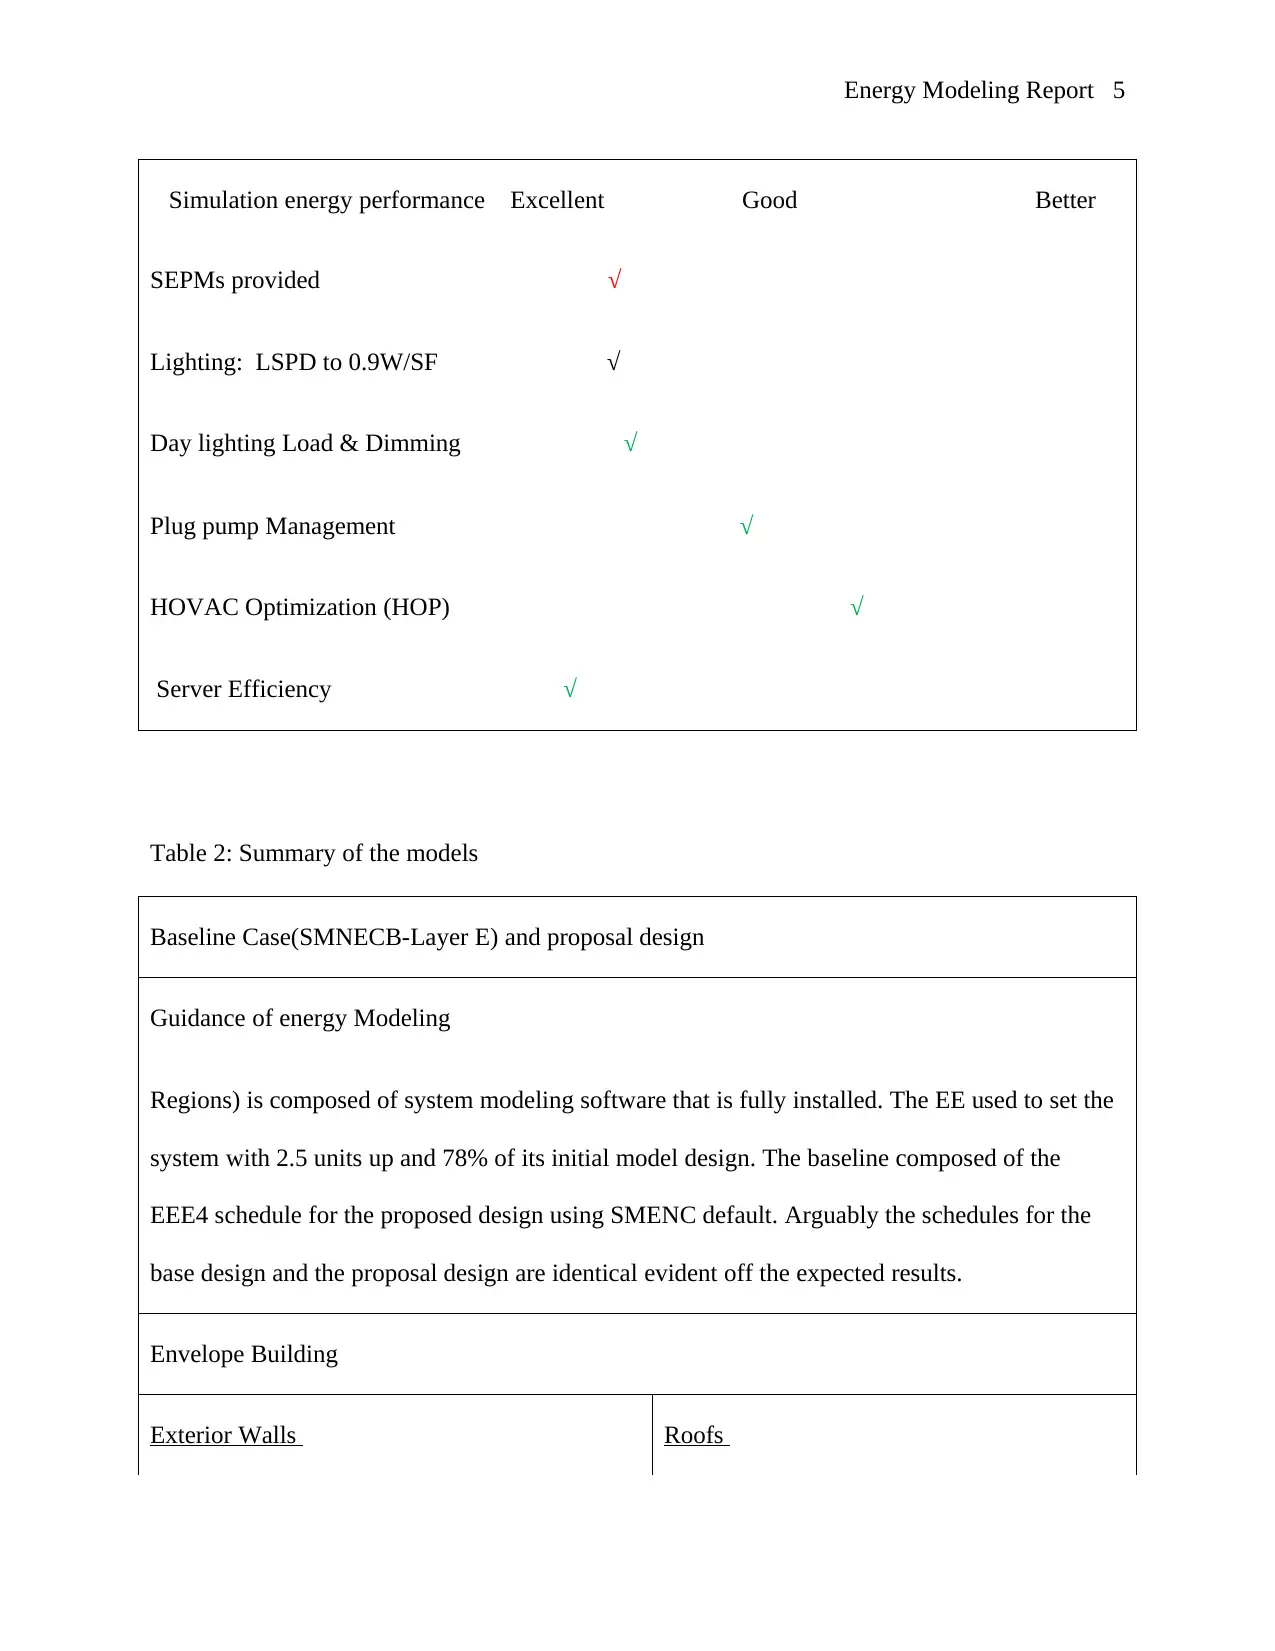
Simulation energy performance Excellent Good Better
SEPMs provided √
Lighting: LSPD to 0.9W/SF √
Day lighting Load & Dimming √
Plug pump Management √
HOVAC Optimization (HOP) √
Server Efficiency √
Table 2: Summary of the models
Baseline Case(SMNECB-Layer E) and proposal design
Guidance of energy Modeling
Regions) is composed of system modeling software that is fully installed. The EE used to set the
system with 2.5 units up and 78% of its initial model design. The baseline composed of the
EEE4 schedule for the proposed design using SMENC default. Arguably the schedules for the
base design and the proposal design are identical evident off the expected results.
Envelope Building
Exterior Walls Roofs
Energy Modeling Report 6
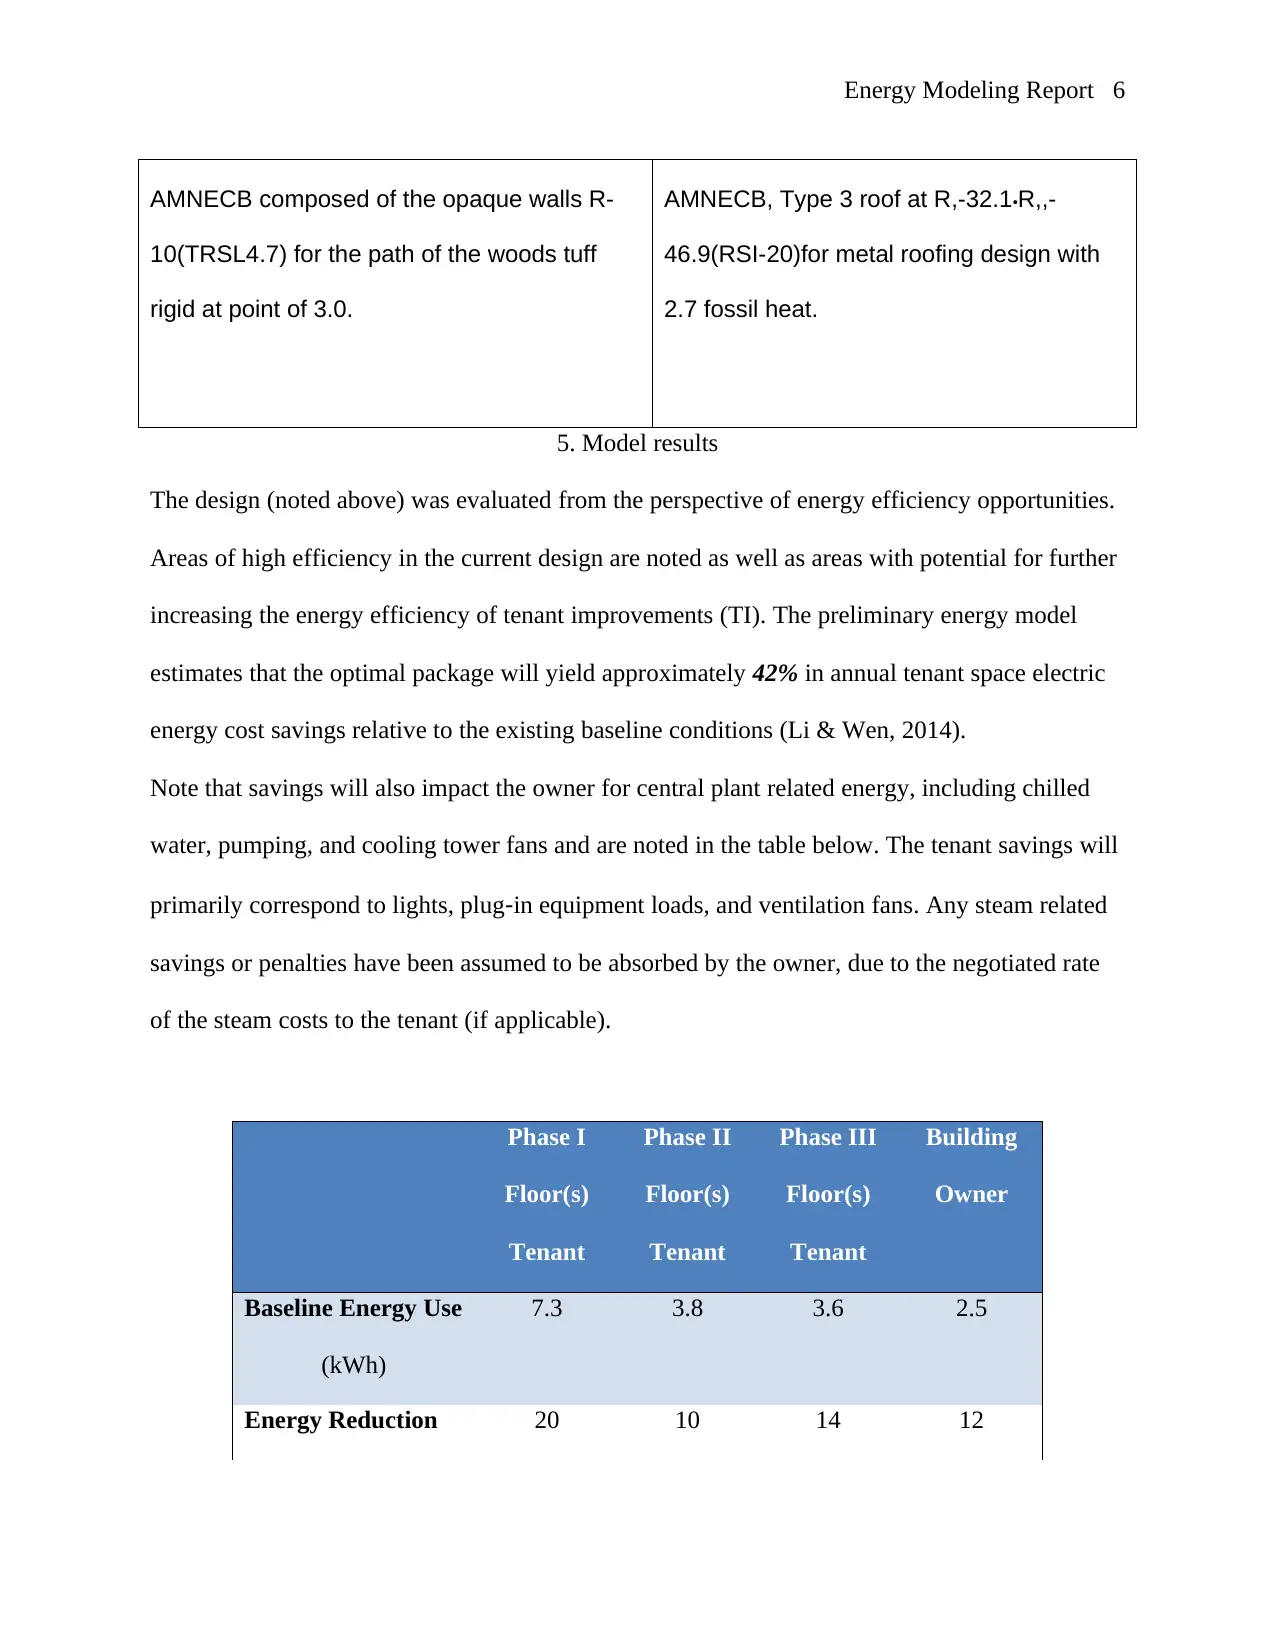
AMNECB composed of the opaque walls R-
10(TRSL4.7) for the path of the woods tuff
rigid at point of 3.0.
AMNECB, Type 3 roof at R,-32.1•R,,-
46.9(RSI-20)for metal roofing design with
2.7 fossil heat.
5. Model results
The design (noted above) was evaluated from the perspective of energy efficiency opportunities.
Areas of high efficiency in the current design are noted as well as areas with potential for further
increasing the energy efficiency of tenant improvements (TI). The preliminary energy model
estimates that the optimal package will yield approximately 42% in annual tenant space electric
energy cost savings relative to the existing baseline conditions (Li & Wen, 2014).
Note that savings will also impact the owner for central plant related energy, including chilled
water, pumping, and cooling tower fans and are noted in the table below. The tenant savings will
primarily correspond to lights, plug‐in equipment loads, and ventilation fans. Any steam related
savings or penalties have been assumed to be absorbed by the owner, due to the negotiated rate
of the steam costs to the tenant (if applicable).
Phase I
Floor(s)
Tenant
Phase II
Floor(s)
Tenant
Phase III
Floor(s)
Tenant
Building
Owner
Baseline Energy Use
(kWh)
7.3 3.8 3.6 2.5
Energy Reduction 20 10 14 12
⊘ This is a preview!⊘
Do you want full access?
Subscribe today to unlock all pages.
Trusted by 1+ million students worldwide
Energy Modeling Report 7
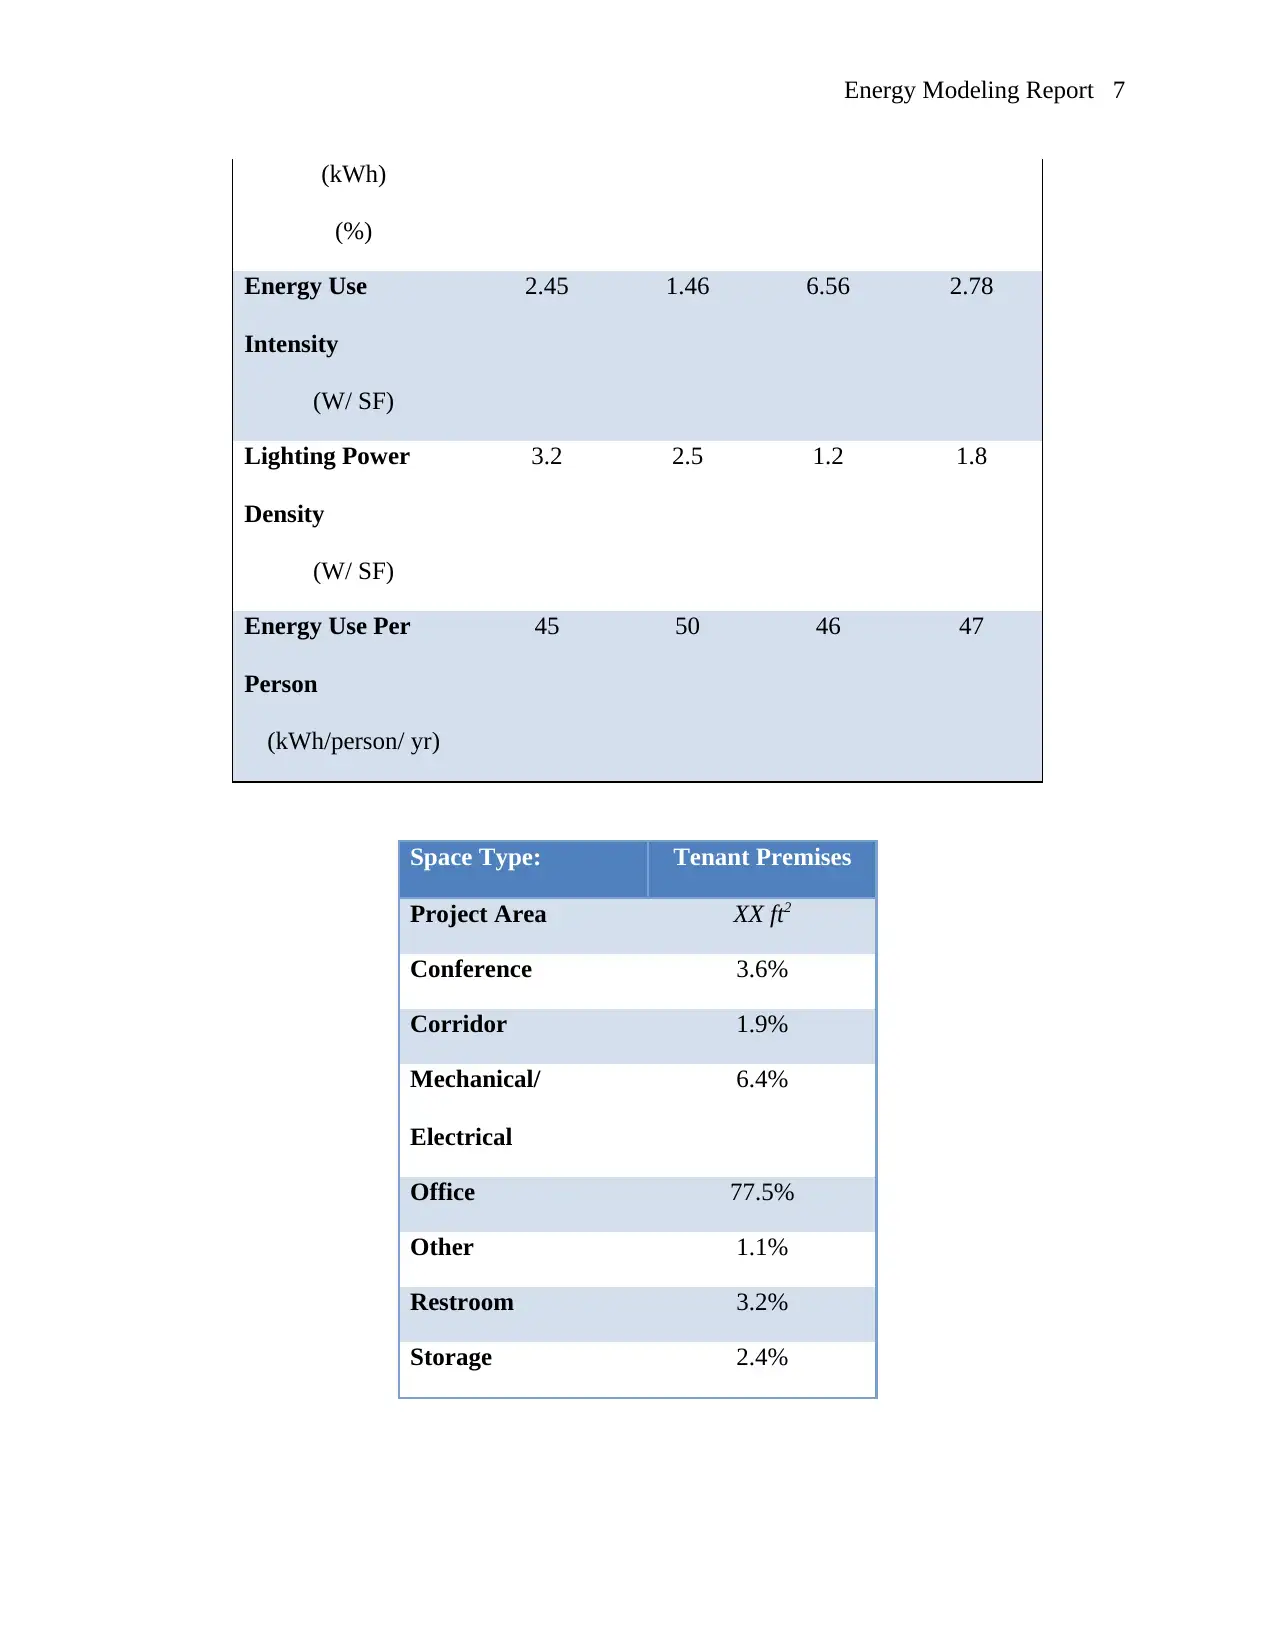
(kWh)
(%)
Energy Use
Intensity
(W/ SF)
2.45 1.46 6.56 2.78
Lighting Power
Density
(W/ SF)
3.2 2.5 1.2 1.8
Energy Use Per
Person
(kWh/person/ yr)
45 50 46 47
Space Type: Tenant Premises
Project Area XX ft2
Conference 3.6%
Corridor 1.9%
Mechanical/
Electrical
6.4%
Office 77.5%
Other 1.1%
Restroom 3.2%
Storage 2.4%
Paraphrase This Document
Need a fresh take? Get an instant paraphrase of this document with our AI Paraphraser

Energy Modeling Report 8
Energy Modeling Report 9
7. Methodology Models
a. Energy modeling Performance Measures (EPMs)
Perimeter Wall Model Insulation
Adding insulation to the exterior walls reduces thermal heat transfer of the surface, resulting in
decreased heat gain in the perimeter spaces of the building. This measure assumes that R-20
insulation will be added to the inside of the perimeter walls. Assume aerobes wall insulation will
be added to the premises as prior to the perimeter wall enclosure and finish (white box).
b. Window Film
Window design is all similar for fenestration wall ratio attendance (FWRA) with limit of 0.2
calculations including the sky light. The film is utilized by using the control, of the heat from the
solar approximately 0.68 heat coefficient. An estimate of 20.5% on the vertical wall surface is
applied for shading of windows for dirt free (Richardson, 2013). The proposed shading
coefficient for the baseline is equal for efficient provision of cooling and comfort in the building.
This run in the analysis has assumed that film would be utilized for Levels 15-23 as part of the
tenant fit-out.
c. Window Retrofit
Replacing the existing glass with a higher efficiency glass would also provide energy savings
associated with the reduced solar load and increased glazing insulation. Infiltration is supplied at
an average rate of 0.02 cfm per ft sq of the total surface area that is applied on 24/7 hour.
d. Day lighting Controls
Total Annual Energy Savings: XX kWh
⊘ This is a preview!⊘
Do you want full access?
Subscribe today to unlock all pages.
Trusted by 1+ million students worldwide
Energy Modeling Report 10
Tenant Annual Energy Savings: 24.5 kWh (X %)
Building Owner Annual Energy Savings: 20.4 kWh (X %)
e. High Efficiency LED Lighting
The use of high efficiency lighting layout with occupancy sensors in the open office plan areas
for future tenants will provide energy savings relative to a baseline whole building allowance of
2.1 W/sf (Donnelly 1994; Richardson 2013).
Total Annual Energy Savings: 245 kWh
Tenant Annual Energy Savings: 34 kWh (X %)
Building Owner Annual Energy Savings: 26 kWh (X %)
9, Implement Models
Plug-In Equipment Load Reduction
a. Plug Load Control - Computer Software
Specialized computer software automatically backs up computers and shuts down computers to
save energy during unoccupied periods. This analysis assumes that the use of the computer
power control software combined with the off hours plug load control the plug-in equipment
loads will be reduced by 50% during unoccupied hours Sadorky, (2012).
Total Annual Energy Savings: XX kWh
Tenant Annual Energy Savings: XX kWh (X %)
Building Owner Annual Energy Savings: XX kWh (X %)
b. Plug Load Control - Occupancy Sensors
Paraphrase This Document
Need a fresh take? Get an instant paraphrase of this document with our AI Paraphraser
Energy Modeling Report 11
Typically, plug loads are reduced at night but not to zero. Many plug loads continue to draw
power, at a reduced rate, when they are in sleep or off mode. One approach to minimizing these
phantom loads is to provide some number of outlets with active control that turns off power
completely when the space is unoccupied (Sen, 2008). This analysis assumes that plug‐in
equipment will be reduced by 9% during occupied hours, and combined with the Night
Watchman controls will reduce plug-in equipment loads by 42 % during unoccupied hours.
Total Annual Energy Savings: XX kWh
Tenant Annual Energy Savings: XX kWh (X %)
Building Owner Annual Energy Savings: XX kWh (X %)
Plug Load Control- Kill Switch
Total Annual Energy Savings: XX kWh
Tenant Annual Energy Savings: XX kWh (X %)
Building Owner Annual Energy Savings: XX kWh (X %)
10. Module Management
Server Equipment
Richardson (2013) asserts that the implementation of the information technology would
be used to accurately determine the required combination for energy server modeling. Arguably
the measurements could be specific on the energy server settings, data organization and
distribution like the passive network optical server. Minimizing electrical usage would enable the
equipment to save the loaded power in the building at the same time the computer servings room
would be cooling the load. However a comprehensive study is required for further investigation
to determine the desired implications for the soft ware.
Energy Modeling Report 12
High Efficiency Servers Existing building server and IT loads have been estimated for the
IDF/MDF rooms as 30-50 W/sf. Use of high efficiency server equipment could reduce these
loads significantly. This analysis assumes that IT loads have been reduced by 50% as part of the
tenant fit-out Bernal & Dufo (2009).
Total Annual Energy Savings: XX kWh
Tenant Annual Energy Savings: XX kWh (X %)
Building Owner Annual Energy Savings: XX kWh (X %)
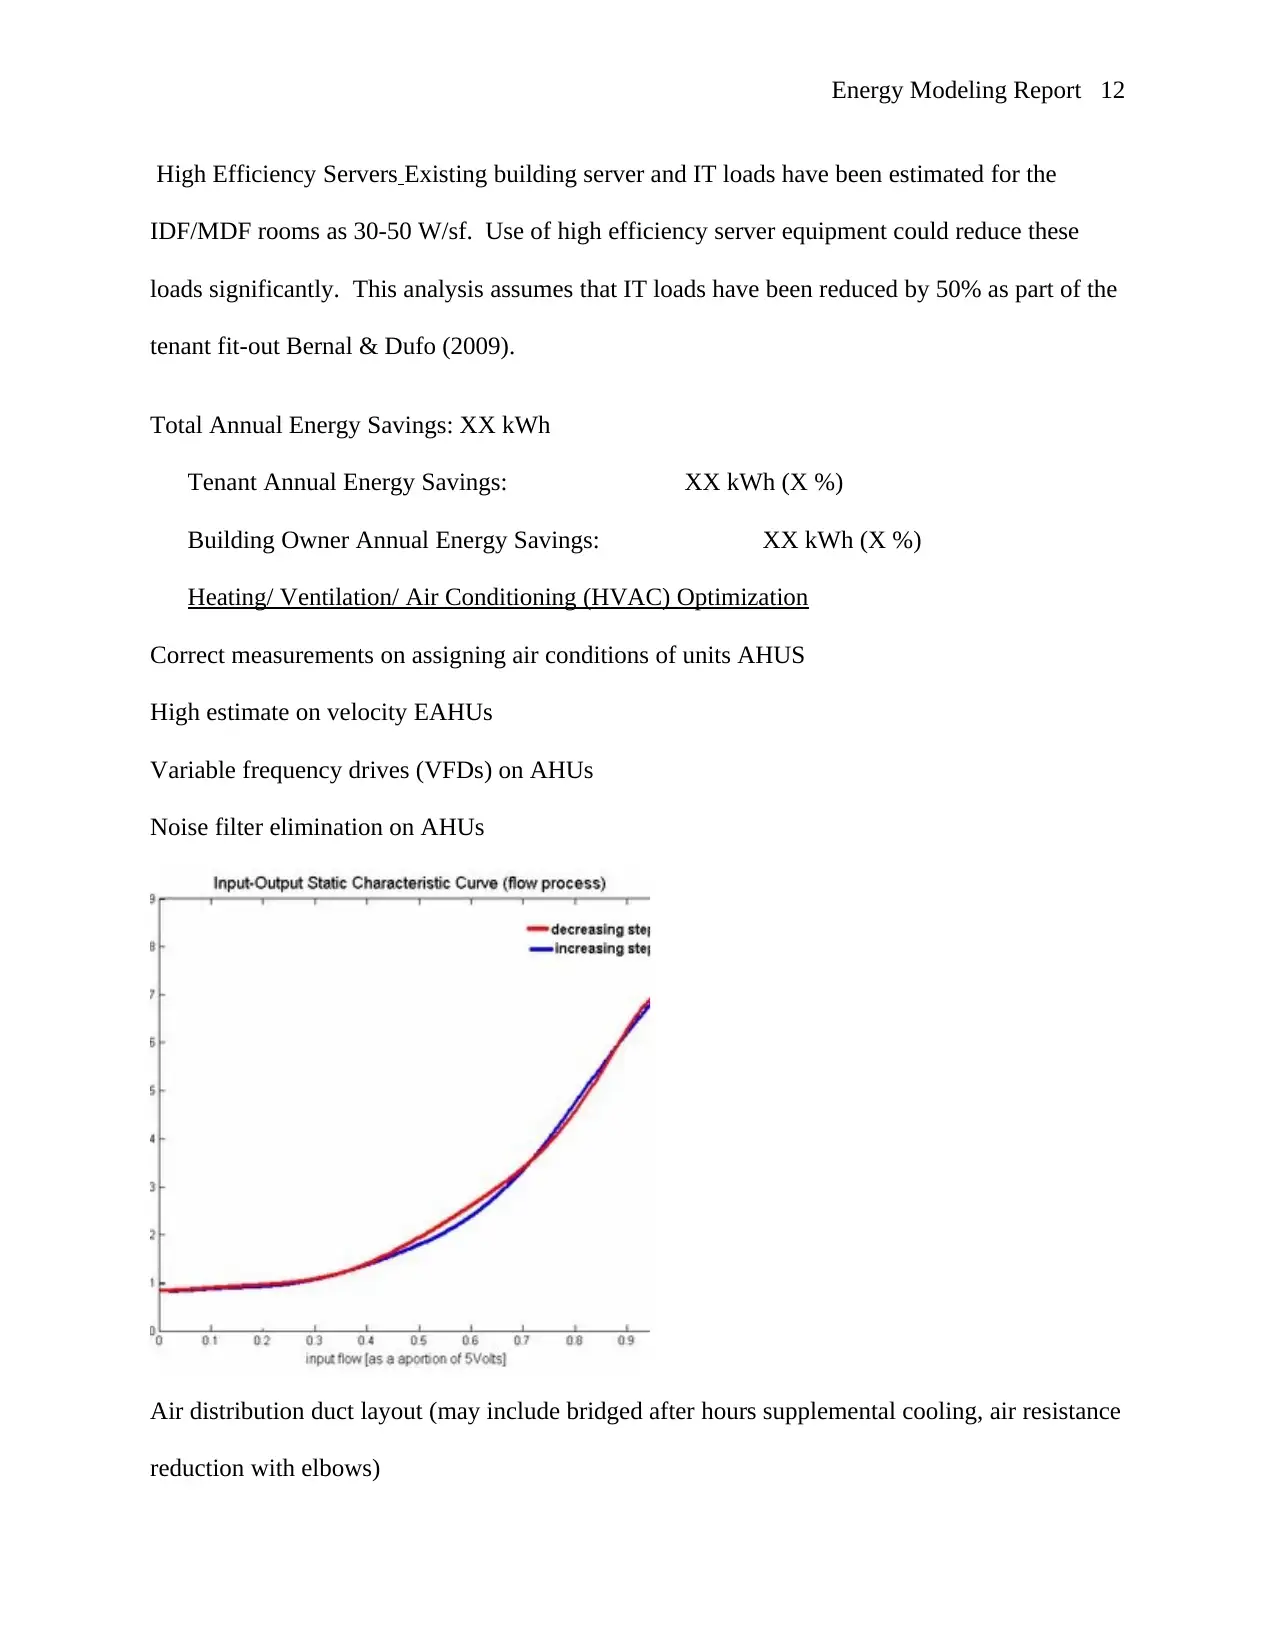
Heating/ Ventilation/ Air Conditioning (HVAC) Optimization
Correct measurements on assigning air conditions of units AHUS
High estimate on velocity EAHUs
Variable frequency drives (VFDs) on AHUs
Noise filter elimination on AHUs
Air distribution duct layout (may include bridged after hours supplemental cooling, air resistance
reduction with elbows)
High Efficiency Servers Existing building server and IT loads have been estimated for the
IDF/MDF rooms as 30-50 W/sf. Use of high efficiency server equipment could reduce these
loads significantly. This analysis assumes that IT loads have been reduced by 50% as part of the
tenant fit-out Bernal & Dufo (2009).
Total Annual Energy Savings: XX kWh
Tenant Annual Energy Savings: XX kWh (X %)
Building Owner Annual Energy Savings: XX kWh (X %)
Heating/ Ventilation/ Air Conditioning (HVAC) Optimization
Correct measurements on assigning air conditions of units AHUS
High estimate on velocity EAHUs
Variable frequency drives (VFDs) on AHUs
Noise filter elimination on AHUs
Air distribution duct layout (may include bridged after hours supplemental cooling, air resistance
reduction with elbows)
⊘ This is a preview!⊘
Do you want full access?
Subscribe today to unlock all pages.
Trusted by 1+ million students worldwide
1 out of 16
Your All-in-One AI-Powered Toolkit for Academic Success.
+13062052269
info@desklib.com
Available 24*7 on WhatsApp / Email
![[object Object]](/_next/static/media/star-bottom.7253800d.svg)
Unlock your academic potential
Copyright © 2020–2026 A2Z Services. All Rights Reserved. Developed and managed by ZUCOL.