University BLDG2031: Sustainable Construction Building 201 Case Study
VerifiedAdded on 2022/09/29
|19
|4995
|26
Report
AI Summary
This report presents a comprehensive case study of Building 201, focusing on its sustainable construction performance. The study evaluates various aspects, including energy efficiency, water usage, and indoor environmental quality (IEQ), using data collected through literature review, site reconnaissance, questionnaires, and observation. The report analyzes energy consumption patterns, weather and climate considerations, and the building's layout to assess its environmental impact. It also examines the IEQ, including internal air temperature, humidity, ventilation, lighting, and glare. Based on the findings, the report proposes a detailed sustainability refurbishment plan, providing recommendations and initiatives to enhance the building's performance and meet sustainability objectives. The report includes data analysis, graphical representations, and references to support its findings and recommendations. The study also highlights the importance of sustainable practices in the construction industry and the role of such evaluations in improving building performance and user well-being.
Sustainable Construction 1
BLDG2031 Sustainable Construction:
Assessment 2- Case Study
By (Name)
Course
Professor’s name
University name
City, State
Date of submission
BLDG2031 Sustainable Construction:
Assessment 2- Case Study
By (Name)
Course
Professor’s name
University name
City, State
Date of submission
Paraphrase This Document
Need a fresh take? Get an instant paraphrase of this document with our AI Paraphraser
Sustainable Construction 2
Contents
Introduction................................................................................................................................3
Building background..............................................................................................................3
Performance analysis.................................................................................................................4
Sustainable performance indicators.......................................................................................4
Methodology..........................................................................................................................4
Data presentation and analysis...............................................................................................5
Energy................................................................................................................................6
Weather and climate...........................................................................................................8
Building layout...................................................................................................................8
Internal Environmental Quality (IEQ)...............................................................................9
Sustainability Refurbishment plan...........................................................................................13
Refurbishment plan..............................................................................................................13
References................................................................................................................................16
Appendix..................................................................................................................................18
Appendix 1: Questionnaire..................................................................................................18
Appendix 2: Site Photos.......................................................................................................19
Sustainable Construction 3
Introduction
Sustainability is one of the key aspects of Millennial Development Goals (MDGs) of the
majority of the countries under the United Nations. The topic of sustainability has taken
centre stage more than ever in the past thirty years globally, largely due to the adverse effects
of global warming that have been experienced in many parts of the globe (BRE Center for
Sustainable Construction 2005). As a result, most industries, including the construction
industry have taken measures to ensure the materials, designs and building management
systems are kore environmentally friendly. It has been estimated that the construction
industry contributes at least 17 percent of carbon emissions (Uher 2009). The undesirable
environmental impact of buildings has mainly be contributed by; energy (over 40 %),
building materials (28 %), water use and sewerage disposal (26%), land (11 %) and pollution
emission (Boyle 2009). Majority of the buildings that were constructed over three decades
ago are thus considered unsustainable. As a result, efforts are being made to employ changes
and strategies to improve their sustainable performance. This report that will investigate and
evaluate the performance of building 201, and a sustainability refurbishment produced from
the previously mentioned analysis (Baker 2009). All the information contained in this report,
including the data and recommendations in this report have been researched and documented
by four members that constitute the group.
Building background
The case study building for this report is Building 201. The building has been operation for
more than 40 years. The building frame is made of in situ concrete with masonry infill, and
supports seven storeys. The main function of the building has been an educational facility.
Over its lifetime, it has experienced a number of design changes that have affected the
building performance, especially natural ventilation and air circulation. As a result, the
building heavily relies on HVAC.
All the plans for the building have been provided for in the Appendix.
⊘ This is a preview!⊘
Do you want full access?
Subscribe today to unlock all pages.
Trusted by 1+ million students worldwide
Sustainable Construction 4
Performance analysis
Sustainable performance indicators
In order to achieve a comprehensive performance analysis, it is paramount to determine the
sustainable performance indicators that will be measured and evaluated. This sub-section will
provide appropriate sustainable performance indicators that were considered for Building
201. Sustainable performance indicators have been defined by (Lombera and Aprea 2010) as
those factors that may affect; use of minerals, acidification, Eco toxicity, eutrophication, land
uses, breathing effects due to organic substances and ironic radiation. From our literature
review, it was observed that numerous construction organisations rank their sustainable
factors in the following order of importance: energy, building materials, pollution, water,
health and wellbeing, ecology and land use, and transport (Abdi Karim 2007).
Due to the location and the function of the building, the most probable pollutants include
smoke, dust and noise from the nearby traffic, littering by the students themselves and, dust
and noise from the neighbouring urban area. The major sustainable performance indicators
include:
Energy efficiency: How are the building structure, envelope and systems designed to
ensure the optimum use of energy?
Water efficiency: How efficient are the building’s water circulation and consumption
systems when in operation?
Materials: How have the choice, design and use of building materials enhanced
environmental protection?
Indoor environmental quality (IEQ): what are the design strategies that have enhanced
high quality IEQ, with minimal adverse effects to the environment, including but not
limited to; acoustics, indoor air quality, thermal comfort, lighting and ventilation?
Green features: Has the building adopted any technologies, or green practices or
features that enhance its sustainability?
For the purposes of this report, the above listed factors will be classified into two major
categories: operational and functional performance (AECOM 2012). Operational
performance will focus on the quality of internal environment IEQ while the functional
performance will focus on the effectiveness and efficiency of the building design and
structure, design and envelope such as building materials, energy efficiency, water efficiency
and green features. The building’s energy efficiency will be determined by the sum of
embodied energy and energy consumption. Embodied energy refers to the energy absorbed
within the building, due to exposure of building materials to the sun and other elements while
energy consumption will focus on energy used in production of greenhouse gases, volatile
carbons, particulates and other pollutants (A.S, D.L. and Z. 2009).
Methodology
The research methods that were employed to obtain data include literature review, site
reconnaissance, questionnaires and observation. Literature referenced and analysed from this
report was obtained from the institution’s library, acclaimed proceedings and journals, and
peer reviewed articles. The group members were cautious in ensuring that all the literature
was published within the last two decades, by acclaimed authors and institutions (Industry
2000). The group members undertook a building reconnaissance on 7th October, 2019 to
obtain the necessary data on building performance. Group members took photographs of key
elements to be evaluated in this analysis (Appendix 2). The building’s performance data was
obtained from the facilities manager and the building’s architect. All the operational
Paraphrase This Document
Need a fresh take? Get an instant paraphrase of this document with our AI Paraphraser
Sustainable Construction 5
performance data was collected from September 2010 to August 2011, and it was obtained
from the facilities management of the building. Meteorological and climatic data used for
comparison in this report have been obtained from the Bureau of Meteorology.
Questionnaires were used to collect information and opinions on the various building
practices currently use by the building users, such as, how often they used artificial light as
compared to daylight and operation of windows and openings vis-a-vis air conditioning
(Appendix 1). A total of 150 questionnaires were handed out to a sample of the building users
on 7th and 8th October, 2019 by personal delivery (CIRIA 2014). A total of 46 completed
questionnaires were returned which records a 31 percent rate. This response rate is deemed
acceptable for our kind of research (Cooper 2011). All the data was compiled with no bias to
the participants’ profession, educational background or age.
Data presentation and analysis
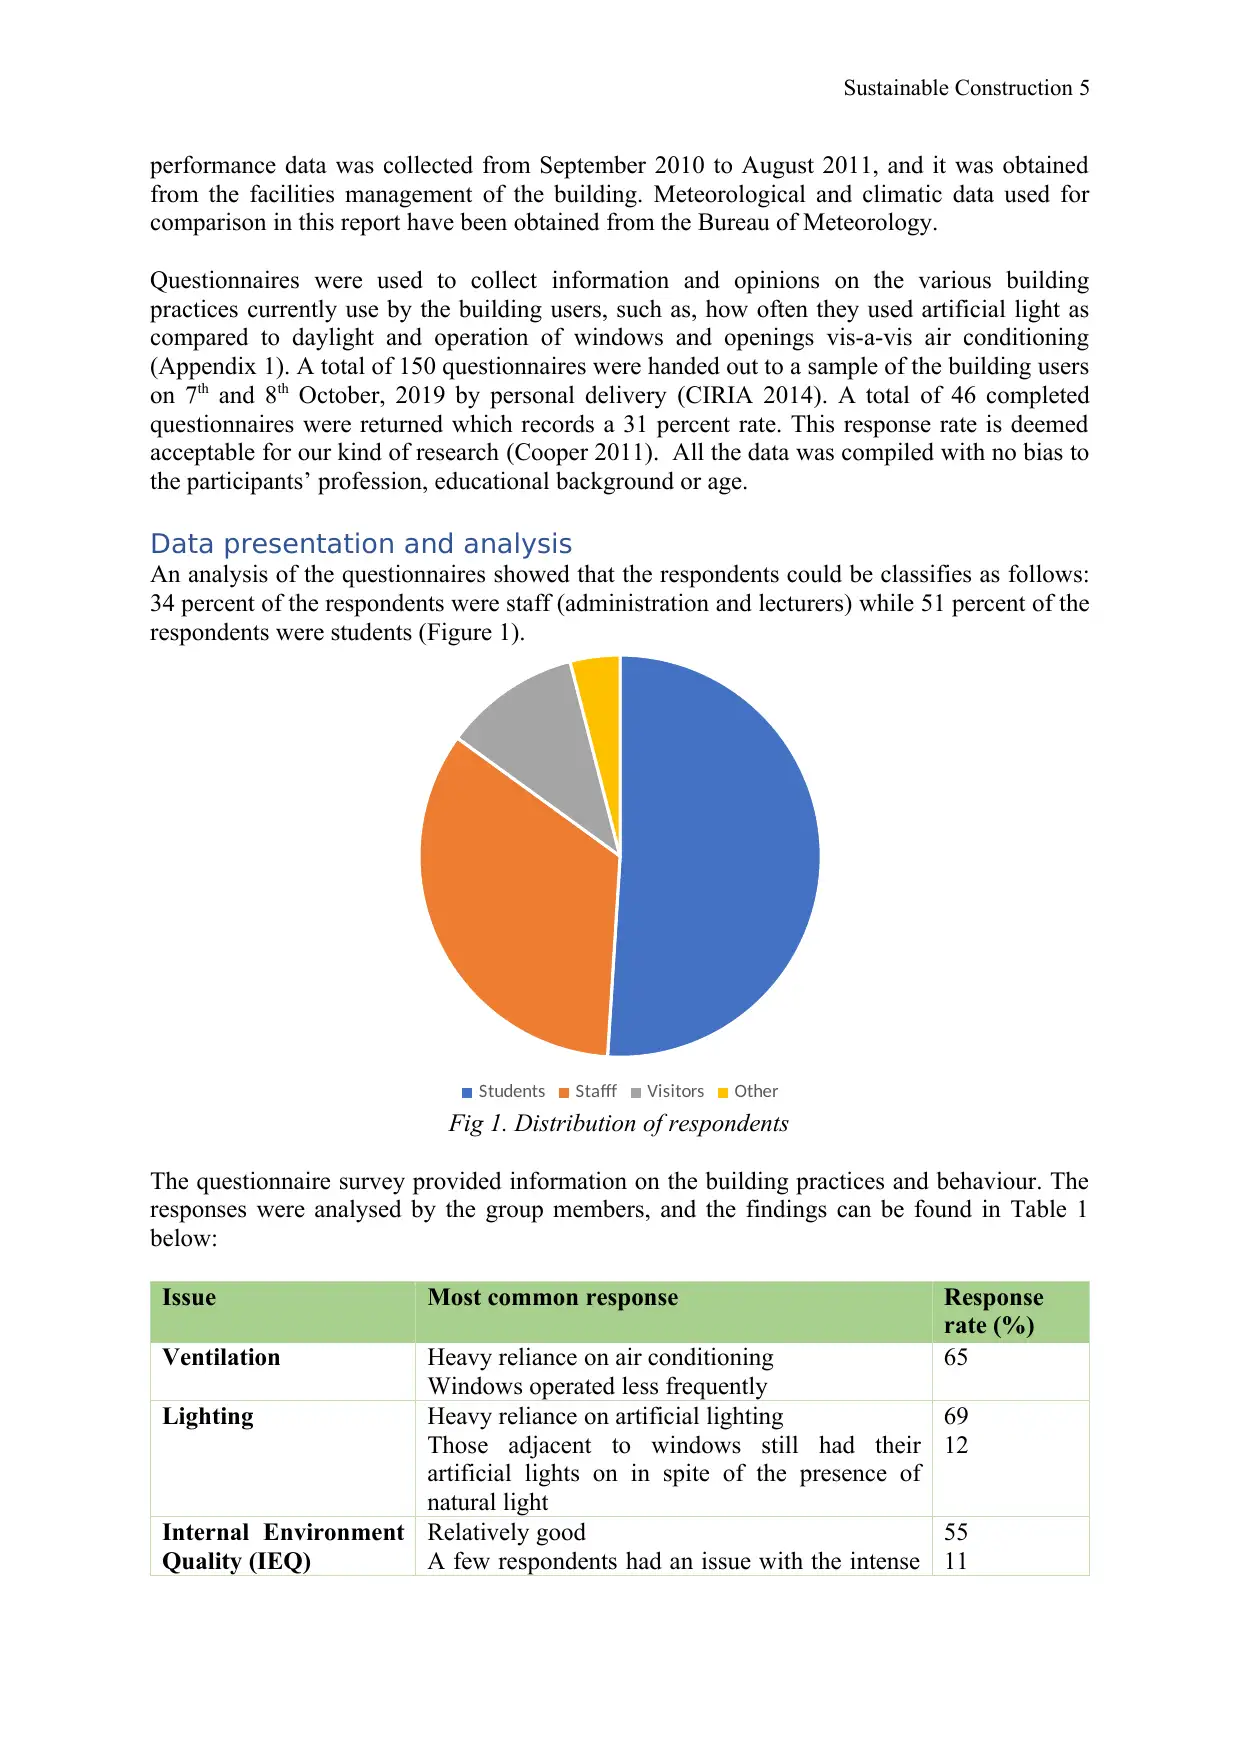
An analysis of the questionnaires showed that the respondents could be classifies as follows:
34 percent of the respondents were staff (administration and lecturers) while 51 percent of the
respondents were students (Figure 1).
Students Stafff Visitors Other
Fig 1. Distribution of respondents
The questionnaire survey provided information on the building practices and behaviour. The
responses were analysed by the group members, and the findings can be found in Table 1
below:
Issue Most common response Response
rate (%)
Ventilation Heavy reliance on air conditioning
Windows operated less frequently
65
Lighting Heavy reliance on artificial lighting
Those adjacent to windows still had their
artificial lights on in spite of the presence of
natural light
69
12
Internal Environment
Quality (IEQ)
Relatively good
A few respondents had an issue with the intense
55
11
performance data was collected from September 2010 to August 2011, and it was obtained
from the facilities management of the building. Meteorological and climatic data used for
comparison in this report have been obtained from the Bureau of Meteorology.
Questionnaires were used to collect information and opinions on the various building
practices currently use by the building users, such as, how often they used artificial light as
compared to daylight and operation of windows and openings vis-a-vis air conditioning
(Appendix 1). A total of 150 questionnaires were handed out to a sample of the building users
on 7th and 8th October, 2019 by personal delivery (CIRIA 2014). A total of 46 completed
questionnaires were returned which records a 31 percent rate. This response rate is deemed
acceptable for our kind of research (Cooper 2011). All the data was compiled with no bias to
the participants’ profession, educational background or age.
Data presentation and analysis
An analysis of the questionnaires showed that the respondents could be classifies as follows:
34 percent of the respondents were staff (administration and lecturers) while 51 percent of the
respondents were students (Figure 1).
Students Stafff Visitors Other
Fig 1. Distribution of respondents
The questionnaire survey provided information on the building practices and behaviour. The
responses were analysed by the group members, and the findings can be found in Table 1
below:
Issue Most common response Response
rate (%)
Ventilation Heavy reliance on air conditioning
Windows operated less frequently
65
Lighting Heavy reliance on artificial lighting
Those adjacent to windows still had their
artificial lights on in spite of the presence of
natural light
69
12
Internal Environment
Quality (IEQ)
Relatively good
A few respondents had an issue with the intense
55
11
Sustainable Construction 6
air conditioning
Water Most people had no idea on the source, or if the
water was re-used and recycled
61
Waste disposal Majority of the respondents disposed waste in
the designated areas
It was the opinion of the majority of the
respondents that the disposal systems could be
improved
73
71
Table1. Response from the questionnaires
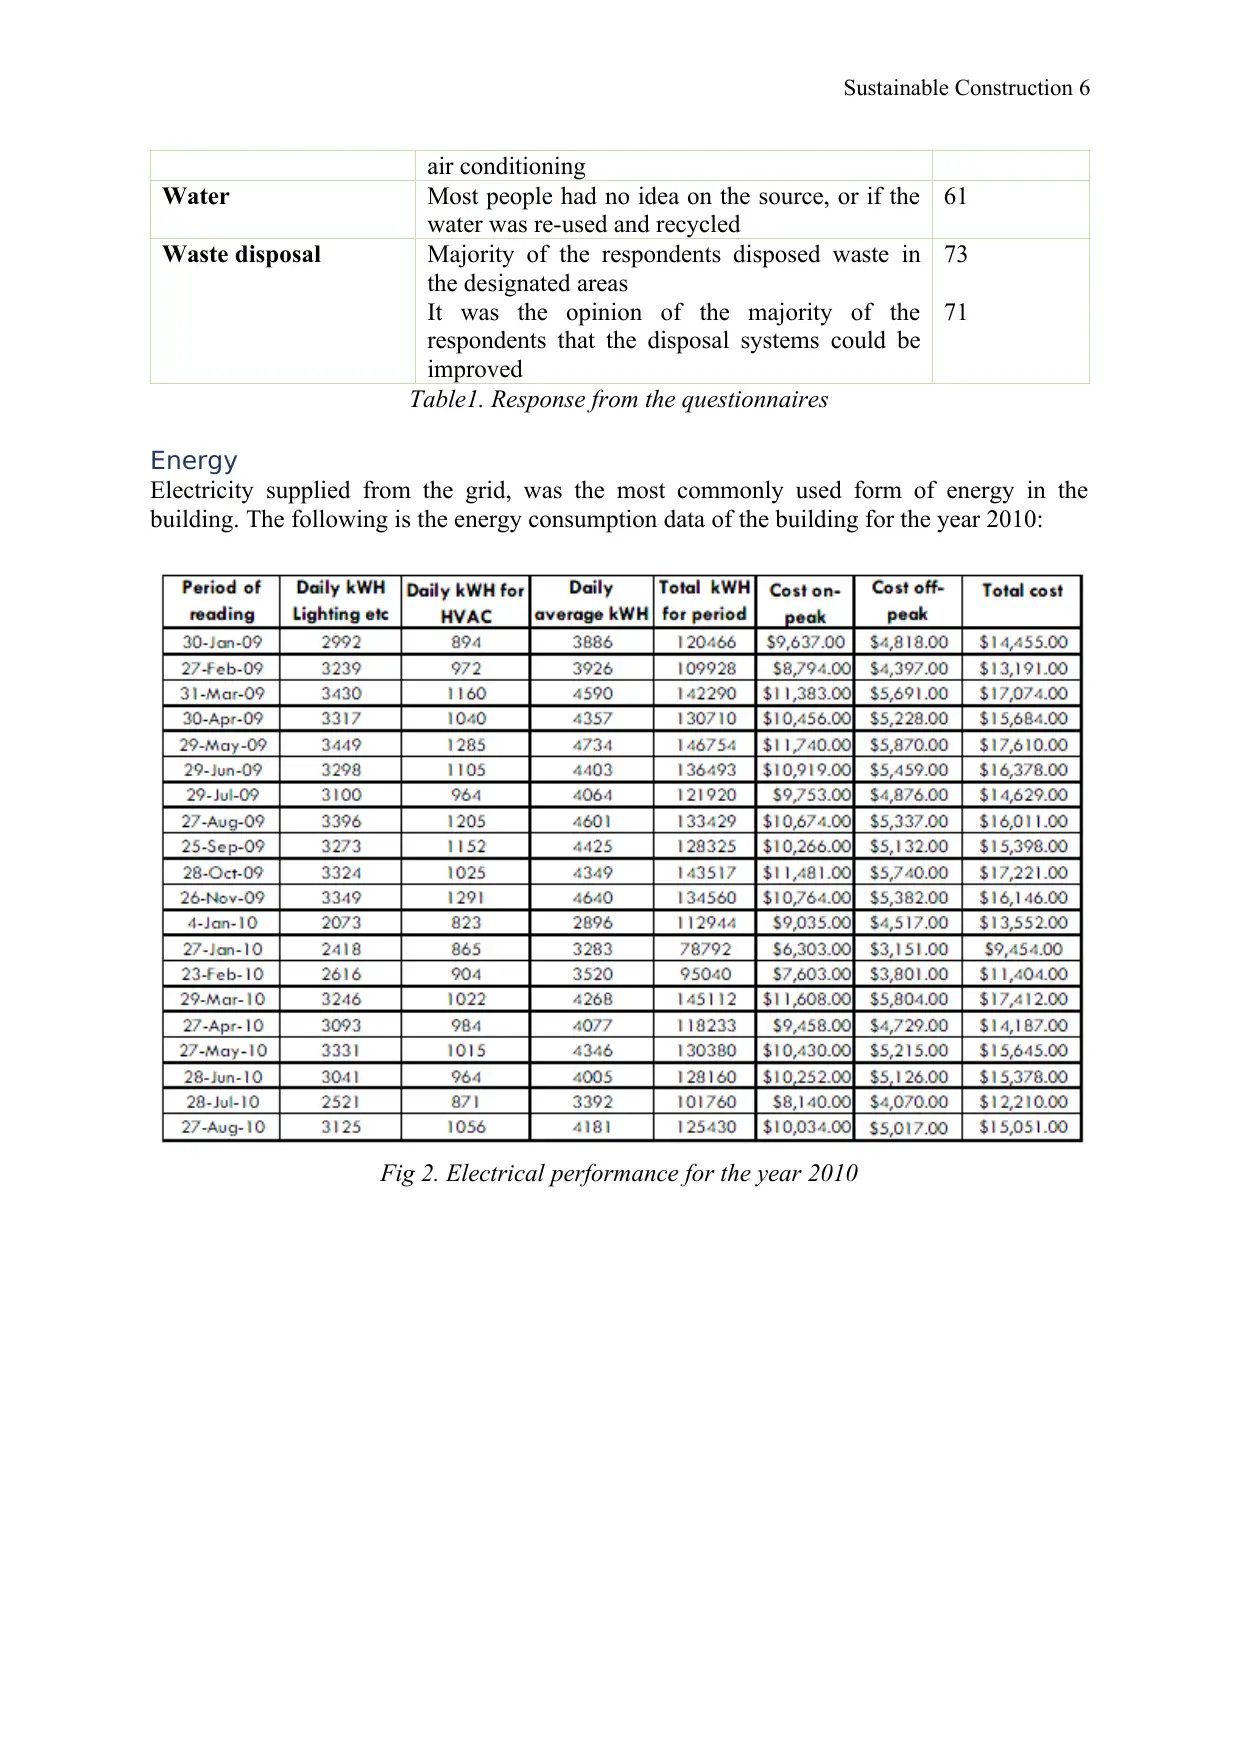
Energy
Electricity supplied from the grid, was the most commonly used form of energy in the
building. The following is the energy consumption data of the building for the year 2010:
Fig 2. Electrical performance for the year 2010
air conditioning
Water Most people had no idea on the source, or if the
water was re-used and recycled
61
Waste disposal Majority of the respondents disposed waste in
the designated areas
It was the opinion of the majority of the
respondents that the disposal systems could be
improved
73
71
Table1. Response from the questionnaires
Energy
Electricity supplied from the grid, was the most commonly used form of energy in the
building. The following is the energy consumption data of the building for the year 2010:
Fig 2. Electrical performance for the year 2010
⊘ This is a preview!⊘
Do you want full access?
Subscribe today to unlock all pages.
Trusted by 1+ million students worldwide
Sustainable Construction 7
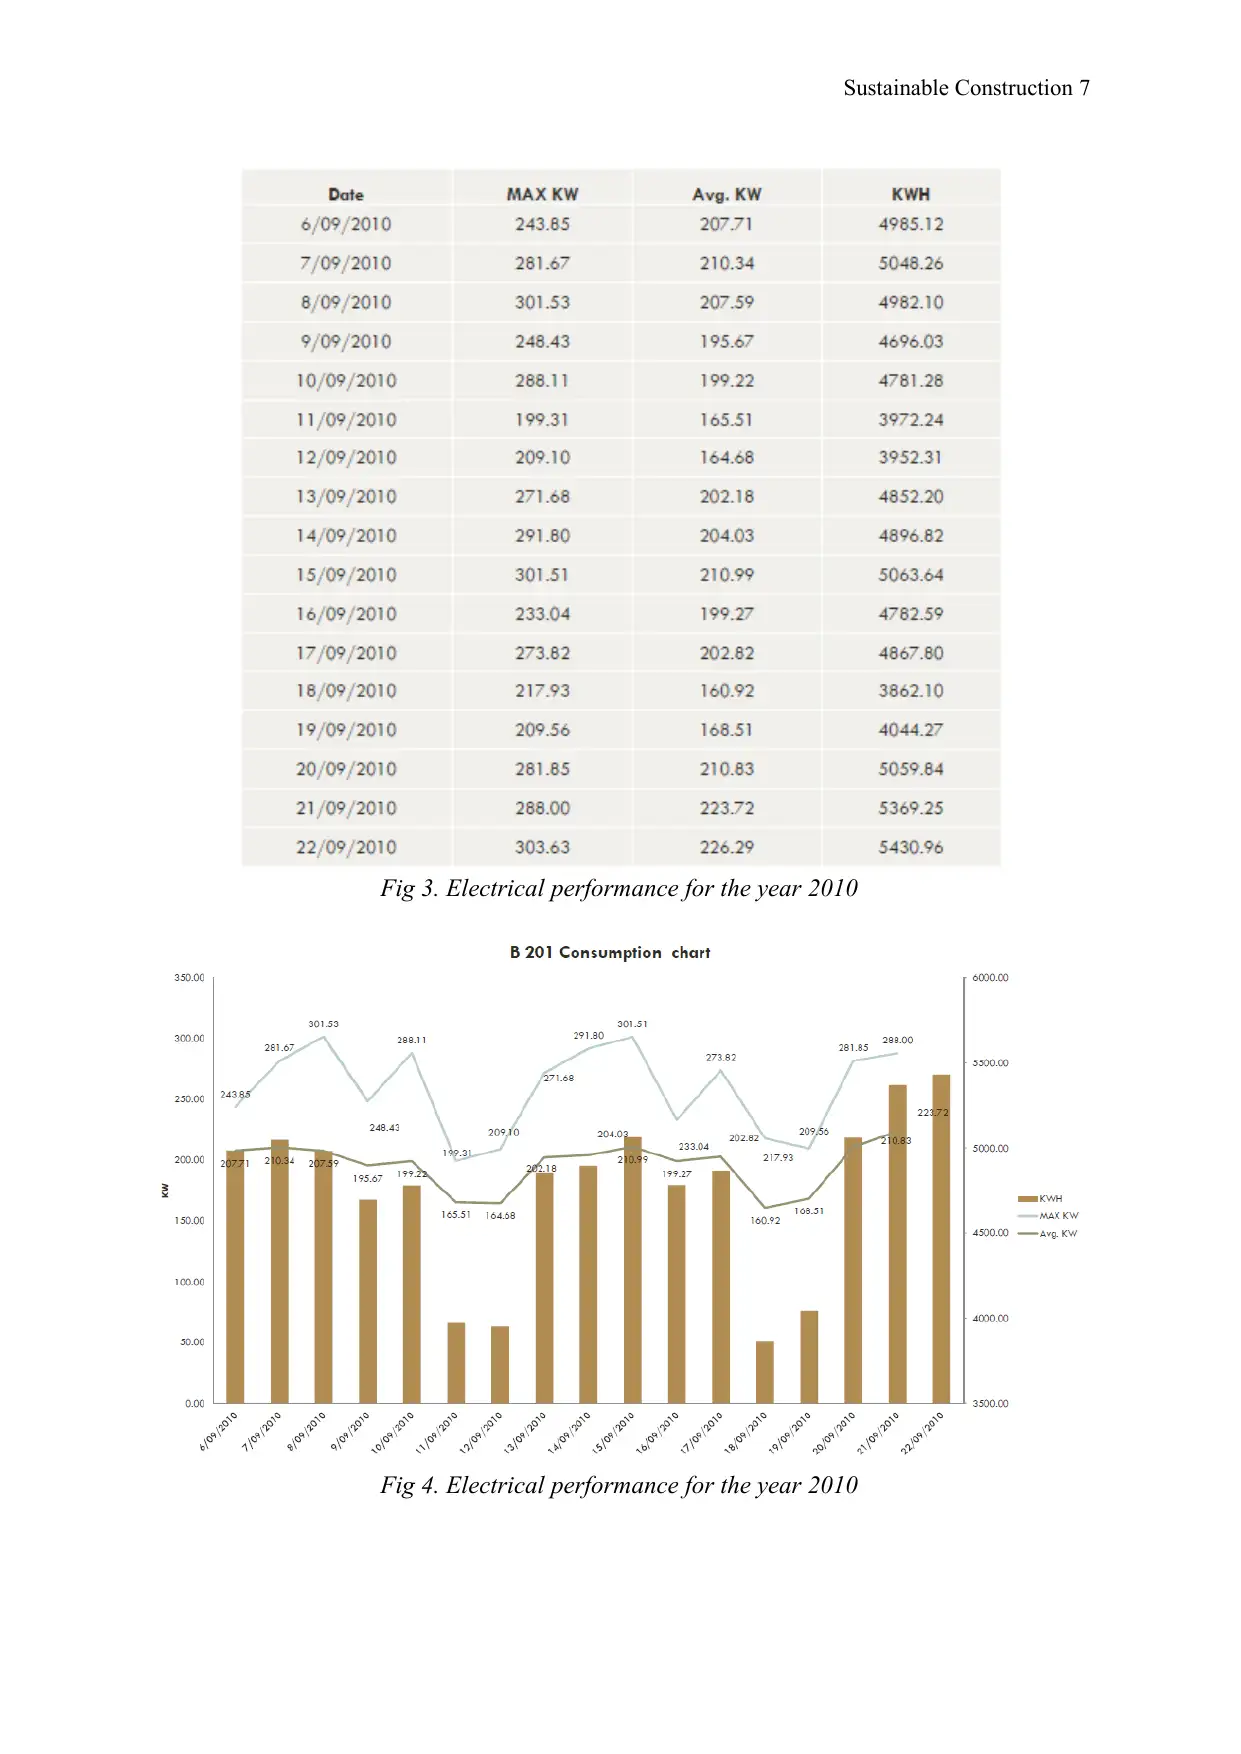
Fig 3. Electrical performance for the year 2010
Fig 4. Electrical performance for the year 2010
Fig 3. Electrical performance for the year 2010
Fig 4. Electrical performance for the year 2010
Paraphrase This Document
Need a fresh take? Get an instant paraphrase of this document with our AI Paraphraser
Sustainable Construction 8
From the data above air conditioning takes up over 25 percent while lighting takes the
majority 75 percent of the daily electrical consumption. In addition, data obtained from the
questionnaires showed that majority of the respondents rely heavily on artificial lighting,
even when there is sufficient day light. In addition, electricity consumption was highest in the
months of April-May, and August-September. This may be attributed to the cold
temperatures and cloudy skies of the winter season that takes place between June to August.
Weather and climate
Building 201 is located within a hot and wet climate that may be classified as Cfb Climate
under the Koeppen- Geiger classification. This climate is characterised by tropical air-masses
that cause thunderstorms, moderately warm temperatures, precipitation that is received
throughout the year and dry humilities during winter.
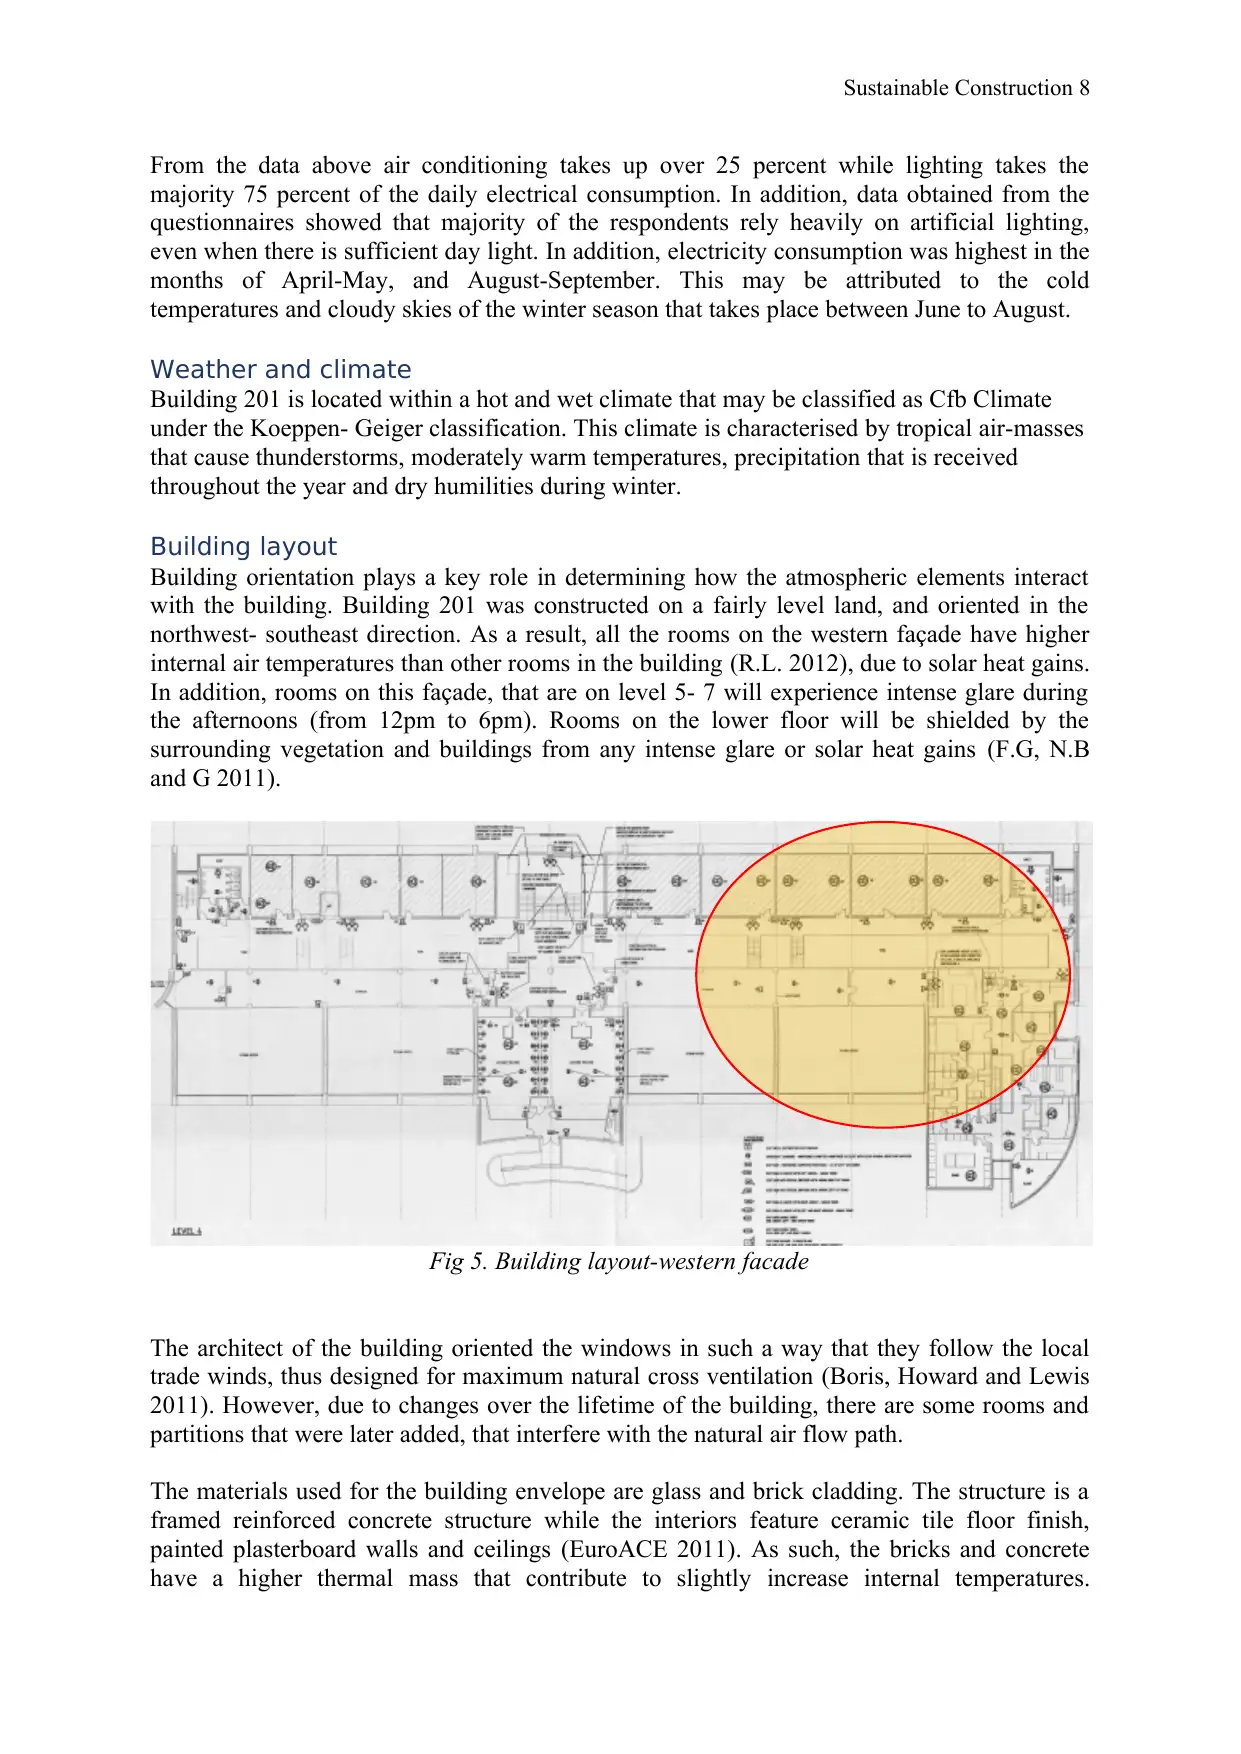
Building layout
Building orientation plays a key role in determining how the atmospheric elements interact
with the building. Building 201 was constructed on a fairly level land, and oriented in the
northwest- southeast direction. As a result, all the rooms on the western façade have higher
internal air temperatures than other rooms in the building (R.L. 2012), due to solar heat gains.
In addition, rooms on this façade, that are on level 5- 7 will experience intense glare during
the afternoons (from 12pm to 6pm). Rooms on the lower floor will be shielded by the
surrounding vegetation and buildings from any intense glare or solar heat gains (F.G, N.B
and G 2011).
Fig 5. Building layout-western facade
The architect of the building oriented the windows in such a way that they follow the local
trade winds, thus designed for maximum natural cross ventilation (Boris, Howard and Lewis
2011). However, due to changes over the lifetime of the building, there are some rooms and
partitions that were later added, that interfere with the natural air flow path.
The materials used for the building envelope are glass and brick cladding. The structure is a
framed reinforced concrete structure while the interiors feature ceramic tile floor finish,
painted plasterboard walls and ceilings (EuroACE 2011). As such, the bricks and concrete
have a higher thermal mass that contribute to slightly increase internal temperatures.
From the data above air conditioning takes up over 25 percent while lighting takes the
majority 75 percent of the daily electrical consumption. In addition, data obtained from the
questionnaires showed that majority of the respondents rely heavily on artificial lighting,
even when there is sufficient day light. In addition, electricity consumption was highest in the
months of April-May, and August-September. This may be attributed to the cold
temperatures and cloudy skies of the winter season that takes place between June to August.
Weather and climate
Building 201 is located within a hot and wet climate that may be classified as Cfb Climate
under the Koeppen- Geiger classification. This climate is characterised by tropical air-masses
that cause thunderstorms, moderately warm temperatures, precipitation that is received
throughout the year and dry humilities during winter.
Building layout
Building orientation plays a key role in determining how the atmospheric elements interact
with the building. Building 201 was constructed on a fairly level land, and oriented in the
northwest- southeast direction. As a result, all the rooms on the western façade have higher
internal air temperatures than other rooms in the building (R.L. 2012), due to solar heat gains.
In addition, rooms on this façade, that are on level 5- 7 will experience intense glare during
the afternoons (from 12pm to 6pm). Rooms on the lower floor will be shielded by the
surrounding vegetation and buildings from any intense glare or solar heat gains (F.G, N.B
and G 2011).
Fig 5. Building layout-western facade
The architect of the building oriented the windows in such a way that they follow the local
trade winds, thus designed for maximum natural cross ventilation (Boris, Howard and Lewis
2011). However, due to changes over the lifetime of the building, there are some rooms and
partitions that were later added, that interfere with the natural air flow path.
The materials used for the building envelope are glass and brick cladding. The structure is a
framed reinforced concrete structure while the interiors feature ceramic tile floor finish,
painted plasterboard walls and ceilings (EuroACE 2011). As such, the bricks and concrete
have a higher thermal mass that contribute to slightly increase internal temperatures.
Sustainable Construction 9
However, considering the climate of the locale, these heat gains cause minimal discomfort to
the users. The interior partitions have 6mm fibreglass insulation, which was installed mainly
for acoustic purposes, but also acts as a thermal mass.
Fresh water in the building is sourced from the local authority’s mains, and stored in
underground tanks. For most of the year, only 16 percent of the water is heated, while during
the winter its usage increases to 43 percent. The water is heated by electrical heaters, which
may contribute to high electricity consumption. As such, the group members find it fitting to
use renewable energy for this purpose, e.g., solar water heating.
Internal Environmental Quality (IEQ)
An optimum indoor environment is paramount in ensuring the productivity of the building’s
users. IEQ is determined the internal air temperature, internal humidity, ventilation, lighting
and glare. In this section, all these factors will be analysed in relation to Building 201. Data
from the questionnaires revealed that majority of the respondents thought that the internal
working environment was relatively good, but could use some improvement.
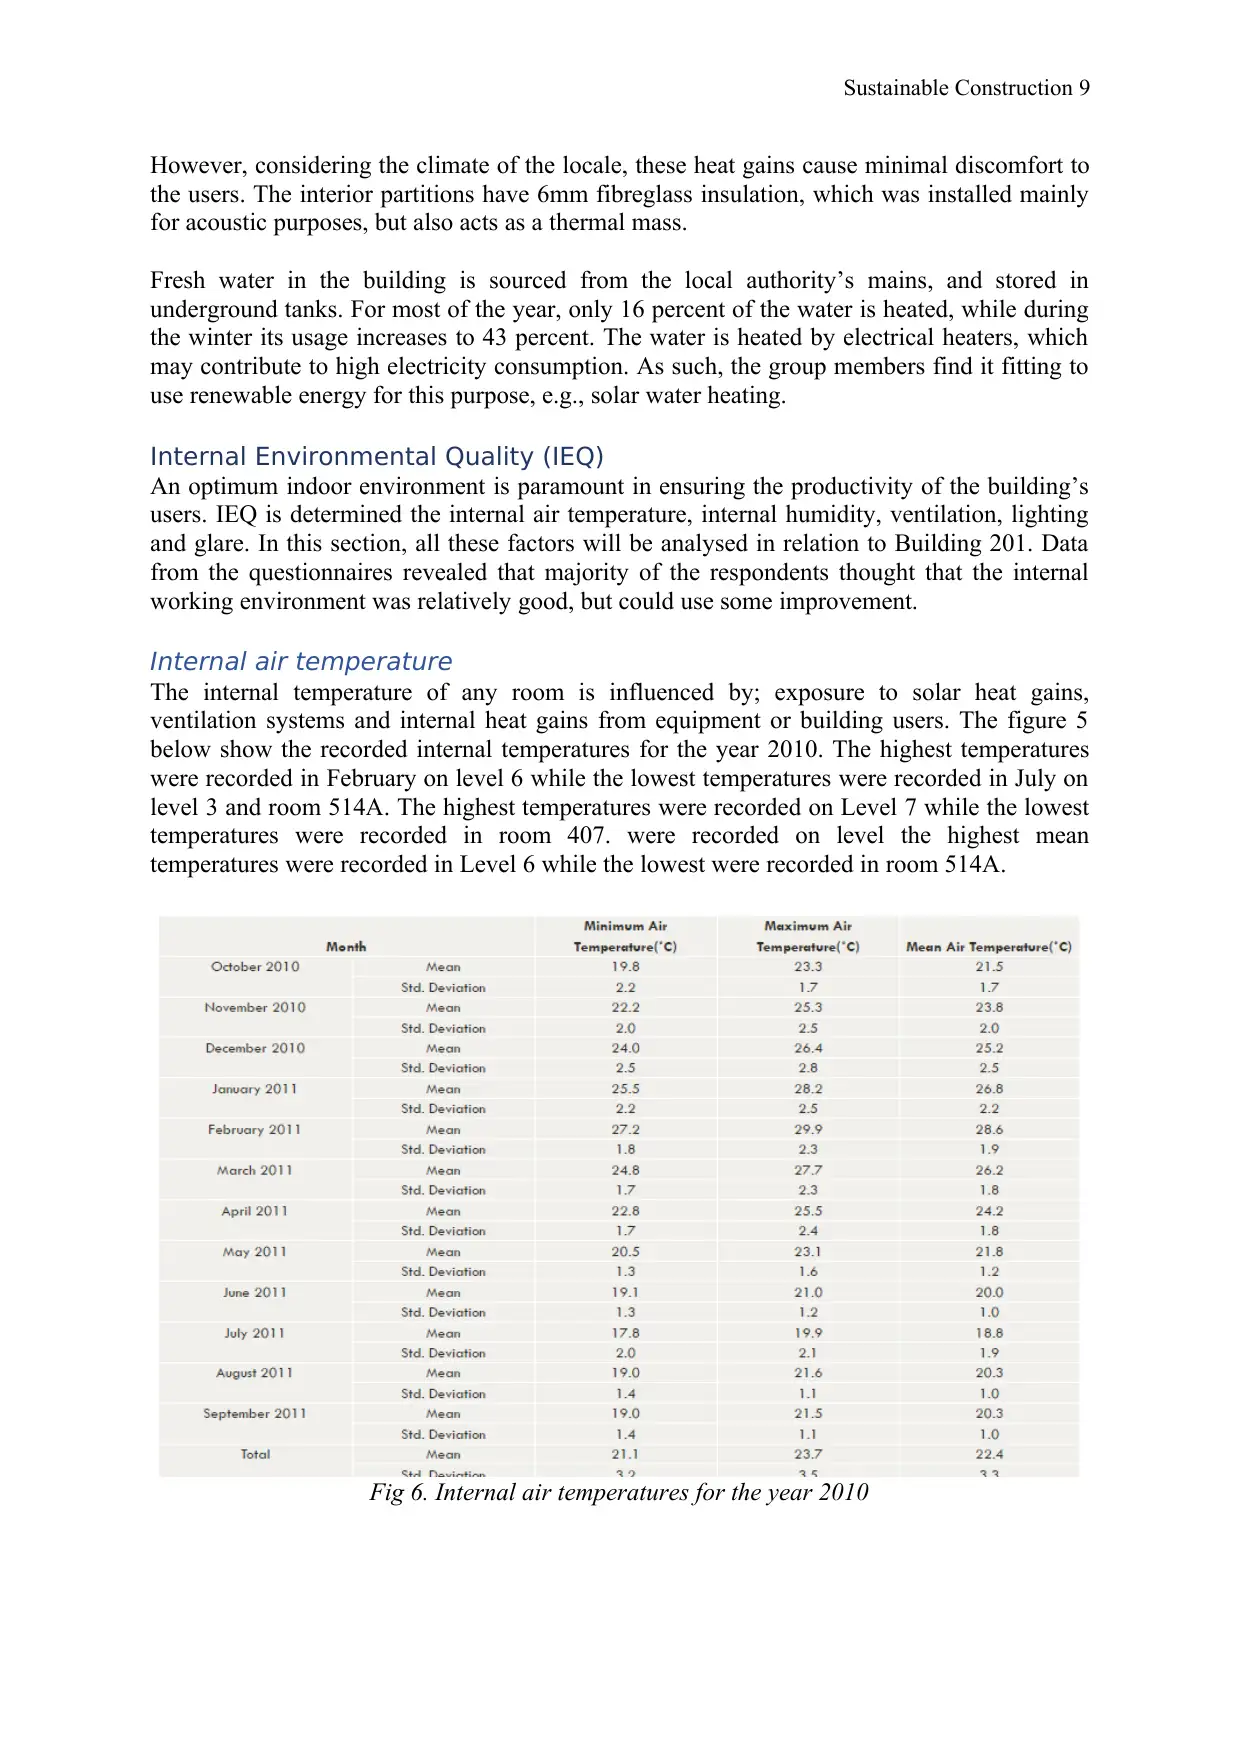
Internal air temperature
The internal temperature of any room is influenced by; exposure to solar heat gains,
ventilation systems and internal heat gains from equipment or building users. The figure 5
below show the recorded internal temperatures for the year 2010. The highest temperatures
were recorded in February on level 6 while the lowest temperatures were recorded in July on
level 3 and room 514A. The highest temperatures were recorded on Level 7 while the lowest
temperatures were recorded in room 407. were recorded on level the highest mean
temperatures were recorded in Level 6 while the lowest were recorded in room 514A.
Fig 6. Internal air temperatures for the year 2010
However, considering the climate of the locale, these heat gains cause minimal discomfort to
the users. The interior partitions have 6mm fibreglass insulation, which was installed mainly
for acoustic purposes, but also acts as a thermal mass.
Fresh water in the building is sourced from the local authority’s mains, and stored in
underground tanks. For most of the year, only 16 percent of the water is heated, while during
the winter its usage increases to 43 percent. The water is heated by electrical heaters, which
may contribute to high electricity consumption. As such, the group members find it fitting to
use renewable energy for this purpose, e.g., solar water heating.
Internal Environmental Quality (IEQ)
An optimum indoor environment is paramount in ensuring the productivity of the building’s
users. IEQ is determined the internal air temperature, internal humidity, ventilation, lighting
and glare. In this section, all these factors will be analysed in relation to Building 201. Data
from the questionnaires revealed that majority of the respondents thought that the internal
working environment was relatively good, but could use some improvement.
Internal air temperature
The internal temperature of any room is influenced by; exposure to solar heat gains,
ventilation systems and internal heat gains from equipment or building users. The figure 5
below show the recorded internal temperatures for the year 2010. The highest temperatures
were recorded in February on level 6 while the lowest temperatures were recorded in July on
level 3 and room 514A. The highest temperatures were recorded on Level 7 while the lowest
temperatures were recorded in room 407. were recorded on level the highest mean
temperatures were recorded in Level 6 while the lowest were recorded in room 514A.
Fig 6. Internal air temperatures for the year 2010
⊘ This is a preview!⊘
Do you want full access?
Subscribe today to unlock all pages.
Trusted by 1+ million students worldwide
Sustainable Construction 10
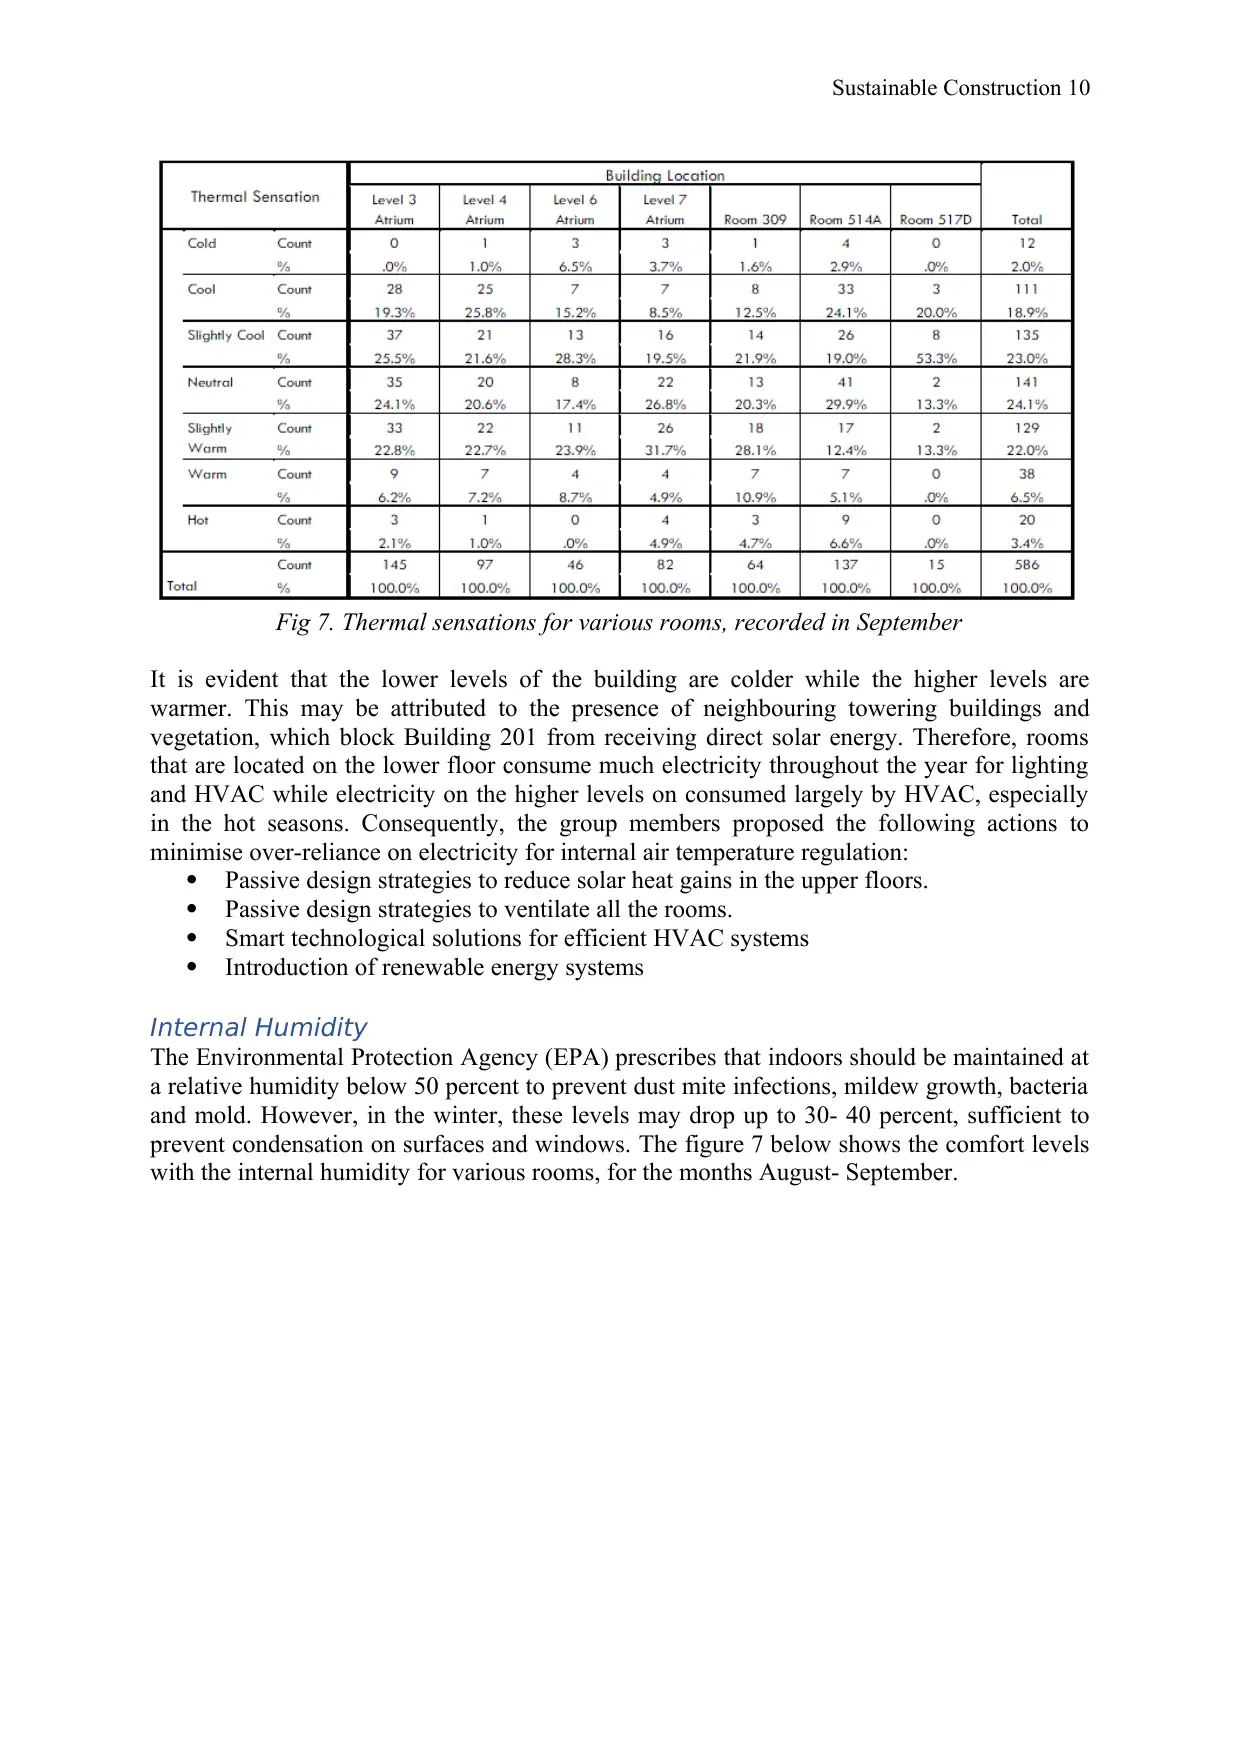
Fig 7. Thermal sensations for various rooms, recorded in September
It is evident that the lower levels of the building are colder while the higher levels are
warmer. This may be attributed to the presence of neighbouring towering buildings and
vegetation, which block Building 201 from receiving direct solar energy. Therefore, rooms
that are located on the lower floor consume much electricity throughout the year for lighting
and HVAC while electricity on the higher levels on consumed largely by HVAC, especially
in the hot seasons. Consequently, the group members proposed the following actions to
minimise over-reliance on electricity for internal air temperature regulation:
Passive design strategies to reduce solar heat gains in the upper floors.
Passive design strategies to ventilate all the rooms.
Smart technological solutions for efficient HVAC systems
Introduction of renewable energy systems
Internal Humidity
The Environmental Protection Agency (EPA) prescribes that indoors should be maintained at
a relative humidity below 50 percent to prevent dust mite infections, mildew growth, bacteria
and mold. However, in the winter, these levels may drop up to 30- 40 percent, sufficient to
prevent condensation on surfaces and windows. The figure 7 below shows the comfort levels
with the internal humidity for various rooms, for the months August- September.
Paraphrase This Document
Need a fresh take? Get an instant paraphrase of this document with our AI Paraphraser
Sustainable Construction 11
Fig 8. Internal Humidity levels for the months August- September
Majority of the respondents indicated that the humidity in most rooms and floors to be just
right with an exception of room 309 and room 517D that were noted to be quite dry. The
relative humidity in these rooms is below 30 percent which may be attributed to the following
reason; since it was the end of winter, the outside air, with a low dewpoint, was heated and
thus lost water-vapour. The group members proposed the following solutions:
Checking the mentioned rooms for any heat source or equipment
Addition of sustainable humidifiers in these rooms.
Check the building materials, for those that have high thermal mass
Ventilation
It was observed during the site visit that 89 percent of the rooms had access to window
openings while 10 percent of the rooms had permanent ventilation orifices. However, over 54
percent of the windows were not opened, thus rendering natural ventilation ineffective. Over
81 percent of the rooms heavily relied on air conditioning. As such, HVAC contributes over
25 percent of the building’s energy consumption. In order to improve the sustainability index,
the group member suggest the following measures:
Re-arrange some rooms and partitions that may interfere with the natural air-flow.
Smart technologies that use minimal energy for operations
Installation of renewable energy to power HVAC.
Lighting
During the site reconnaissance, it was observed that 89 percent of the rooms had access to
exterior lighting via large steel windows. However, artificial light was still used in the
majority of these rooms. It was observed that the rooms on the lower levels obtained limited
day-light due to the presence of vegetation or neighbouring tall buildings. It was also
observed that the higher levels had artificial lights on due to force of habit. All the artificial
light relied on electricity obtained from the grid. Following these findings, the group
members propose the following measures:
Smart technologies that turn off artificial lights when there is sufficient daylight in the
room
Sustainable Construction 12
Installation of renewable energy-powered lighting, e.g., solar energy
Use colours and materials that reflect more light in the lower floors, to reflect the
available daylight
Glare
The group members observed on site that the envelope of the building consisted of mostly
glass and brick members. The building itself is neighboured by multi-storey buildings, which
have an average of 4 floors and averagely sparsed vegetation. As such, the rooms on the
lower floor are shielded from the sun, and may require minimum glare treatment. However,
the rooms from Level 5-7 experience intense glare during the afternoons, especially on the
rooms located on western side. Therefore, the windows in these rooms will require glare
treatment.
⊘ This is a preview!⊘
Do you want full access?
Subscribe today to unlock all pages.
Trusted by 1+ million students worldwide
1 out of 19
Related Documents


Your All-in-One AI-Powered Toolkit for Academic Success.
+13062052269
info@desklib.com
Available 24*7 on WhatsApp / Email
![[object Object]](/_next/static/media/star-bottom.7253800d.svg)
Unlock your academic potential
Copyright © 2020–2026 A2Z Services. All Rights Reserved. Developed and managed by ZUCOL.