Sustainable Energy: Global Trends and Projections Report
VerifiedAdded on 2022/09/15
|12
|2483
|28
Report
AI Summary
This report provides an in-depth analysis of sustainable energy, focusing on global trends in energy consumption, production, and future projections. The executive summary highlights the urgent need for renewable energy sources to combat climate change, emphasizing the importance of reducing fossil fuel consumption. The introduction establishes energy's crucial role in economic activities and the environmental impact of fossil fuels. The data analysis section examines global energy consumption by region and source, revealing a shift from fossil fuels to renewable energy, with Asia Pacific becoming the largest energy consumer. The report also explores investments in renewable energy production, highlighting China's significant growth and the projected rise in global investment. Furthermore, it analyzes global energy demand by fuel, projecting a decrease in the share of oil and coal, and a substantial increase in renewable energy sources. The conclusion synthesizes the findings, noting the discrepancy between past predictions and actual energy trends, while emphasizing the continued growth of low-carbon fuels and the advancement of technology in renewable energy. The report uses various sources like OurWorldInData.org, BP, and IEA to support its claims.
Sustainability 1
Sustainable energy
By (name):
College:
Date:
Sustainable energy
By (name):
College:
Date:
Paraphrase This Document
Need a fresh take? Get an instant paraphrase of this document with our AI Paraphraser
Sustainability 2
Executive summary
In comparison with pre-industrial levels, the famous climate accord established in 2015 aims
to lower the mean global temperature increase to less than 2 degrees Celsius. This is only
technically possible with the efficient and effective exploitation of the available renewable
energy sources with their promise of low greenhouse gas emissions. Correspondingly, the
demand and consumption of fossil fuels must be kept as low as possible. Despite the urgent
need for this energy transformation, many governments worldwide still fail to engage the
necessary plans and policies to achieve the reduction in emissions. As a result, the demand
and consumption of fossil fuels have been growing and continues to grow even far into the
future over a projected period of up to 2050. Even though global governments and their
policies appear to have failed to successfully tackle the problem of fossil fuel consumption,
there is a notable increase in the exploitation of renewable energy resources ranging from
solar energy to biofuels such as ethanol-based aviation fuel.
Introduction
Energy is a basic input to a myriad of economic activities globally (Bhattacharyya,
2011). The industrial revolution was driven by the desire and need to harness energy sources
and resources with the aim of replacing manual labor and improving industrial output (Ghosh
& Prelas, 2011). This, in turn, led to rapid social and economic development (Ion, 1975). A
rapid increase in the global population, the consumption of fossil fuels and economic output
was witnessed in the 20th century (German Advisory Council on Global Change, 2014). The
increase in the consumption of fossil fuels has produced immense negative effects on the
environment. Huge quantities of carbon (iv) oxide have been released into the surroundings
which correspondingly has led to the rise in global warming (Larsson, 2012). Currently,
developing countries demand more energy to support their growing manufacturing and
Sustainability 3
processing capabilities (Graaf, Westphal, & Lesage, 2013). It had been predicted that the
global consumption of fossil fuels would fall between 1950 and 2050 with a corresponding
increase in the use and development of renewable energy sources such as solar energy (Hill,
O'Keefe, & Snape, 1995).
Data analysis
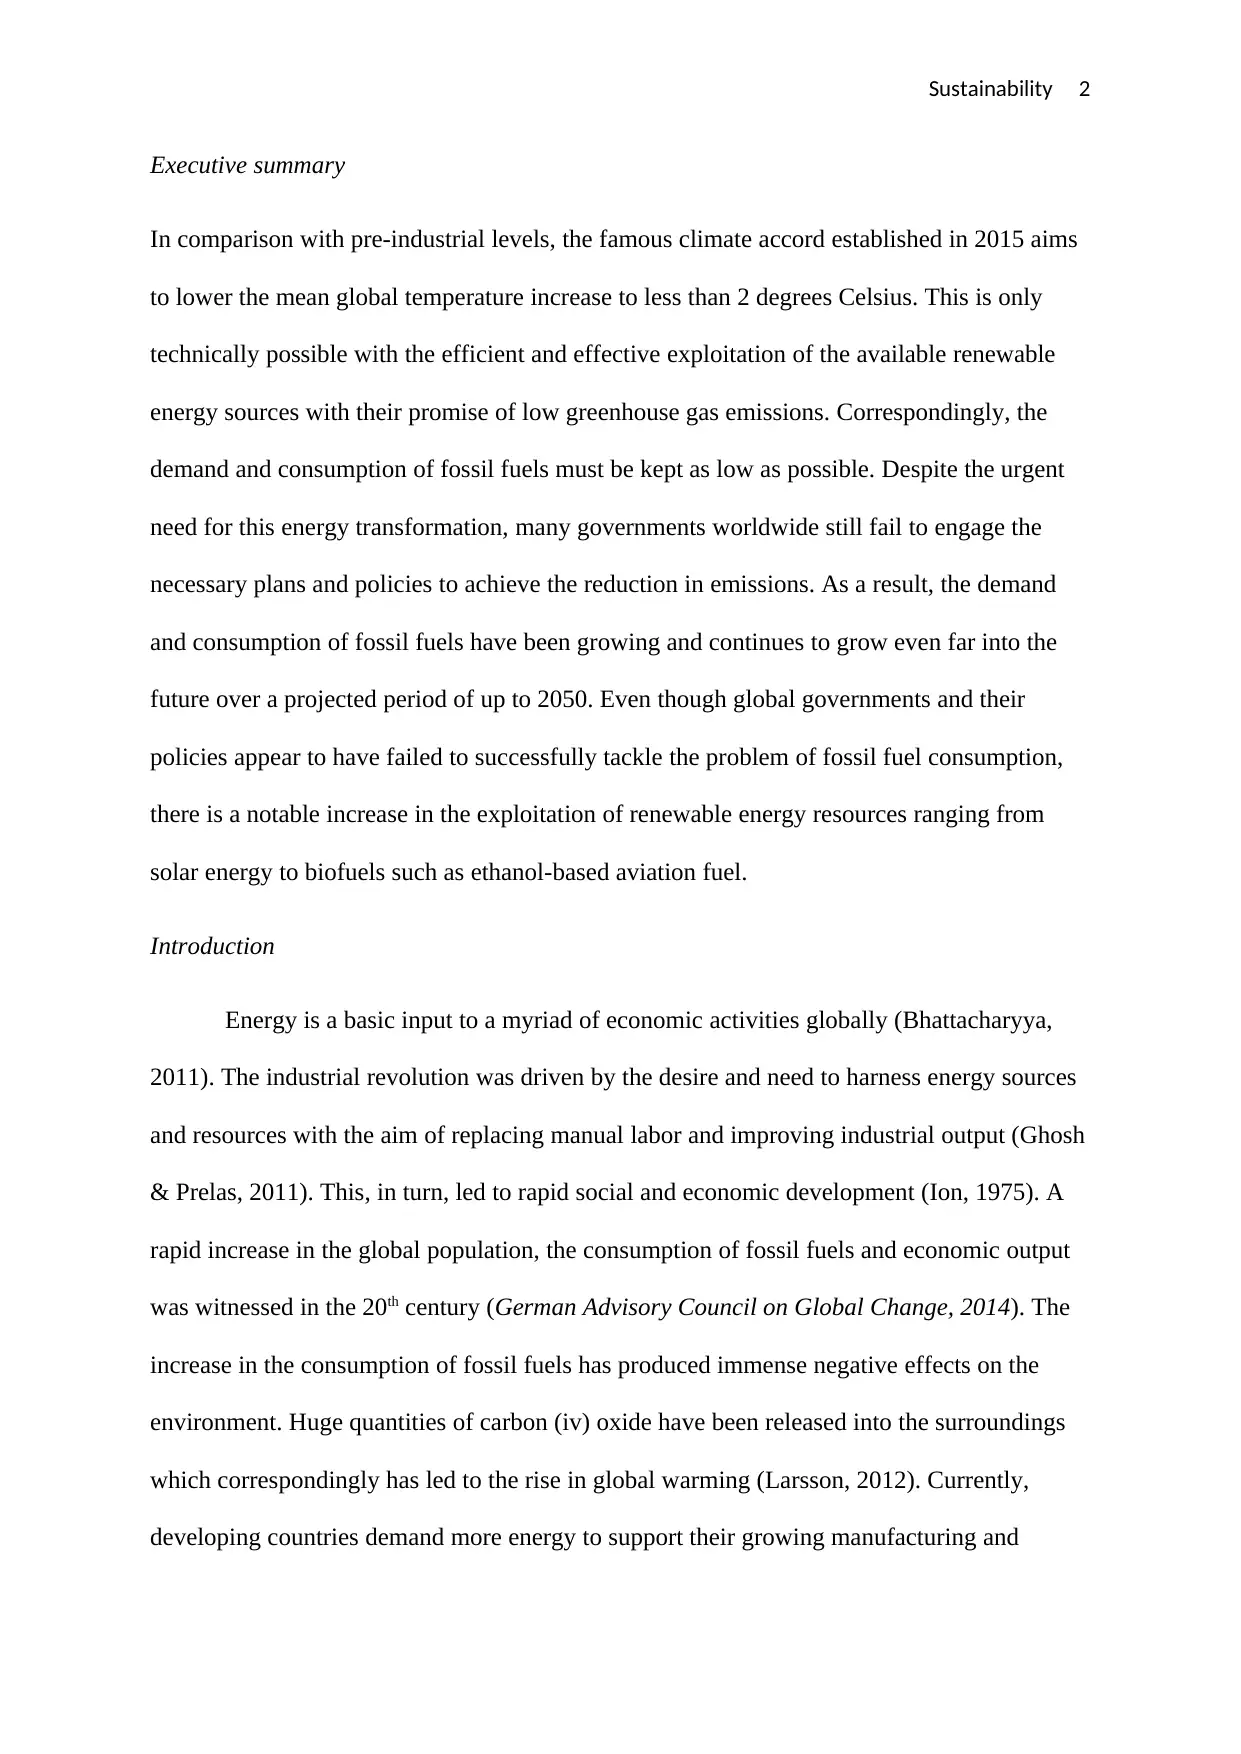
i) Global energy consumption by region.
Figure 1: World's primary energy consumption by region
https://ourworldindata.org/grapher/primary-energy-consumption-by-region
From this chart, it is evident that in 1965 the bulk of the global energy was consumed by
Eurasia and Europe and North America (IRENA, 2018). Their total energy consumption
accounted for over 80 % of the total global energy consumption. The chart shows that despite
the constant increase in energy consumption in these regions from 1965 up to 2015, their
share of the total energy has fallen considerably. Fuel consumption has increased constantly
across the rest of the globe with the consumption in Asia pacific increasing by over 12 times
processing capabilities (Graaf, Westphal, & Lesage, 2013). It had been predicted that the
global consumption of fossil fuels would fall between 1950 and 2050 with a corresponding
increase in the use and development of renewable energy sources such as solar energy (Hill,
O'Keefe, & Snape, 1995).
Data analysis
i) Global energy consumption by region.
Figure 1: World's primary energy consumption by region
https://ourworldindata.org/grapher/primary-energy-consumption-by-region
From this chart, it is evident that in 1965 the bulk of the global energy was consumed by
Eurasia and Europe and North America (IRENA, 2018). Their total energy consumption
accounted for over 80 % of the total global energy consumption. The chart shows that despite
the constant increase in energy consumption in these regions from 1965 up to 2015, their
share of the total energy has fallen considerably. Fuel consumption has increased constantly
across the rest of the globe with the consumption in Asia pacific increasing by over 12 times
⊘ This is a preview!⊘
Do you want full access?
Subscribe today to unlock all pages.
Trusted by 1+ million students worldwide
Sustainability 4
in this period. Consequently, in 2015 the largest regional consumer was Asia Pacific with
about 42 % (IRENA, 2018).
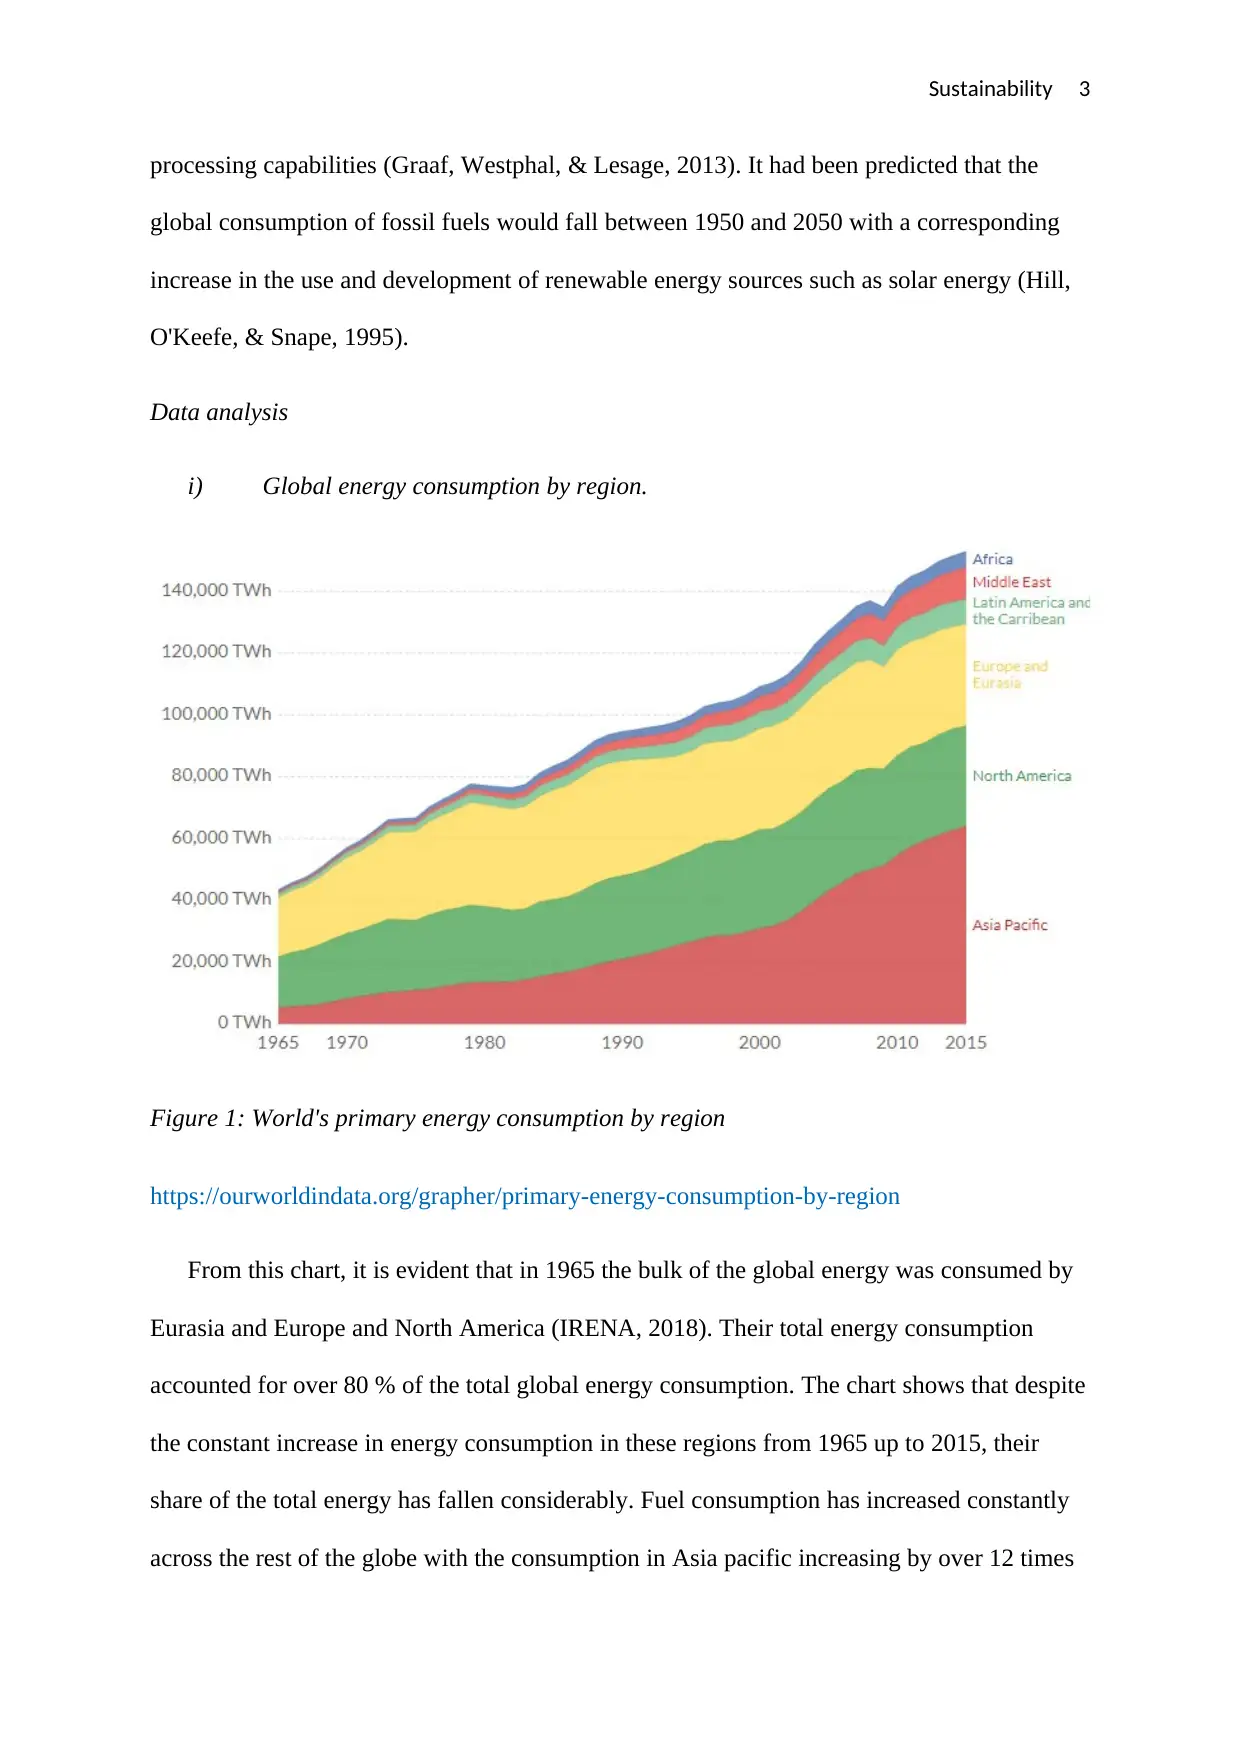
ii) Global energy consumption by source.
Figure 2: Global energy consumption by source projection
https://www.bp.com/en/global/corporate/energy-economics/statistical-review-of-world-
energy.html
It was initially predicted that the consumption of fossil fuels such as coal and oil would
decrease with time. However, the graph clearly shows that this is not the case. The
consumption of fossil fuels has continued to increase generally over the years (Brown, 2012).
The graph shows a relatively steep rise in the total global consumption of all the fuels from
the year 2000 onwards. On the other hand, the prediction had been that the consumption of
renewable energy sources such as hydropower and solar would increase. It is evident from
the graph that this prediction holds true as the consumption of renewable energy shows a
constant increase. The consumption of renewable energy almost doubled in the period
between 2004 and 2015 (IRENA, 2018). The increase in the consumption of renewable
in this period. Consequently, in 2015 the largest regional consumer was Asia Pacific with
about 42 % (IRENA, 2018).
ii) Global energy consumption by source.
Figure 2: Global energy consumption by source projection
https://www.bp.com/en/global/corporate/energy-economics/statistical-review-of-world-
energy.html
It was initially predicted that the consumption of fossil fuels such as coal and oil would
decrease with time. However, the graph clearly shows that this is not the case. The
consumption of fossil fuels has continued to increase generally over the years (Brown, 2012).
The graph shows a relatively steep rise in the total global consumption of all the fuels from
the year 2000 onwards. On the other hand, the prediction had been that the consumption of
renewable energy sources such as hydropower and solar would increase. It is evident from
the graph that this prediction holds true as the consumption of renewable energy shows a
constant increase. The consumption of renewable energy almost doubled in the period
between 2004 and 2015 (IRENA, 2018). The increase in the consumption of renewable
Paraphrase This Document
Need a fresh take? Get an instant paraphrase of this document with our AI Paraphraser
Sustainability 5
energy is due to the policies that have been put in place to counter climate change by
reducing carbon (iv) oxide emissions. This is because renewable energy sources are eco-
friendly, unlike fossil fuels whose potential impacts on the environment cannot be
underestimated.
iii) Investment in renewable energy production.
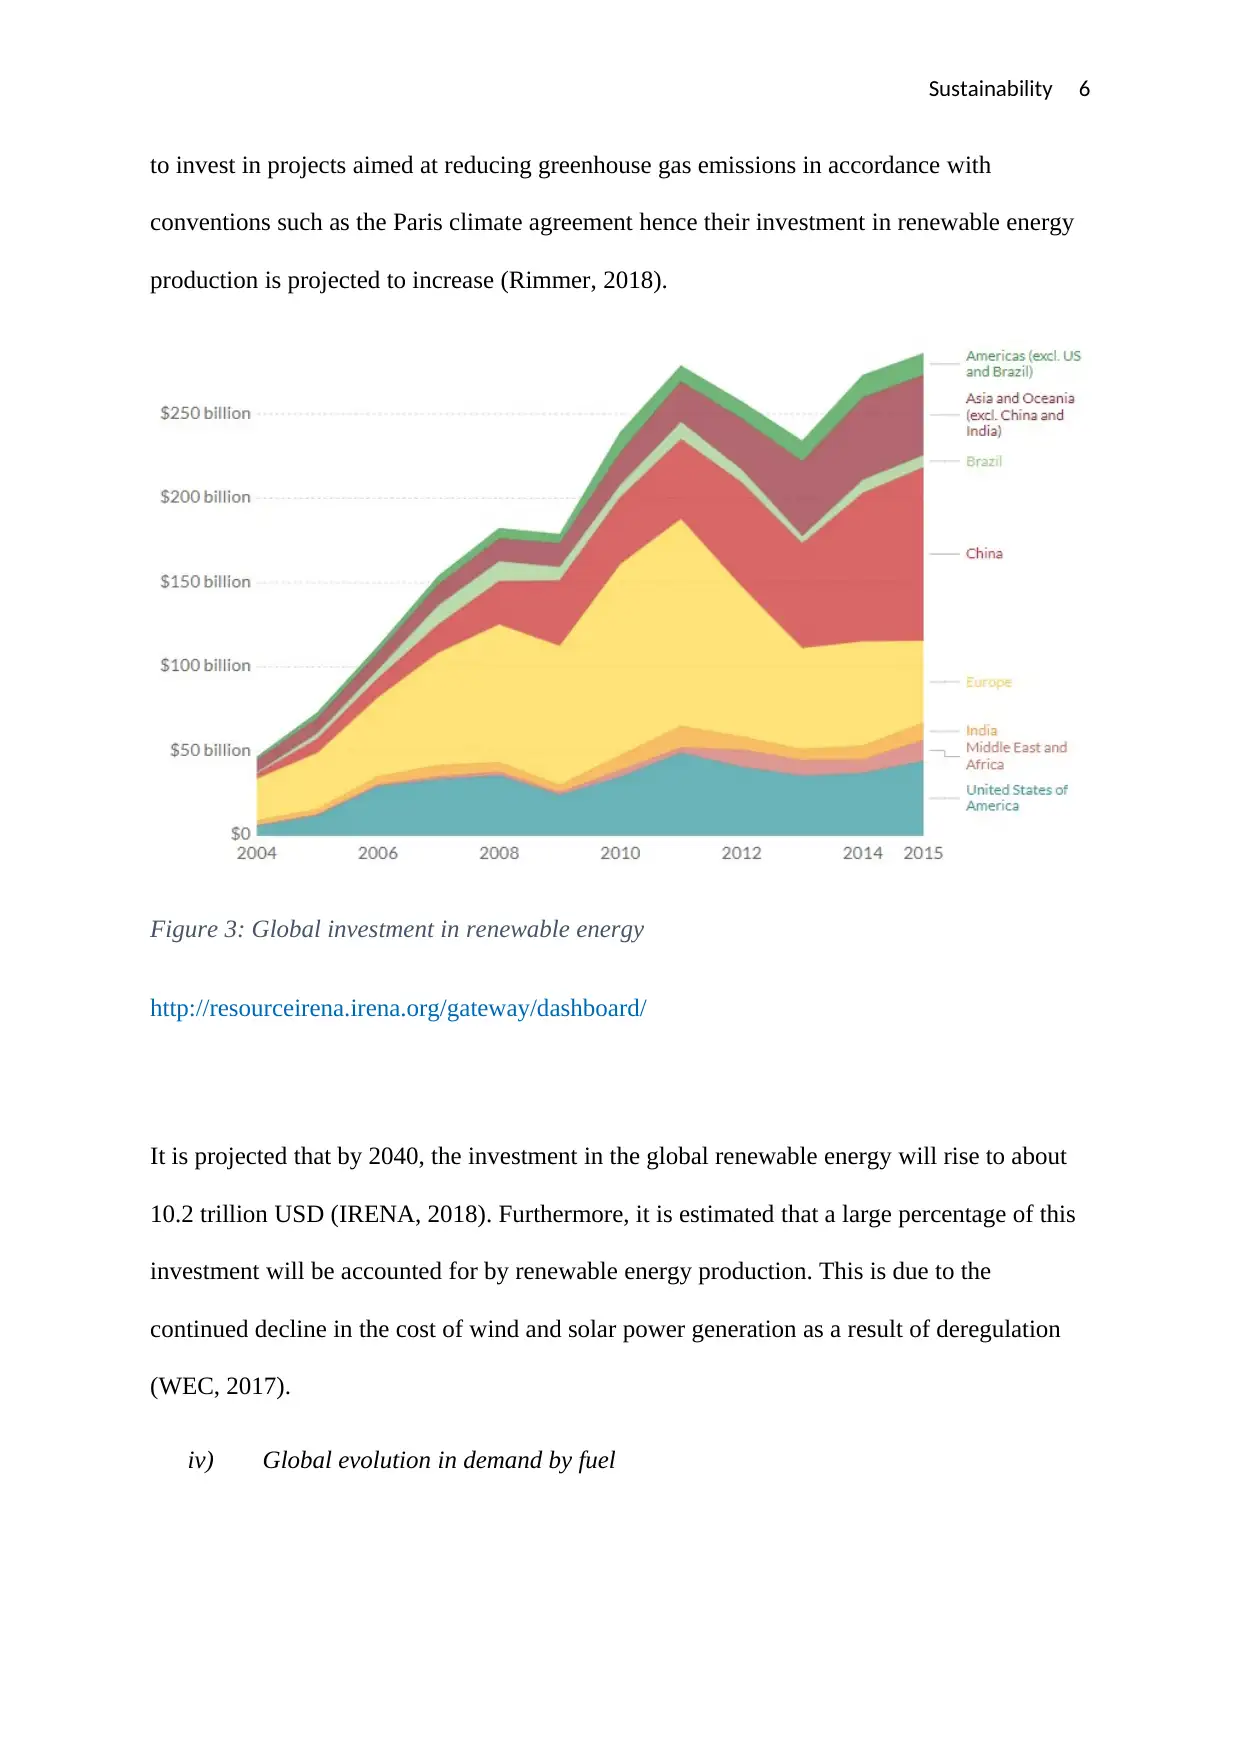
The shift of the global energy production systems from fossil fuels towards sustainable
energy sources requires great commitment and substantial financial investment. The chart
below shows the global investment in renewable energy from the year 2004 to 2015. In 2004,
the global investment was about 47 billion US dollars. By 2015, this had risen to
approximately286 billion US dollars. This represents an increase of over 600 %. The graph
also indicates that investment has generally increased across all the world regions but at
considerably different rates. China has witnessed the highest growth with its investment in
2015 amounting to 103 USD compared to only 3 billion USD in 2004. This represents an
increase of over 3400 % (Hannah Ritchie and Max Roser, 2019). Consequently, China is
currently the largest individual investor in renewable energy production investing as much as
the combination of Europe, India and the United States (Hannah Ritchie and Max Roser,
2019). The investment in renewable energy in the Middle East and Africa is considerably
small with about 0.5 billion USD investment in 2004. However, these regions indicate
considerable growth over the last decade.
Considering the GDPs of different regions, data shows that transitioning economies (low
to middle income) have higher investments compared to high-income economies (WEC,
2017). The fact that low to middle-income nations are likely to invest a higher percentage of
their GDPs in the provision of energy whereas high-income nations have already established
energy systems partly explains this trend. On the other hand, high-income nations are likely
energy is due to the policies that have been put in place to counter climate change by
reducing carbon (iv) oxide emissions. This is because renewable energy sources are eco-
friendly, unlike fossil fuels whose potential impacts on the environment cannot be
underestimated.
iii) Investment in renewable energy production.
The shift of the global energy production systems from fossil fuels towards sustainable
energy sources requires great commitment and substantial financial investment. The chart
below shows the global investment in renewable energy from the year 2004 to 2015. In 2004,
the global investment was about 47 billion US dollars. By 2015, this had risen to
approximately286 billion US dollars. This represents an increase of over 600 %. The graph
also indicates that investment has generally increased across all the world regions but at
considerably different rates. China has witnessed the highest growth with its investment in
2015 amounting to 103 USD compared to only 3 billion USD in 2004. This represents an
increase of over 3400 % (Hannah Ritchie and Max Roser, 2019). Consequently, China is
currently the largest individual investor in renewable energy production investing as much as
the combination of Europe, India and the United States (Hannah Ritchie and Max Roser,
2019). The investment in renewable energy in the Middle East and Africa is considerably
small with about 0.5 billion USD investment in 2004. However, these regions indicate
considerable growth over the last decade.
Considering the GDPs of different regions, data shows that transitioning economies (low
to middle income) have higher investments compared to high-income economies (WEC,
2017). The fact that low to middle-income nations are likely to invest a higher percentage of
their GDPs in the provision of energy whereas high-income nations have already established
energy systems partly explains this trend. On the other hand, high-income nations are likely
Sustainability 6
to invest in projects aimed at reducing greenhouse gas emissions in accordance with
conventions such as the Paris climate agreement hence their investment in renewable energy
production is projected to increase (Rimmer, 2018).
Figure 3: Global investment in renewable energy
http://resourceirena.irena.org/gateway/dashboard/
It is projected that by 2040, the investment in the global renewable energy will rise to about
10.2 trillion USD (IRENA, 2018). Furthermore, it is estimated that a large percentage of this
investment will be accounted for by renewable energy production. This is due to the
continued decline in the cost of wind and solar power generation as a result of deregulation
(WEC, 2017).
iv) Global evolution in demand by fuel
⊘ This is a preview!⊘
Do you want full access?
Subscribe today to unlock all pages.
Trusted by 1+ million students worldwide
Sustainability 7
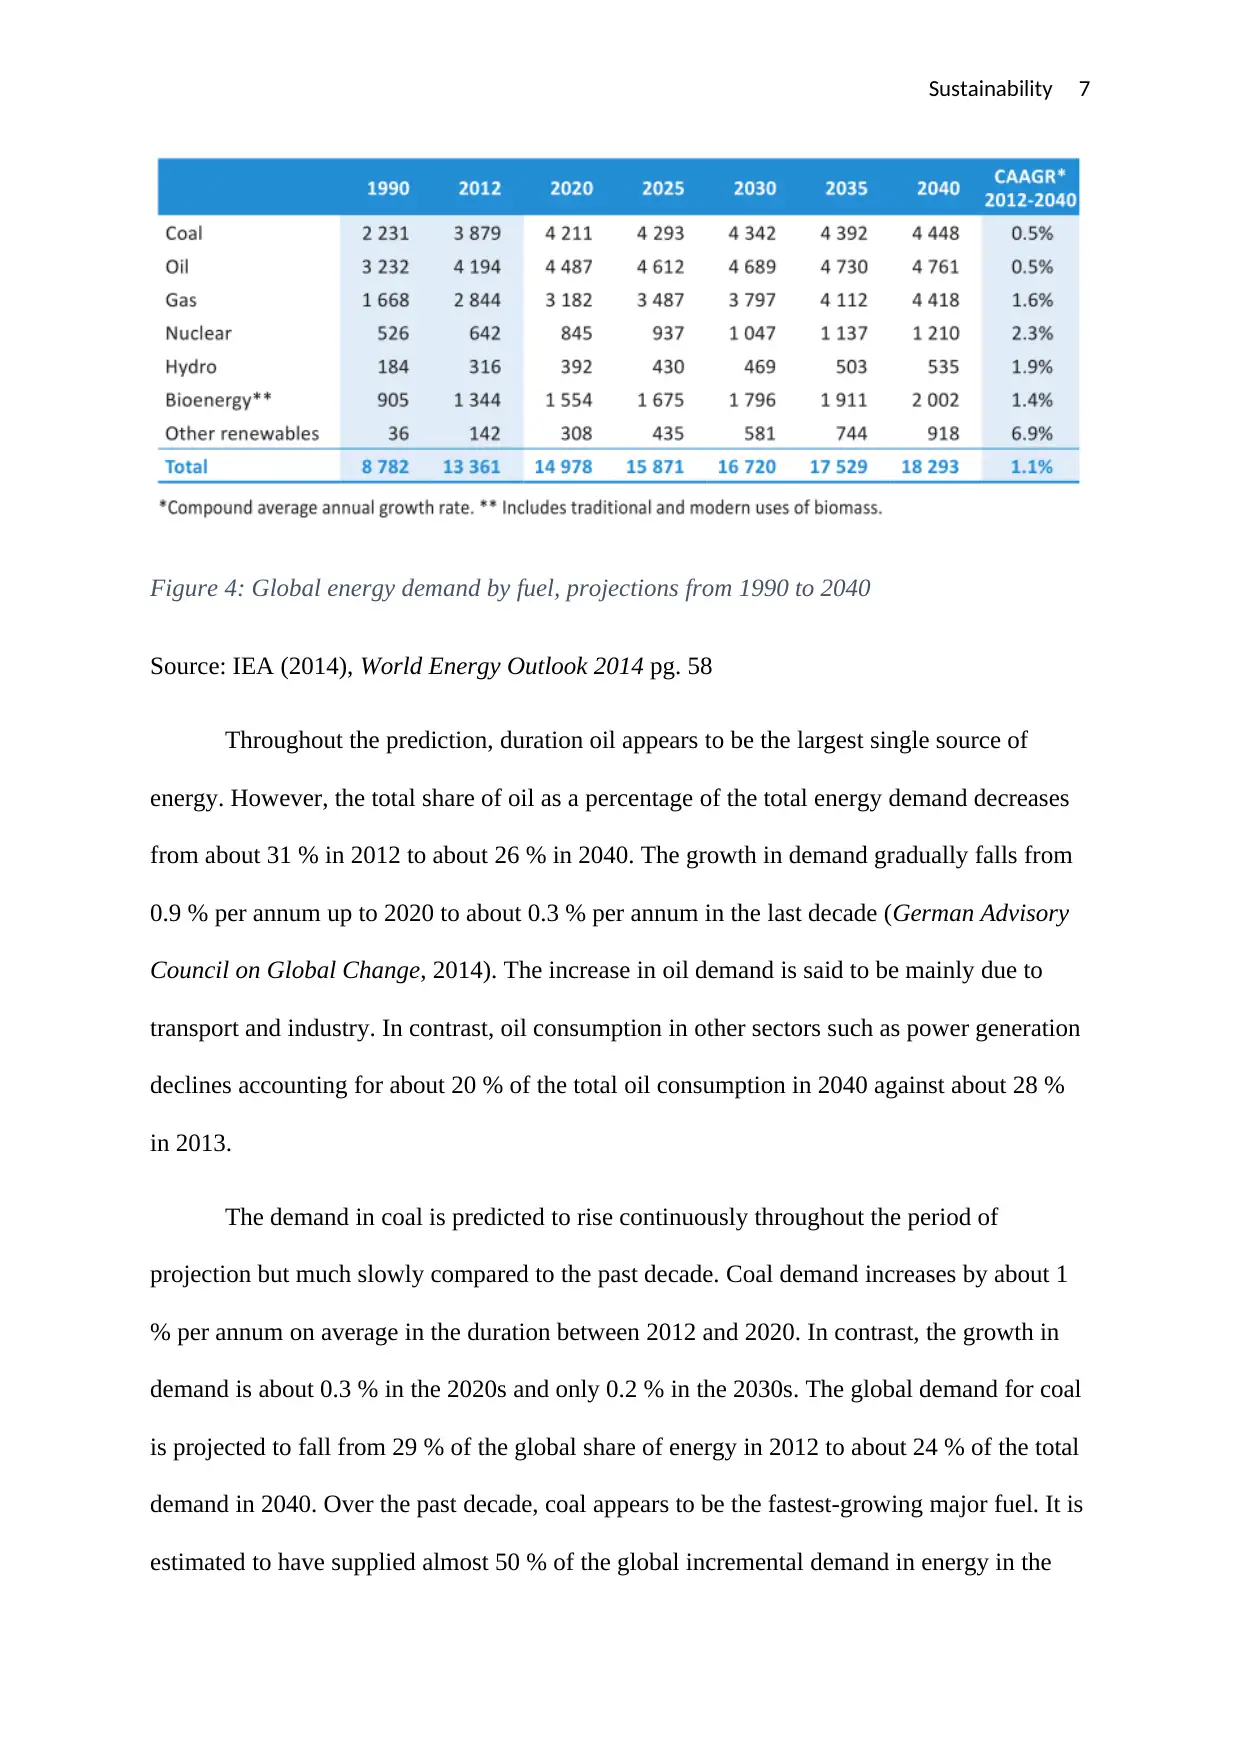
Figure 4: Global energy demand by fuel, projections from 1990 to 2040
Source: IEA (2014), World Energy Outlook 2014 pg. 58
Throughout the prediction, duration oil appears to be the largest single source of
energy. However, the total share of oil as a percentage of the total energy demand decreases
from about 31 % in 2012 to about 26 % in 2040. The growth in demand gradually falls from
0.9 % per annum up to 2020 to about 0.3 % per annum in the last decade (German Advisory
Council on Global Change, 2014). The increase in oil demand is said to be mainly due to
transport and industry. In contrast, oil consumption in other sectors such as power generation
declines accounting for about 20 % of the total oil consumption in 2040 against about 28 %
in 2013.
The demand in coal is predicted to rise continuously throughout the period of
projection but much slowly compared to the past decade. Coal demand increases by about 1
% per annum on average in the duration between 2012 and 2020. In contrast, the growth in
demand is about 0.3 % in the 2020s and only 0.2 % in the 2030s. The global demand for coal
is projected to fall from 29 % of the global share of energy in 2012 to about 24 % of the total
demand in 2040. Over the past decade, coal appears to be the fastest-growing major fuel. It is
estimated to have supplied almost 50 % of the global incremental demand in energy in the
Paraphrase This Document
Need a fresh take? Get an instant paraphrase of this document with our AI Paraphraser
Sustainability 8
period between 2002 and 2012 with over 85 % of the increase being credited to China (IEA,
2014).
Renewable energy use (with the exception of charcoal and fuelwood) grows rapidly
throughout the period of projection. This is as a result of advancement in technology which
reduces the cost of production and subsidies as part of policies aimed at increasing the overall
use of renewable energy sources and limiting the consumption of fossil fuels. Another reason
for the increased demand in low-carbon fuels is the predicted rise in the prices of fossil fuels
as a result of their depletion which is predicted to increase their cost of extraction by the end
of the projection period (Ghosh & Prelas, 2011). The renewable energy share of the world’s
total energy demand peaks at 15 % in 2040 in comparison with only 8 % in 2012 (IEA,
2014 ).
The power generation sector is the main contributor to this increase. Its share in the
renewable energy use rises from 21 % in 2012 to 33 % in 2040. Wind and solar energy
contribute about 50 % of this increase. The average rate of production increase from these
combined sources is around 8 % per annum. The demand for hydropower expands too but at
a slower rate of only 1.9 % per year. This slow growth can be partly explained by the fact that
a large proportion of this resource’s technical potential is currently being utilized (Ikiz,
2018). Besides, the economic and environmental factors are projected to limit the
development of untapped resources. The demand for biofuels also grows considerably over
the projection period rising to about 4.6 million barrels per day from 1.3 million barrels per
day. The increase in biofuel consumption mainly sets in from 2020 onwards. In contrast,
charcoal and fuelwood use for domestic purposes including cooking and heating falls within
this period.
Sustainability 9
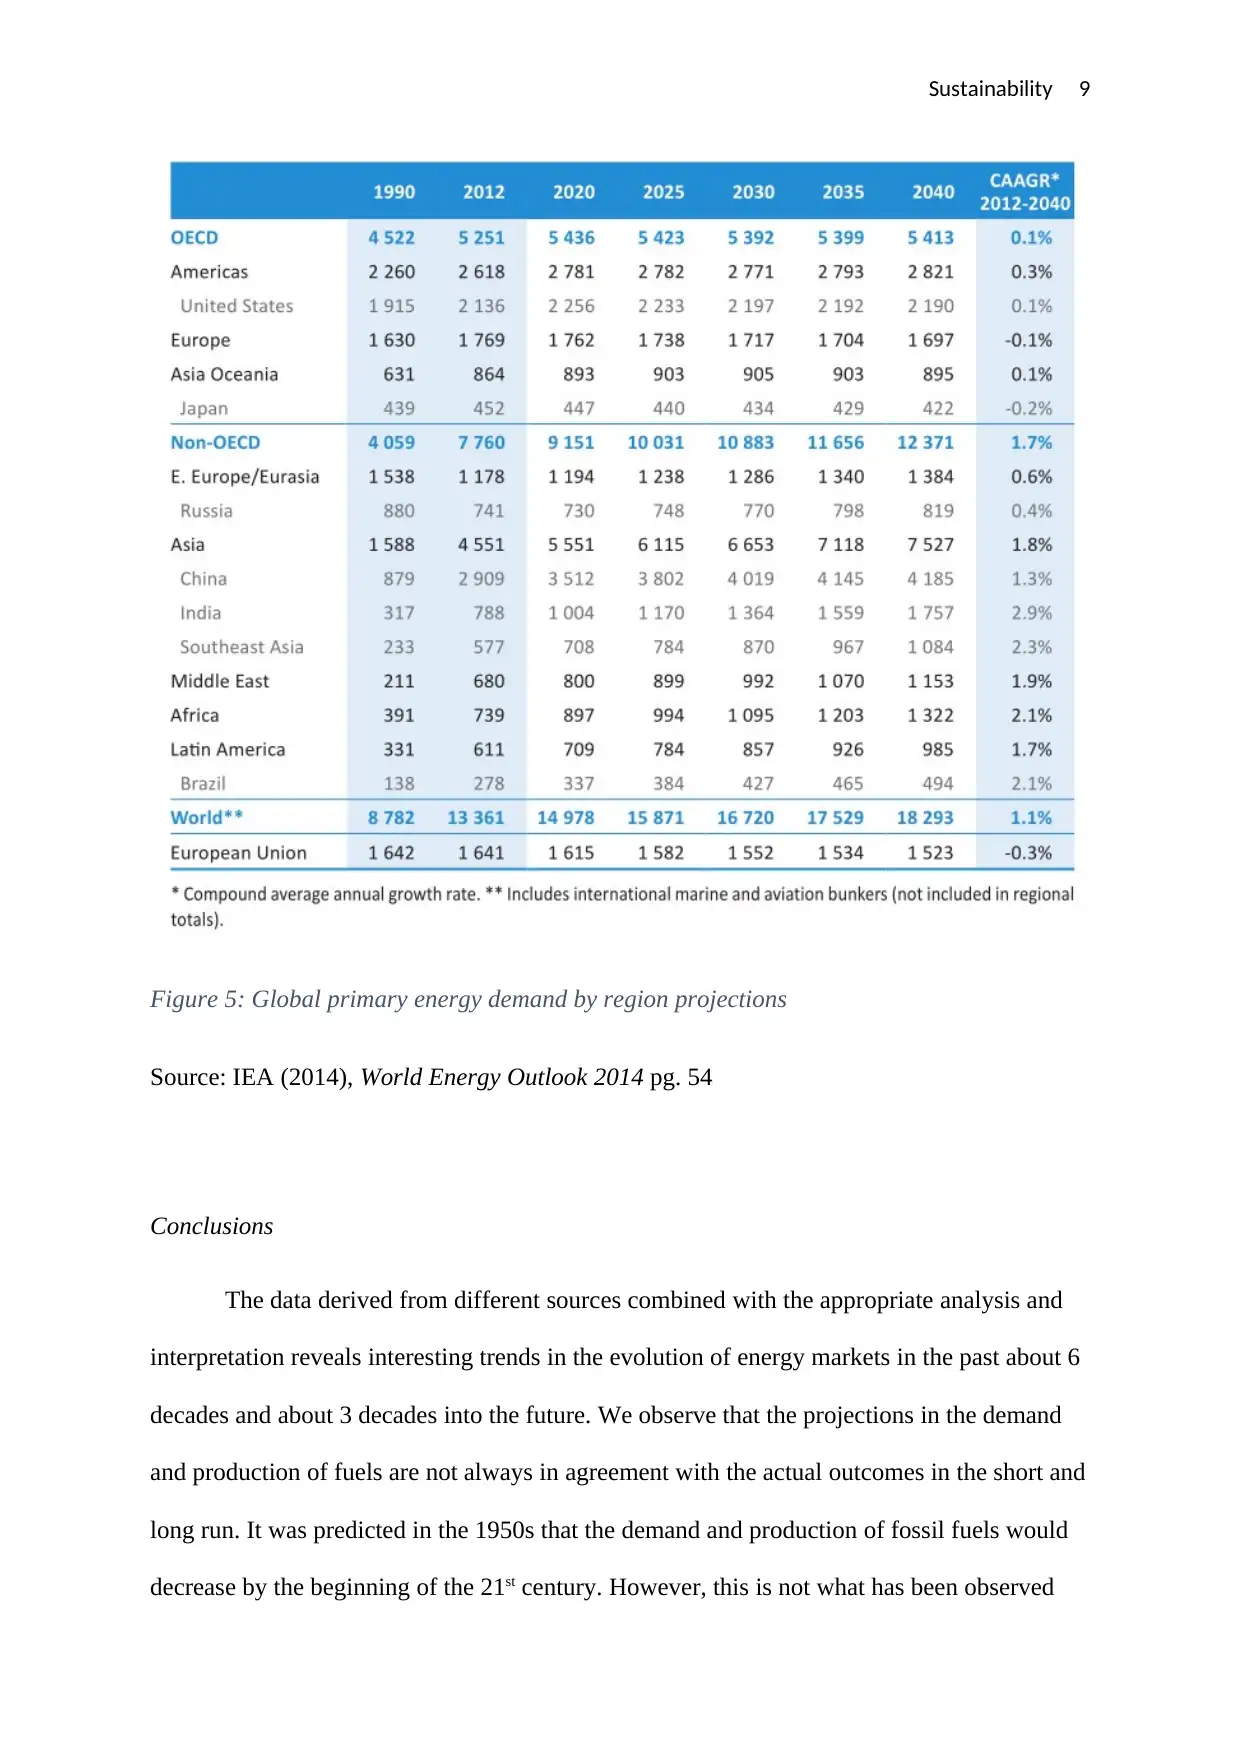
Figure 5: Global primary energy demand by region projections
Source: IEA (2014), World Energy Outlook 2014 pg. 54
Conclusions
The data derived from different sources combined with the appropriate analysis and
interpretation reveals interesting trends in the evolution of energy markets in the past about 6
decades and about 3 decades into the future. We observe that the projections in the demand
and production of fuels are not always in agreement with the actual outcomes in the short and
long run. It was predicted in the 1950s that the demand and production of fossil fuels would
decrease by the beginning of the 21st century. However, this is not what has been observed
⊘ This is a preview!⊘
Do you want full access?
Subscribe today to unlock all pages.
Trusted by 1+ million students worldwide

Sustainability 10
and the production and demand for fossil fuels continue to grow. On the other hand, it was
predicted that the demand and production of renewable energy sources would continue to
increase far into the future and evidently, that is the current trend. The demand and
production of low carbon fuels will continue to increase with the advancement in technology.
This will enable the efficient and effective exploitation of more renewable sources of energy.
Paraphrase This Document
Need a fresh take? Get an instant paraphrase of this document with our AI Paraphraser
Sustainability 11
References
Araujo, K., & Araújo, K. M. (2017). Low Carbon Energy Transitions: Turning Points in
National Policy and Innovation. Oxford University Press.
Bhattacharyya, S. C. (2011). Energy Economics: Concepts, Issues, Markets and
Governance. Berlin, Germany: Springer Science & Business Media.
Brown, C. E. (2012). World Energy Resources: International Geohydroscience and Energy
Research Institute. Springer Science & Business Media.
Chateau, B., & Lapillonne, B. (2012). Energy Demand: Facts and Trends: A Comparative
Analysis of Industrialized Countries. Berlin, Germany: Springer Science & Business
Media.
German Advisory Council On Global Change. (2014). World in Transition 3: Towards
Sustainable Energy Systems. London, England: Routledge.
Ghosh, T. K., & Prelas, M. A. (2011). Energy Resources and Systems: Volume 2:
Renewable Resources. Berlin, Germany: Springer Science & Business Media.
Graaf, T. V., Westphal, D. K., & Lesage, P. D. (2013). Global Energy Governance in a
Multipolar World. Surrey, England: Ashgate Publishing.
Hannah Ritchie and Max Roser (2019) - "Energy Production & Changing Energy Sources".
Published online at OurWorldInData.org. Retrieved from:
'https://ourworldindata.org/energy-production-and-changing-energy-sources'
[Online Resource]
Hill, R., O'Keefe, P., & Snape, C. (1995). The Future of Energy Use. Palgrave Macmillan.
IEA, 2017. Key World Energy Statistics, International Energy Agency.
https://www.iea.org/publications/freepublications/publication/KeyWorld2017.pdf [Ac
cessed February 2019].
Sustainability 12
IEA (2014), World Energy Outlook 2014, IEA, Paris, https://doi.org/10.1787/weo-2014-en.
Ikiz, A. (2018). Economic Dynamics of Global Energy Geopolitics. Hershey, PA: IGI
Global.
IRENA (2018), Global Energy Transformation: A roadmap to 2050, International
Renewable Energy Agency, Abu Dhabi.
Ion, D.C (1975). Availability of World Energy Resources. Berlin, Germany: Springer
Science & Business Media.
Larsson, M. R. (2012). The Need for Large-Scale Energy Systems Transformation. The
Business of Global Energy Transformation, 9-15. doi:10.1057/9781137024497_2
Rimmer, M. (2018). Intellectual Property and Clean Energy: The Paris Agreement and
Climate Justice. Basingstoke, England: Springer.
WEC, 2017. World Energy Outlook 2017, OECD Publishing. Available at:
https://ebookcentral.proquest.com/lib/dmu/detail.action?docID=5160837& [Acc
essed February 2019].
⊘ This is a preview!⊘
Do you want full access?
Subscribe today to unlock all pages.
Trusted by 1+ million students worldwide
1 out of 12
Related Documents


Your All-in-One AI-Powered Toolkit for Academic Success.
+13062052269
info@desklib.com
Available 24*7 on WhatsApp / Email
![[object Object]](/_next/static/media/star-bottom.7253800d.svg)
Unlock your academic potential
Copyright © 2020–2026 A2Z Services. All Rights Reserved. Developed and managed by ZUCOL.