Understanding Digital Revolution: Swimwear Revival Automation Project
VerifiedAdded on 2022/08/20
|7
|887
|36
Practical Assignment
AI Summary
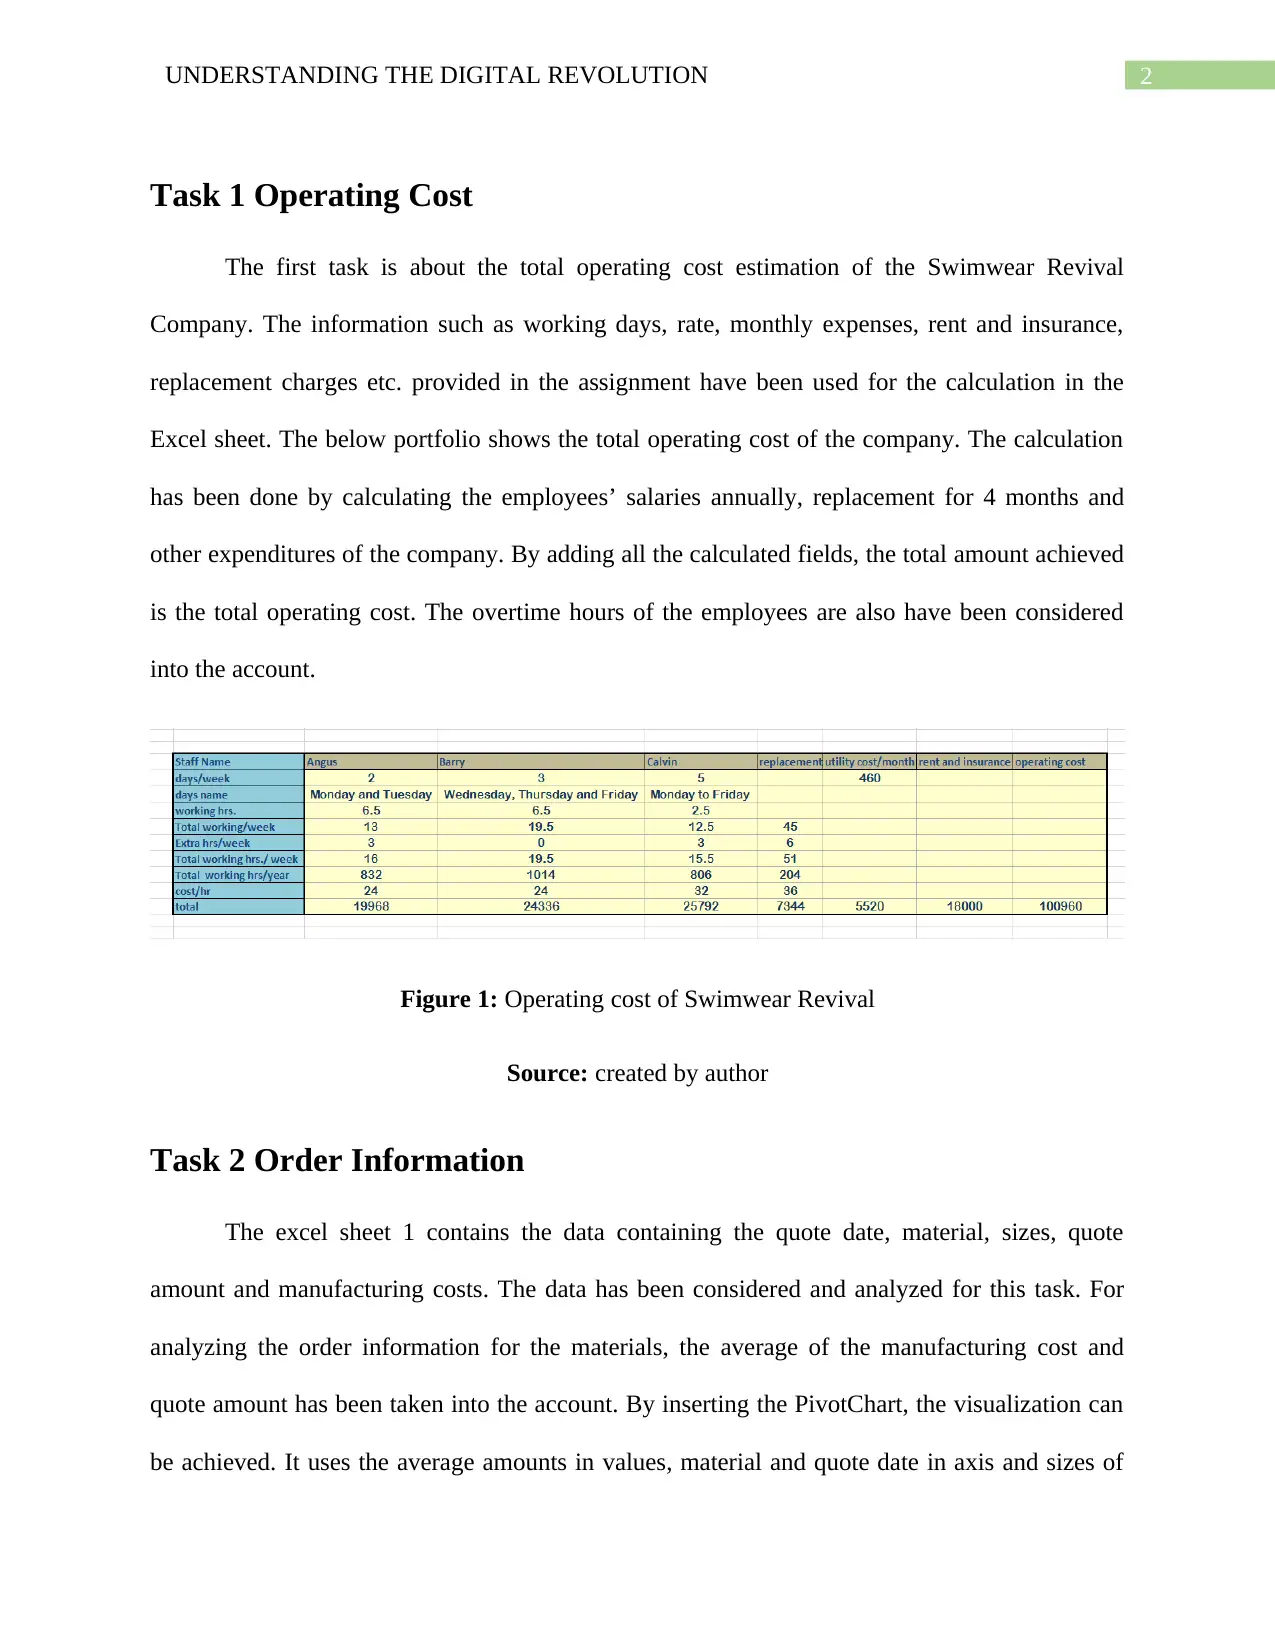
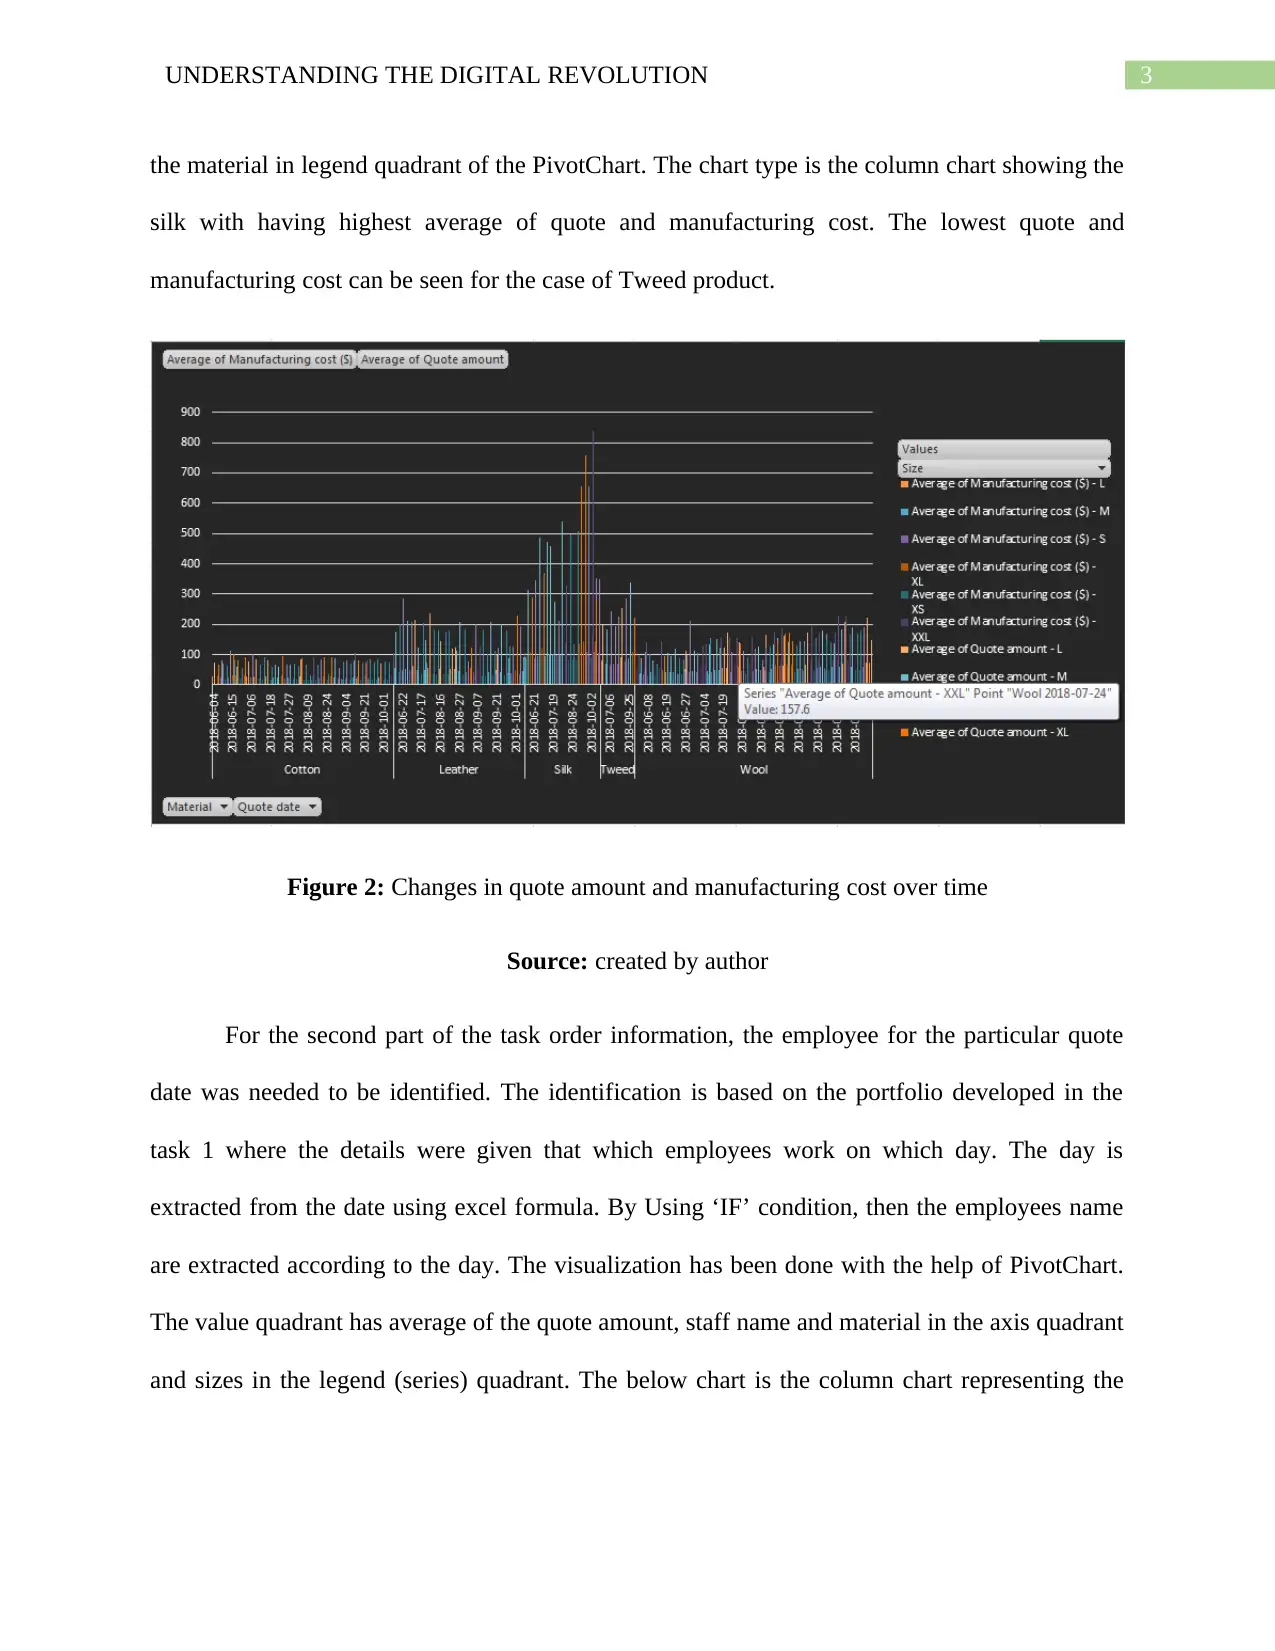
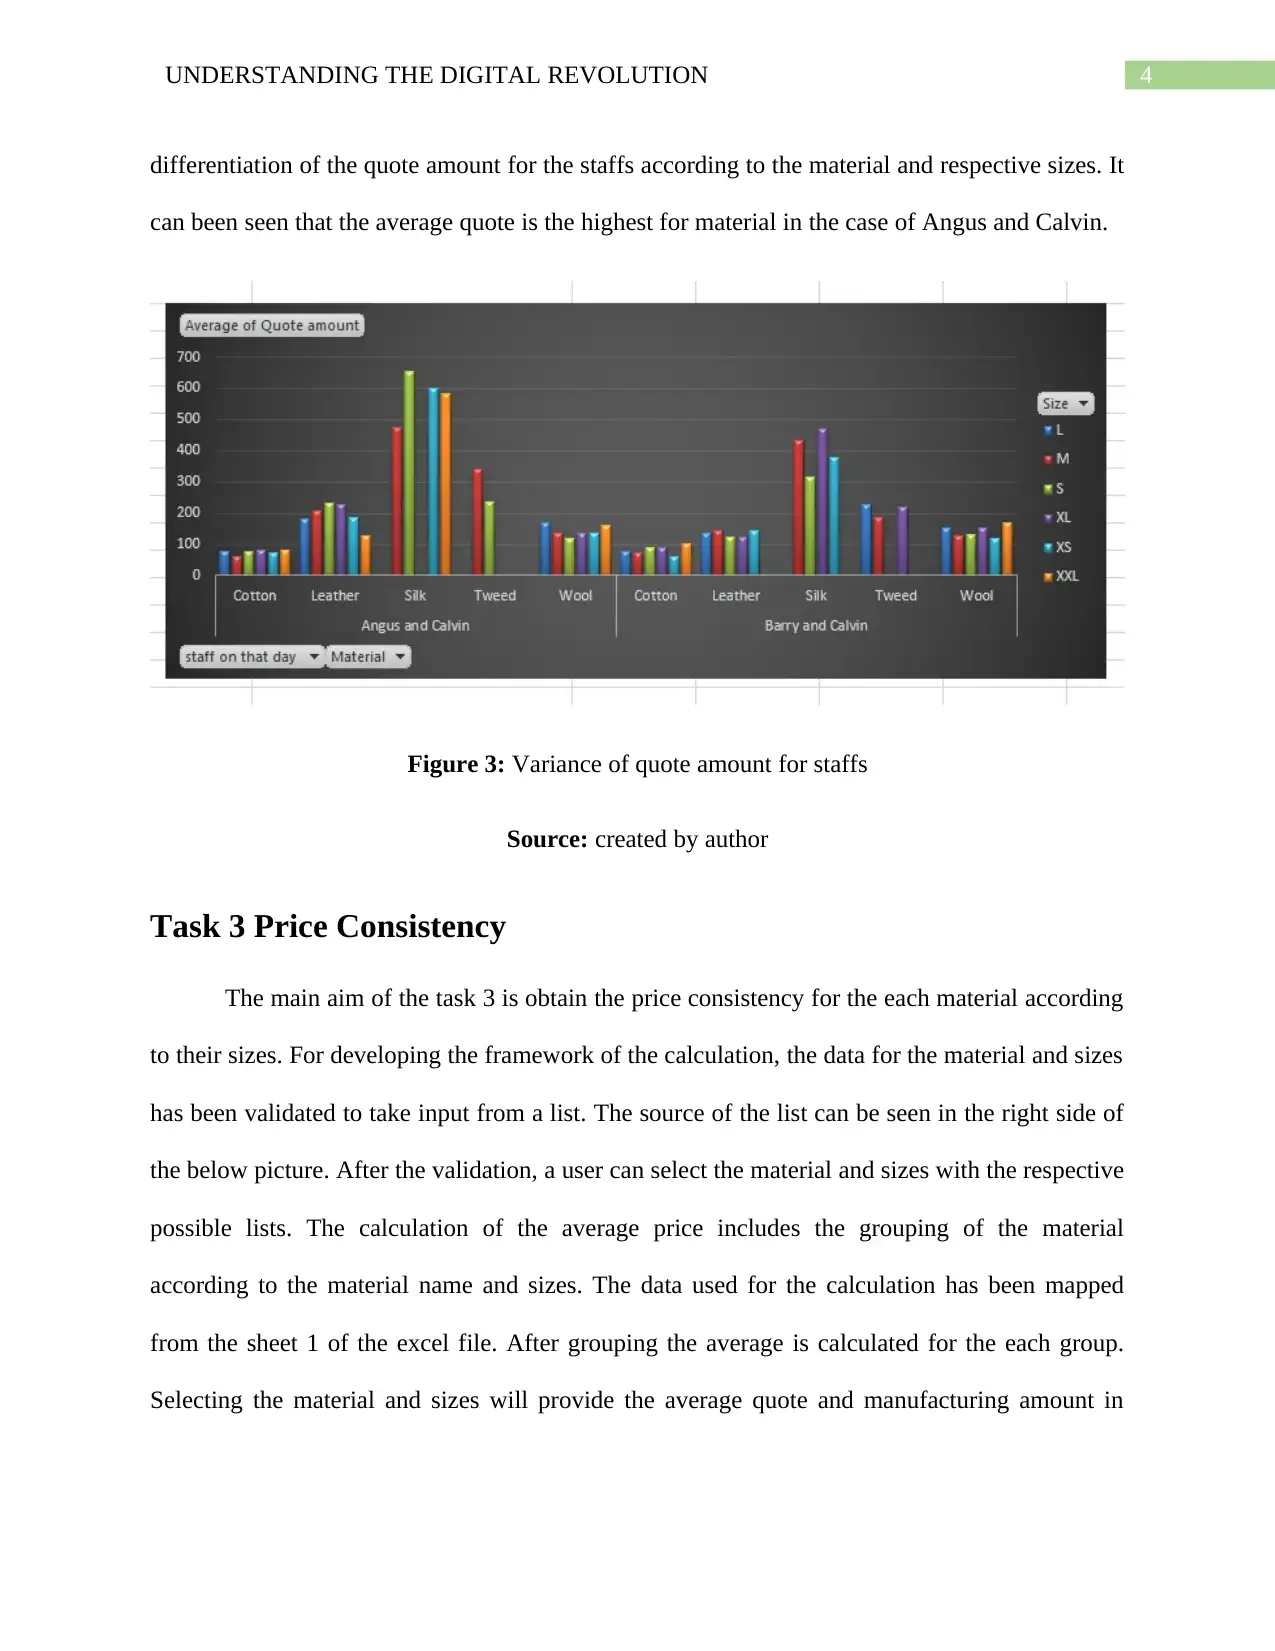
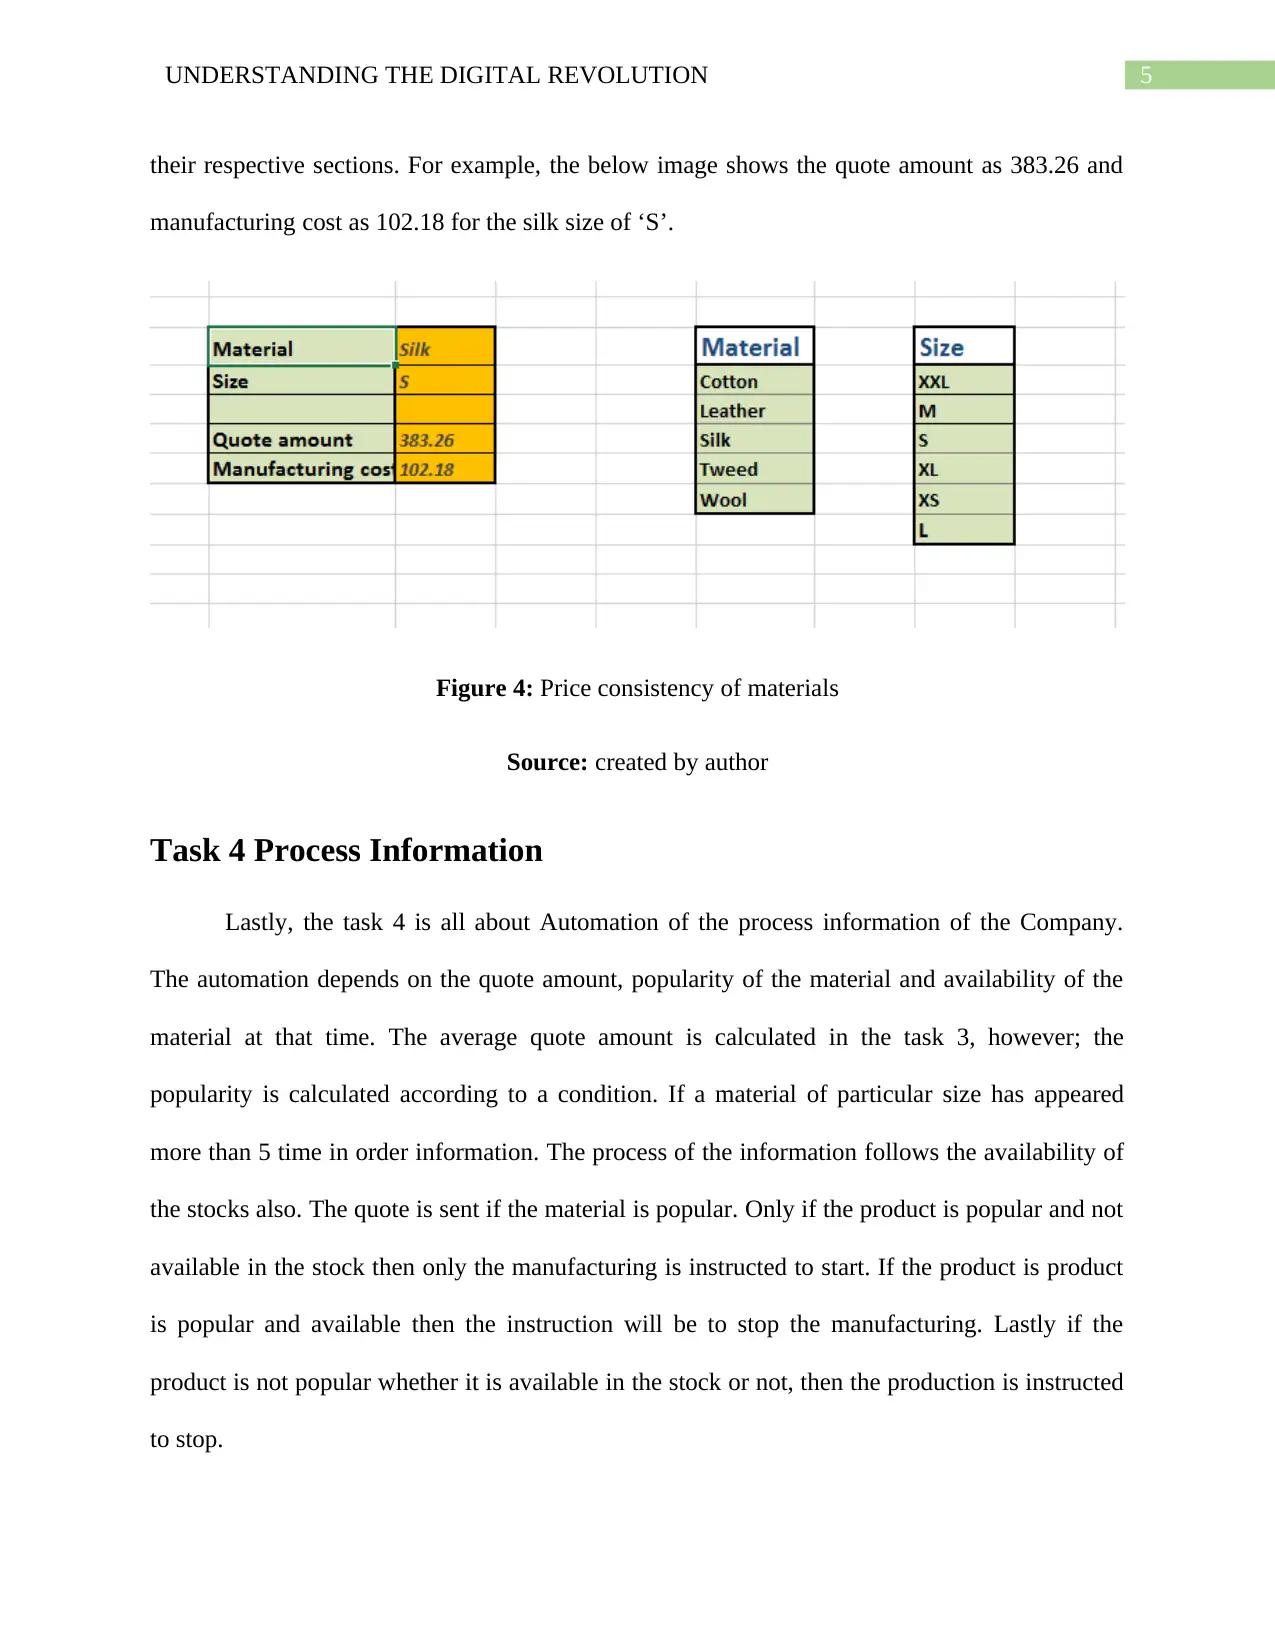
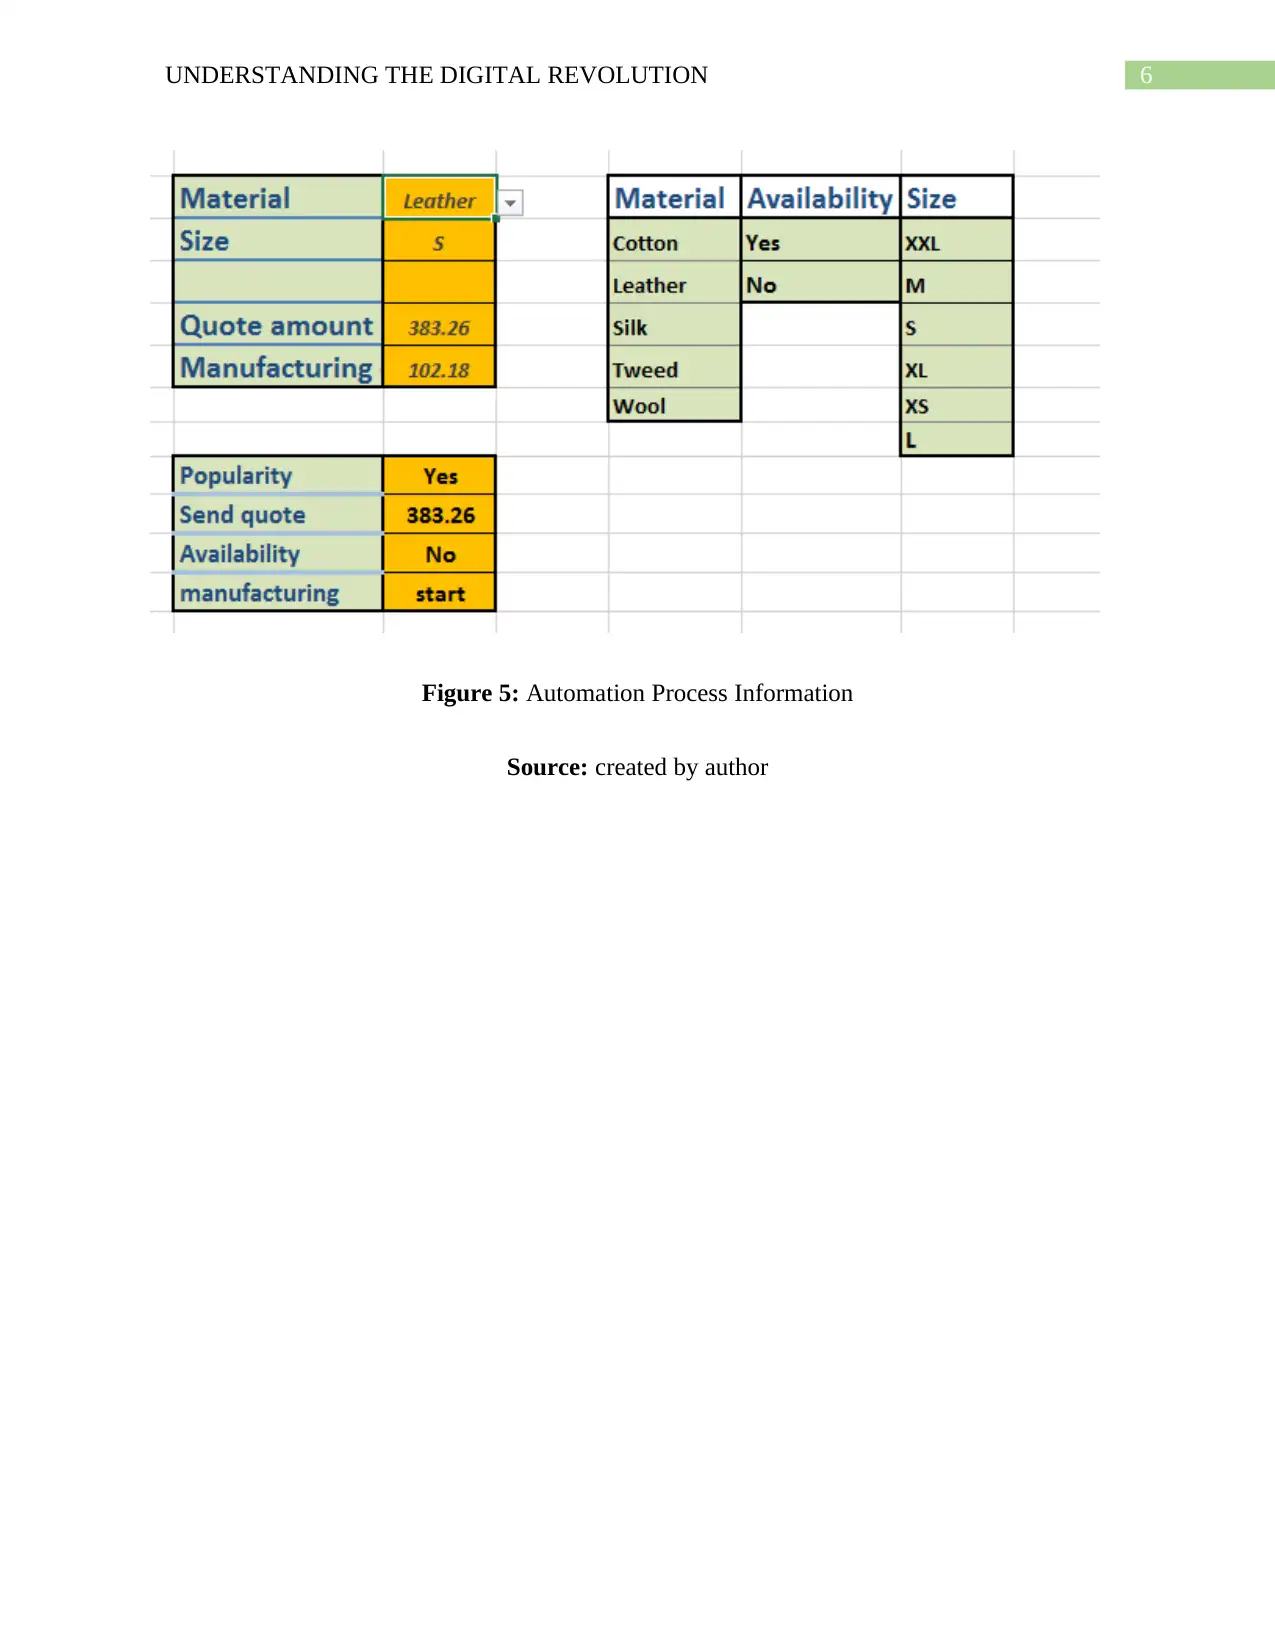
This assignment focuses on automating business processes for the Swimwear Revival Company using Microsoft Excel. The tasks include estimating total operating costs, analyzing order information by calculating average manufacturing costs and quote amounts, visualizing data using PivotCharts to compare different materials and sizes, and identifying employee performance based on quote amounts. The assignment also involves determining price consistency for each material and size through data validation and average price calculations. Finally, the project automates the process information, including the quote amount, popularity of the material, and availability of the material in stock, providing instructions for manufacturing and stopping production based on these factors. The student created Excel files for all tasks and a report describing their work.

Running head: UNDERSTANDING THE DIGITAL REVOLUTION
UNDERSTANDING THE DIGITAL REVOLUTION
Name of the Student
Name of the University
Author Note
UNDERSTANDING THE DIGITAL REVOLUTION
Name of the Student
Name of the University
Author Note
Paraphrase This Document
Need a fresh take? Get an instant paraphrase of this document with our AI Paraphraser

1UNDERSTANDING THE DIGITAL REVOLUTION
Table of Contents
Task 1 Operating Cost.....................................................................................................................2
Task 2 Order Information................................................................................................................2
Task 3 Price Consistency.................................................................................................................4
Task 4 Process Information.............................................................................................................5

2UNDERSTANDING THE DIGITAL REVOLUTION
Task 1 Operating Cost
The first task is about the total operating cost estimation of the Swimwear Revival
Company. The information such as working days, rate, monthly expenses, rent and insurance,
replacement charges etc. provided in the assignment have been used for the calculation in the
Excel sheet. The below portfolio shows the total operating cost of the company. The calculation
has been done by calculating the employees’ salaries annually, replacement for 4 months and
other expenditures of the company. By adding all the calculated fields, the total amount achieved
is the total operating cost. The overtime hours of the employees are also have been considered
into the account.
Figure 1: Operating cost of Swimwear Revival
Source: created by author
Task 2 Order Information
The excel sheet 1 contains the data containing the quote date, material, sizes, quote
amount and manufacturing costs. The data has been considered and analyzed for this task. For
analyzing the order information for the materials, the average of the manufacturing cost and
quote amount has been taken into the account. By inserting the PivotChart, the visualization can
be achieved. It uses the average amounts in values, material and quote date in axis and sizes of
⊘ This is a preview!⊘
Do you want full access?
Subscribe today to unlock all pages.

Trusted by 1+ million students worldwide

3UNDERSTANDING THE DIGITAL REVOLUTION
the material in legend quadrant of the PivotChart. The chart type is the column chart showing the
silk with having highest average of quote and manufacturing cost. The lowest quote and
manufacturing cost can be seen for the case of Tweed product.
Figure 2: Changes in quote amount and manufacturing cost over time
Source: created by author
For the second part of the task order information, the employee for the particular quote
date was needed to be identified. The identification is based on the portfolio developed in the
task 1 where the details were given that which employees work on which day. The day is
extracted from the date using excel formula. By Using ‘IF’ condition, then the employees name
are extracted according to the day. The visualization has been done with the help of PivotChart.
The value quadrant has average of the quote amount, staff name and material in the axis quadrant
and sizes in the legend (series) quadrant. The below chart is the column chart representing the
Paraphrase This Document
Need a fresh take? Get an instant paraphrase of this document with our AI Paraphraser

4UNDERSTANDING THE DIGITAL REVOLUTION
differentiation of the quote amount for the staffs according to the material and respective sizes. It
can been seen that the average quote is the highest for material in the case of Angus and Calvin.
Figure 3: Variance of quote amount for staffs
Source: created by author
Task 3 Price Consistency
The main aim of the task 3 is obtain the price consistency for the each material according
to their sizes. For developing the framework of the calculation, the data for the material and sizes
has been validated to take input from a list. The source of the list can be seen in the right side of
the below picture. After the validation, a user can select the material and sizes with the respective
possible lists. The calculation of the average price includes the grouping of the material
according to the material name and sizes. The data used for the calculation has been mapped
from the sheet 1 of the excel file. After grouping the average is calculated for the each group.
Selecting the material and sizes will provide the average quote and manufacturing amount in

5UNDERSTANDING THE DIGITAL REVOLUTION
their respective sections. For example, the below image shows the quote amount as 383.26 and
manufacturing cost as 102.18 for the silk size of ‘S’.
Figure 4: Price consistency of materials
Source: created by author
Task 4 Process Information
Lastly, the task 4 is all about Automation of the process information of the Company.
The automation depends on the quote amount, popularity of the material and availability of the
material at that time. The average quote amount is calculated in the task 3, however; the
popularity is calculated according to a condition. If a material of particular size has appeared
more than 5 time in order information. The process of the information follows the availability of
the stocks also. The quote is sent if the material is popular. Only if the product is popular and not
available in the stock then only the manufacturing is instructed to start. If the product is product
is popular and available then the instruction will be to stop the manufacturing. Lastly if the
product is not popular whether it is available in the stock or not, then the production is instructed
to stop.
⊘ This is a preview!⊘
Do you want full access?
Subscribe today to unlock all pages.

Trusted by 1+ million students worldwide

6UNDERSTANDING THE DIGITAL REVOLUTION
Figure 5: Automation Process Information
Source: created by author
Figure 5: Automation Process Information
Source: created by author
1 out of 7
Related Documents
Your All-in-One AI-Powered Toolkit for Academic Success.
+13062052269
info@desklib.com
Available 24*7 on WhatsApp / Email
Unlock your academic potential
Copyright © 2020–2025 A2Z Services. All Rights Reserved. Developed and managed by ZUCOL.


