SWU Football Games: Forecasting Attendance and Revenue Analysis
VerifiedAdded on 2023/06/03
|14
|1887
|177
Report
AI Summary
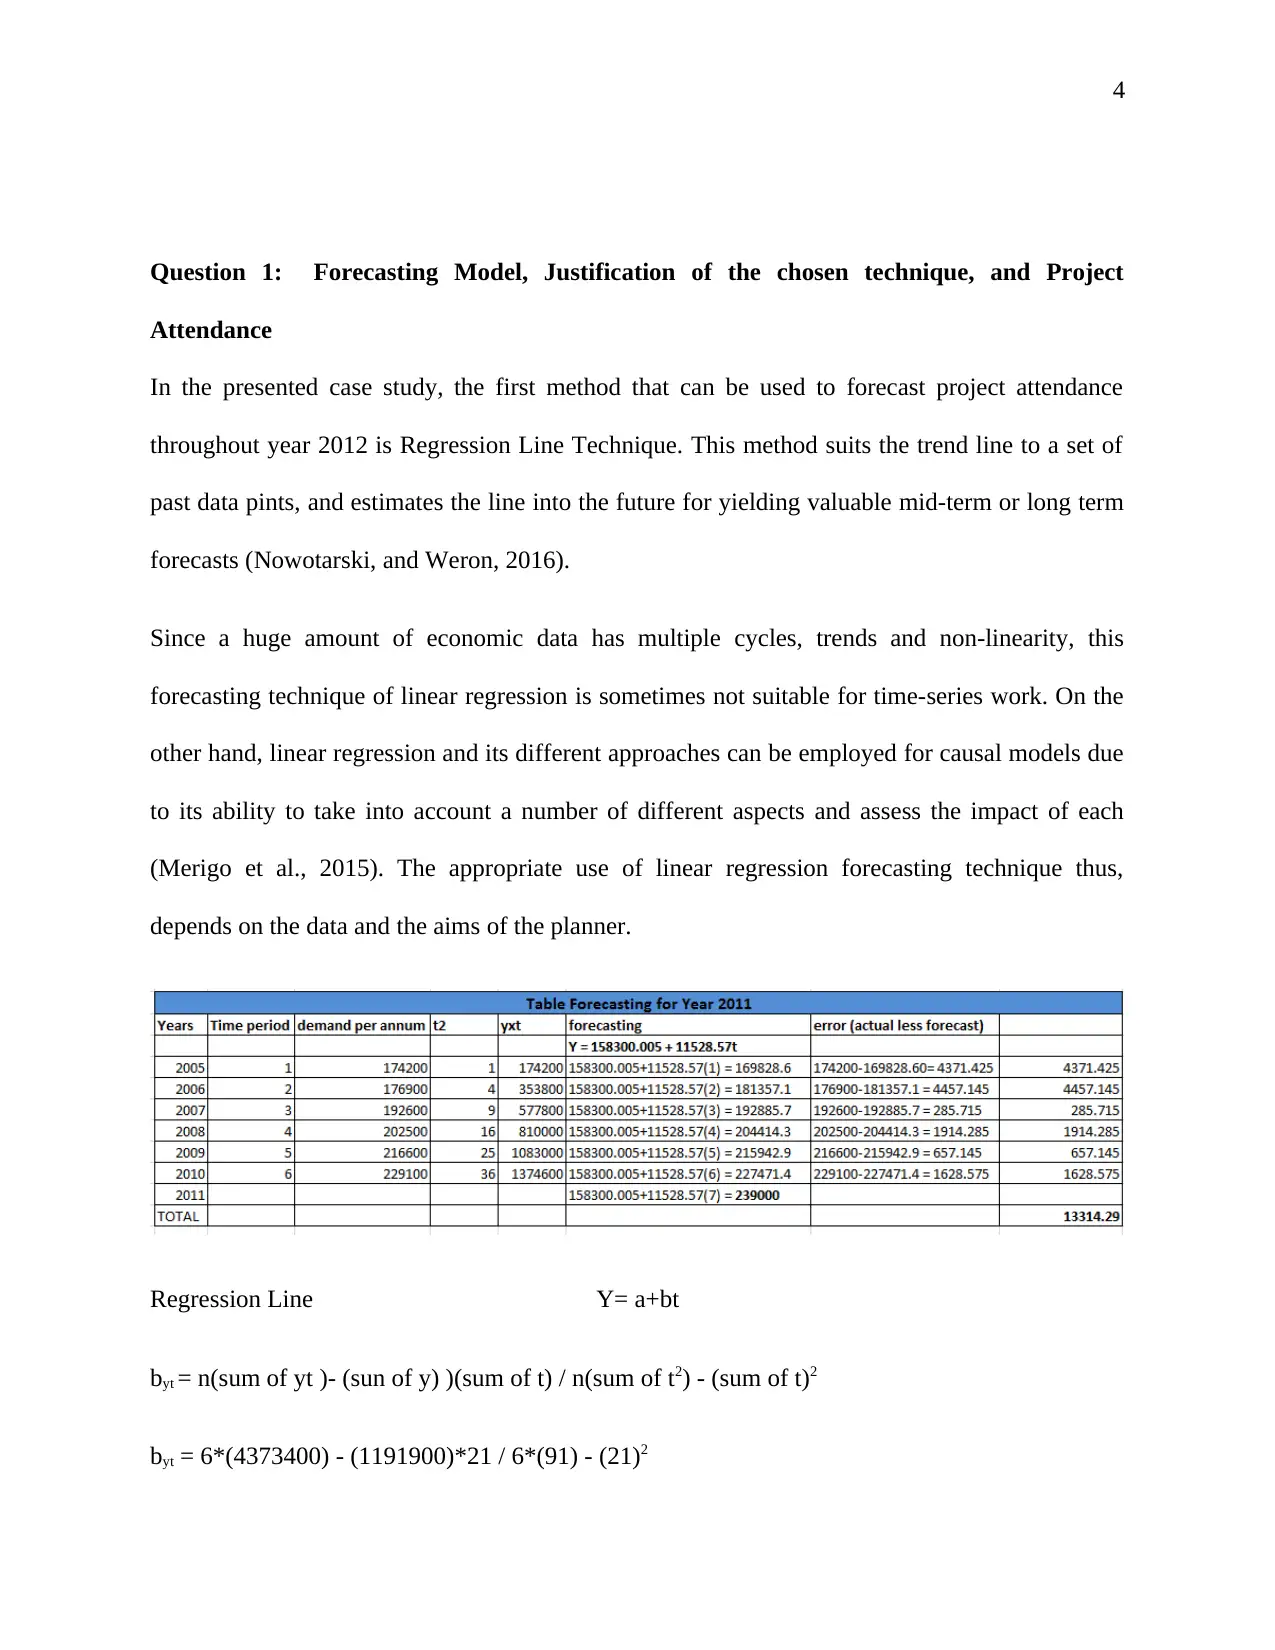
This report analyzes attendance and revenue forecasting for SWU football games. It begins with an introduction to forecasting methods, including qualitative and quantitative techniques. The core of the report focuses on applying linear regression and seasonal trend forecasting to predict project attendance for 2011 and 2012, calculating the average per-game demand and forecasted attendees. The report then forecasts revenue for both years based on ticket prices and attendance, followed by a discussion of stadium options for Southwestern University, considering the potential for increased demand and financial implications. Finally, the report offers recommendations for the university, including prioritizing project completion and effectively utilizing resources to meet deadlines. The report concludes by referencing key sources used in the analysis.
Contribute Materials
Your contribution can guide someone’s learning journey. Share your
documents today.

1
Forecasting Model
Forecasting Model
Secure Best Marks with AI Grader
Need help grading? Try our AI Grader for instant feedback on your assignments.

2
Table of Contents
Introduction to Forecasting..............................................................................................................3
Question 1: Forecasting Model, Justification of the chosen technique, and Project Attendance...4
Question 2: The Expected Revenue in 2011 and 2012...................................................................8
Question 3: The Options for the School..........................................................................................9
Recommendations..........................................................................................................................10
References......................................................................................................................................11

3
Introduction to Forecasting
Forecasting refers to a process of predicting the future trends on the basis of present and past
data, and evaluation of the trends. It is a crucial technique that is used for making informed
decisions with regard to the future trends. Forecasting is used in businesses for effective planning
and allocation of their budgets for the projected expenditure in future. Forecasting thus, plays a
critical role in the activities of modern management. It helps the business analysts in planning of
successful operations (Corona et al., 2017). Lack of forecasting or wrong predictions in any
business, can lead to business failure in the long run. There are basically two types of forecasting
i.e., qualitative and quantitative forecasting. Qualitative forecasting techniques are based on the
judgment and opinion of experts and consumers, and is therefore subjective in nature. On the
other hand, quantitative forecasting techniques are useful in estimating future data as a result of
past data. Quantitative techniques are suitable in the case numerical data is easily available and it
is expected that a particular pattern of data is likely to continue in the upcoming years. These
techniques are basically applied to immediate or short term decisions. Quantitative forecasting
methods include regression analysis, exponential smoothing, and moving average (Şahin, and
Erol, 2017). On the other hand, qualitative forecasting techniques are employed in case the
required data is not available in order to make long range or instant decisions. The qualitative
forecasting techniques include market research, historical life cycle analogy, and Delphi method.

4
Question 1: Forecasting Model, Justification of the chosen technique, and Project
Attendance
In the presented case study, the first method that can be used to forecast project attendance
throughout year 2012 is Regression Line Technique. This method suits the trend line to a set of
past data pints, and estimates the line into the future for yielding valuable mid-term or long term
forecasts (Nowotarski, and Weron, 2016).
Since a huge amount of economic data has multiple cycles, trends and non-linearity, this
forecasting technique of linear regression is sometimes not suitable for time-series work. On the
other hand, linear regression and its different approaches can be employed for causal models due
to its ability to take into account a number of different aspects and assess the impact of each
(Merigo et al., 2015). The appropriate use of linear regression forecasting technique thus,
depends on the data and the aims of the planner.
Regression Line Y= a+bt
byt = n(sum of yt )- (sun of y) )(sum of t) / n(sum of t2) - (sum of t)2
byt = 6*(4373400) - (1191900)*21 / 6*(91) - (21)2
Secure Best Marks with AI Grader
Need help grading? Try our AI Grader for instant feedback on your assignments.

5
= (262404400) - (25029900) / 546-441
= 1210500/105
byt = 11528.57
ayt = sum of y / n - b* (sum of t)/n
ayt = 1191900/6 - 11528.57*(21/6)
ayt = 198650-40349.995
= 158300.005
MAD = sum of error/n = 13314.29/6 = 2219.048
Thus, the forecasting for 2011 is 239000
byt = n(sum of yt )- (sun of y) )(sum of t) / n(sum of t2) - (sum of t)2
byt = 7(6046400) - (1430900)*29 / 7*(140) - (28)2
byt = 42324800 - 1430900*28 / 7*140 - 784
byt = 2259600 / 196

6
= 11528.57
ayt = sum of y / n - b* (sum of t)/n
= 1430900/7 - 11528.57 (28/7)
= 204414.29 - 46114.28
ayt = 158300.0057
Therefore, the forecasting for year 2012 is 250528.6
Project Attendance for Year 2011
Average per game demand: 198650÷5
= 39730
Thus, for 2011, the forecasted demand attendees are 239000. The seasonal trend forecasting
technique would be used to predict the 5 Saturday home game.
Project Attendance for Year 2012

7
Therefore, average per game demand: 204414 (approx)/ 5
= 4088
The forecasted demand attendees for 2012 is 250528.6. Now, following is the analysis using
seasonal trend for the Saturday home game.
Question 2: The Expected Revenue in 2011 and 2012
Revenue forecasting is helpful in budgeting of business expenses early so as to get a better idea
of the total sum of money required to budget each month. An exhaustive, and well-researched
forecast of revenue is therefore useful in swaying the investors to contribute funds to the
business.
In the presented case study of SWU Football Games, it is predicted that an average price of a
ticket in 2011 would be $20, and 5% in the ticket price is expected every year in future years.
On the basis of the estimation of the trends using the technique of seasonality forecasting, the
revenue for the year 2011 as well as 2012 are determined. Therefore, the forecast for the
Paraphrase This Document
Need a fresh take? Get an instant paraphrase of this document with our AI Paraphraser

8
revenues that can be estimated for both the years are calculated below by taking the aggregate of
all the attendees in all the 5 games held every year, and then multiplying these by their respective
price of the ticket for the respective year:
Revenues:
Forecasted Revenue for 2011:
= 239000*20
= $ 4780000
Forecasted Revenue for 2012:
= 250527*20
= $ 5010540
Result: From the above calculations of the forecasted revenue for the year 2011 and 2012, it has
been projected that the expected revenue is $4780000 in 2011. On the other hand, the projected
revenue for the year 2012 is $ 5010540.

9
Question 3: The Options for the School
On the basis of above analysis and forecasting, it can be viewed that the SWU Group is having
different number of strong alternatives for creating a new stadium and fulfilling the demands of
Coach Flam. However, there may occur a few time limitations if the University does take any
action as soon as possible. For the purpose of evaluating the available schools options, there is
need to understand the projection of future game attendances (Bradshaw et al., 2016). Apart from
this, it must also be known what the estimated revenues from ticket sales would be after the
coming two years. After analyzing such attendance forecasts and revenue estimations, it is
understood that SWU is enjoying a sound financial position, and therefore it should go for a new
stadium by the 2nd game of 2014, in order to avoid turning away of fans.
Southwestern University can use the stadium as it is in the future years. Since there have been
observed 2 games in the year 2015 that are likely to go above the existing seating capacity, it
would increase the costing for the SWU of approx 5000 seats in these 2 years. In the case of sale
of events, it might happen that the future attendees will switch to another game, causing a huge
loss to the University in terms of revenues from seating.
In addition to this, the Southwestern University also has the option to accept the projects for the
purpose of increasing the overall seating capacity by 5000 seats. If the University go for this
option, it would be beneficial not to sell out the stadium for the upcoming few years. This would
help the University to construct a new stadium because the projection for the increase in the
customers indicates that the stadium would earn a great revenue in the game days of 2011.
Moreover, it is expected that the seating capacity would continue to increase that needs to be
ensured that sold out games does not result in revenue loss. Also, due to growing population and

10
modernization, SWU is required to build a new stadium so as to serve the forecasted demands of
attendees in 2011 and 2012.
modernization, SWU is required to build a new stadium so as to serve the forecasted demands of
attendees in 2011 and 2012.
Secure Best Marks with AI Grader
Need help grading? Try our AI Grader for instant feedback on your assignments.

11
Recommendations
Since Southwestern University wants to complete the project as early as possible, it is
recommended to them to increase the speed of construction process so as to make the target on
time. The available resources should be used effectively in the light of 250 days as being the
deadline (Box et al., 2015) . In addition to this, other deadlines should also be considered by the
University in order to gain advantage of the sagging period built into the operations that are not
much vital for the building process. In case the project of constructing new stadium is under 76
percent confidence, SWU would need to finish the project. On the other hand, the projected dare
of finishing the project is around 200 days, there would be only 70 percent chances of getting it
completed within the given time period.

12
References
Box, G.E., Jenkins, G.M., Reinsel, G.C. and Ljung, G.M. (2015) Time series analysis:
forecasting and control. USA: John Wiley & Sons.
Bradshaw, M.T., Lee, L.F. and Peterson, K. (2016) The interactive role of difficulty and
incentives in explaining the annual earnings forecast walkdown, The Accounting Review, 91(4),
pp.995-1021.
Corona, F., Horrillo, J.D.D.T. and Wiper, M.P. (2017) On the importance of the probabilistic
model in identifying the most decisive games in a tournament, Journal of Quantitative Analysis
in Sports, 13(1), pp.11-23.
Merigo, J.M., Palacios-Marques, D. and Ribeiro-Navarrete, B. (2015) Aggregation systems for
sales forecasting, Journal of Business Research, 68(11), pp.2299-2304.
Nowotarski, J. and Weron, R. (2016) On the importance of the long-term seasonal component in
day-ahead electricity price forecasting, Energy Economics, 57, pp.228-235.
Şahin, M. and Erol, R. (2017) A Comparative Study of Neural Networks and ANFIS for
Forecasting Attendance Rate of Soccer Games, Mathematical and Computational
Applications, 22(4), p.43.

13
Paraphrase This Document
Need a fresh take? Get an instant paraphrase of this document with our AI Paraphraser

14
1 out of 14
Related Documents

Your All-in-One AI-Powered Toolkit for Academic Success.
+13062052269
info@desklib.com
Available 24*7 on WhatsApp / Email
Unlock your academic potential
© 2024 | Zucol Services PVT LTD | All rights reserved.