Statistical Analysis of Weekly Rent in Sydney and Melbourne
VerifiedAdded on 2021/06/14
|6
|820
|244
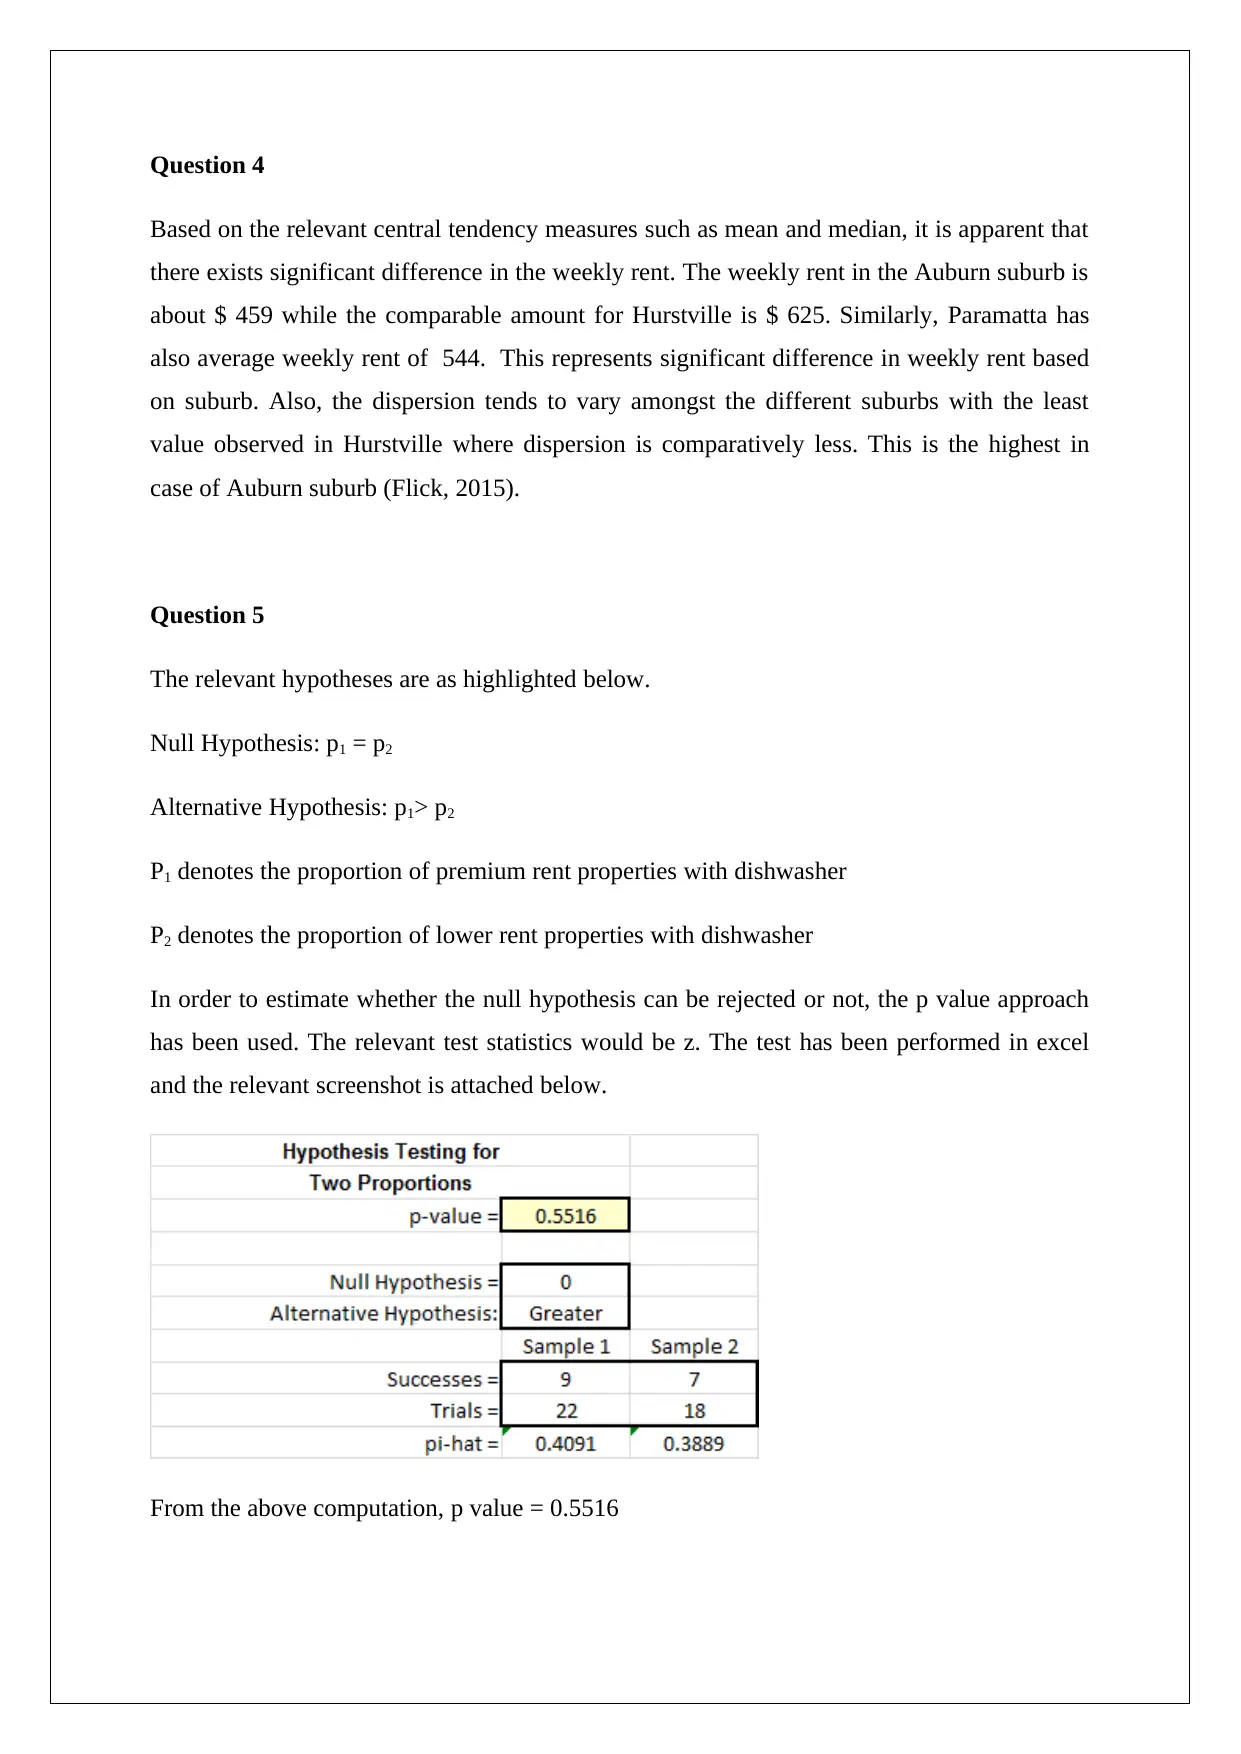
Homework Assignment
AI Summary
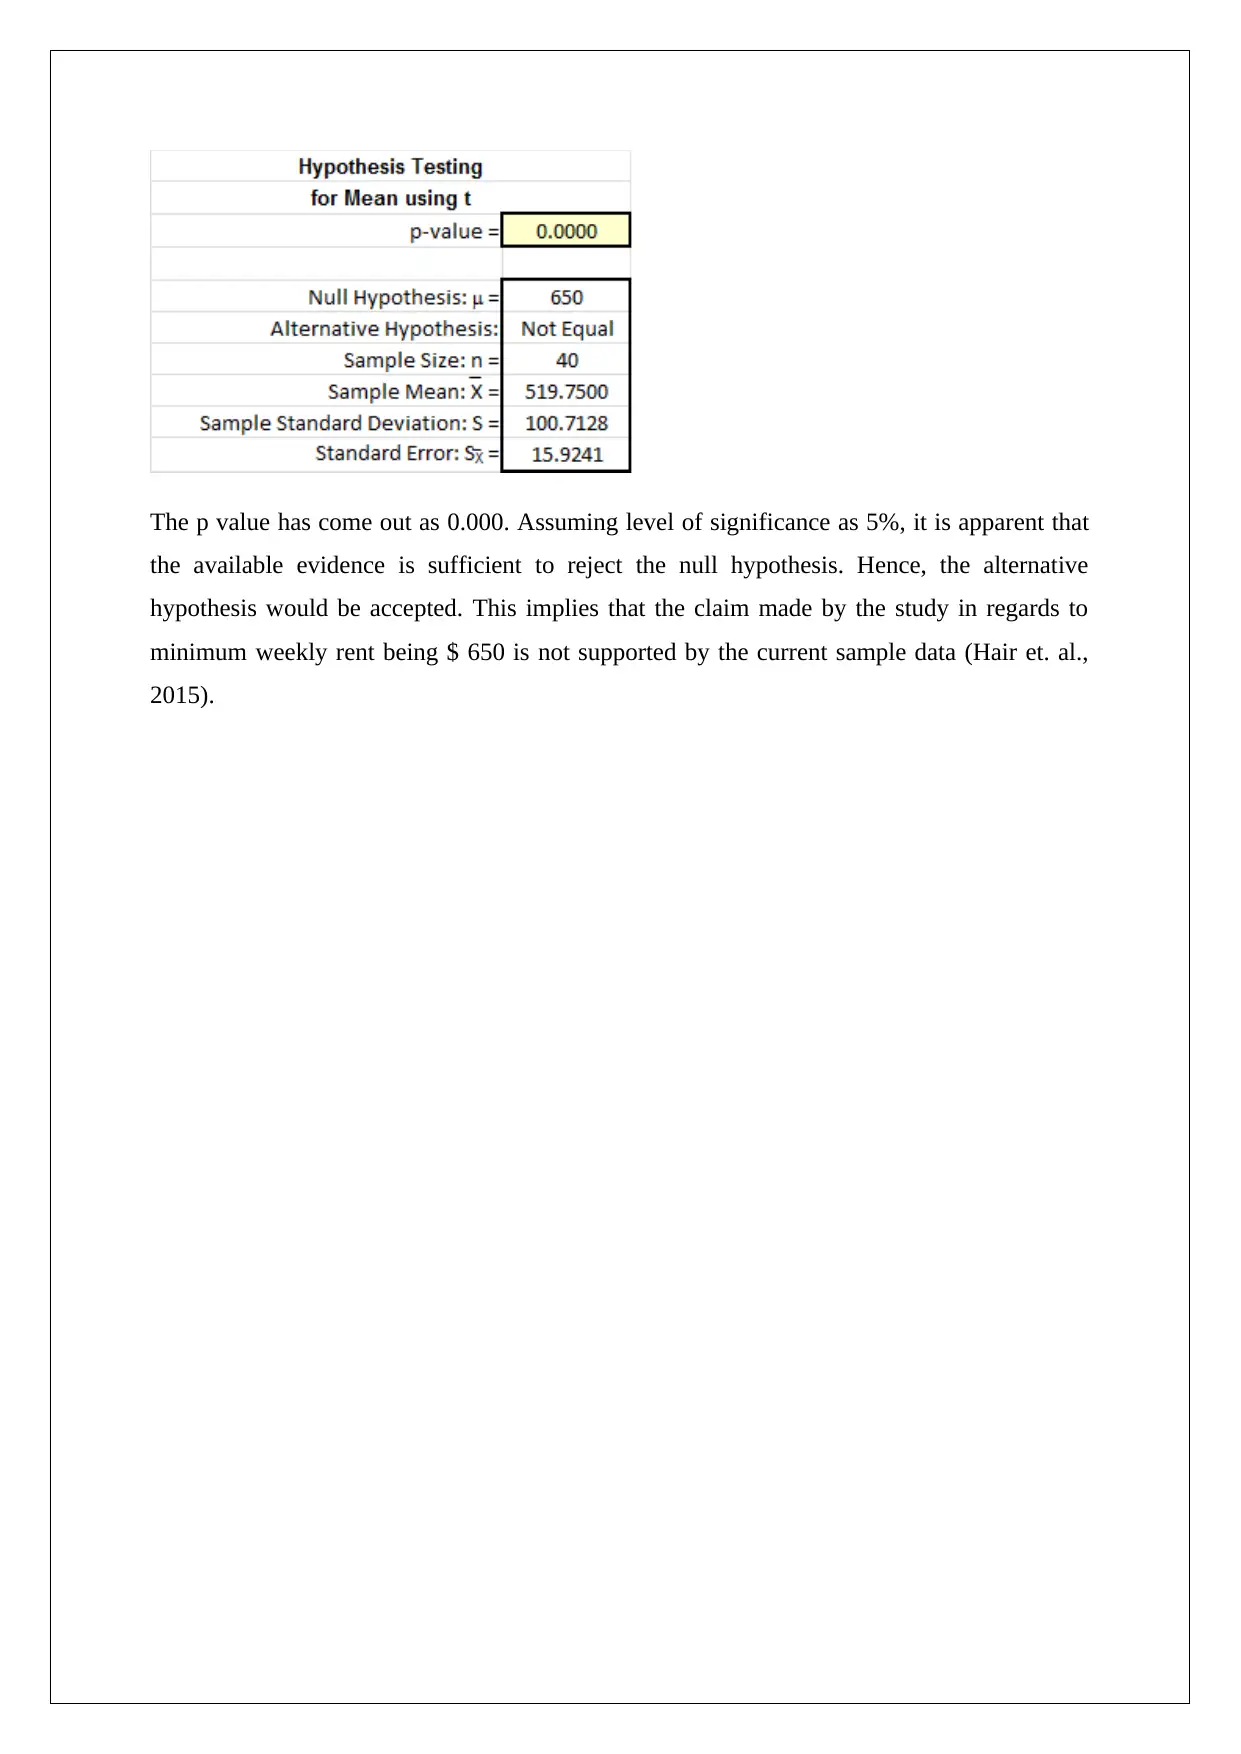
This statistics assignment analyzes weekly rent data, focusing on central tendency measures like mean and median to compare rent prices across different suburbs (Auburn, Hurstville, and Parramatta). It investigates hypotheses related to rent proportions and the impact of dishwashers. The analysis includes p-value calculations, scatter plots to assess the relationship between rent and public transport access, and the computation of 95% confidence intervals for average weekly rent in Sydney. The assignment also compares Sydney and Melbourne rent through confidence intervals and conducts a hypothesis test to evaluate a claim regarding minimum weekly rent in Sydney. The analysis utilizes statistical methods and tools, including Excel, and references relevant research methodologies and business research publications.
1 out of 6
Related Documents


Your All-in-One AI-Powered Toolkit for Academic Success.
+13062052269
info@desklib.com
Available 24*7 on WhatsApp / Email
![[object Object]](/_next/static/media/star-bottom.7253800d.svg)
Copyright © 2020–2026 A2Z Services. All Rights Reserved. Developed and managed by ZUCOL.