MBA403 Financial and Economic Interpretation Case Study Analysis
VerifiedAdded on  2022/10/02
|4
|1043
|27
Case Study
AI Summary
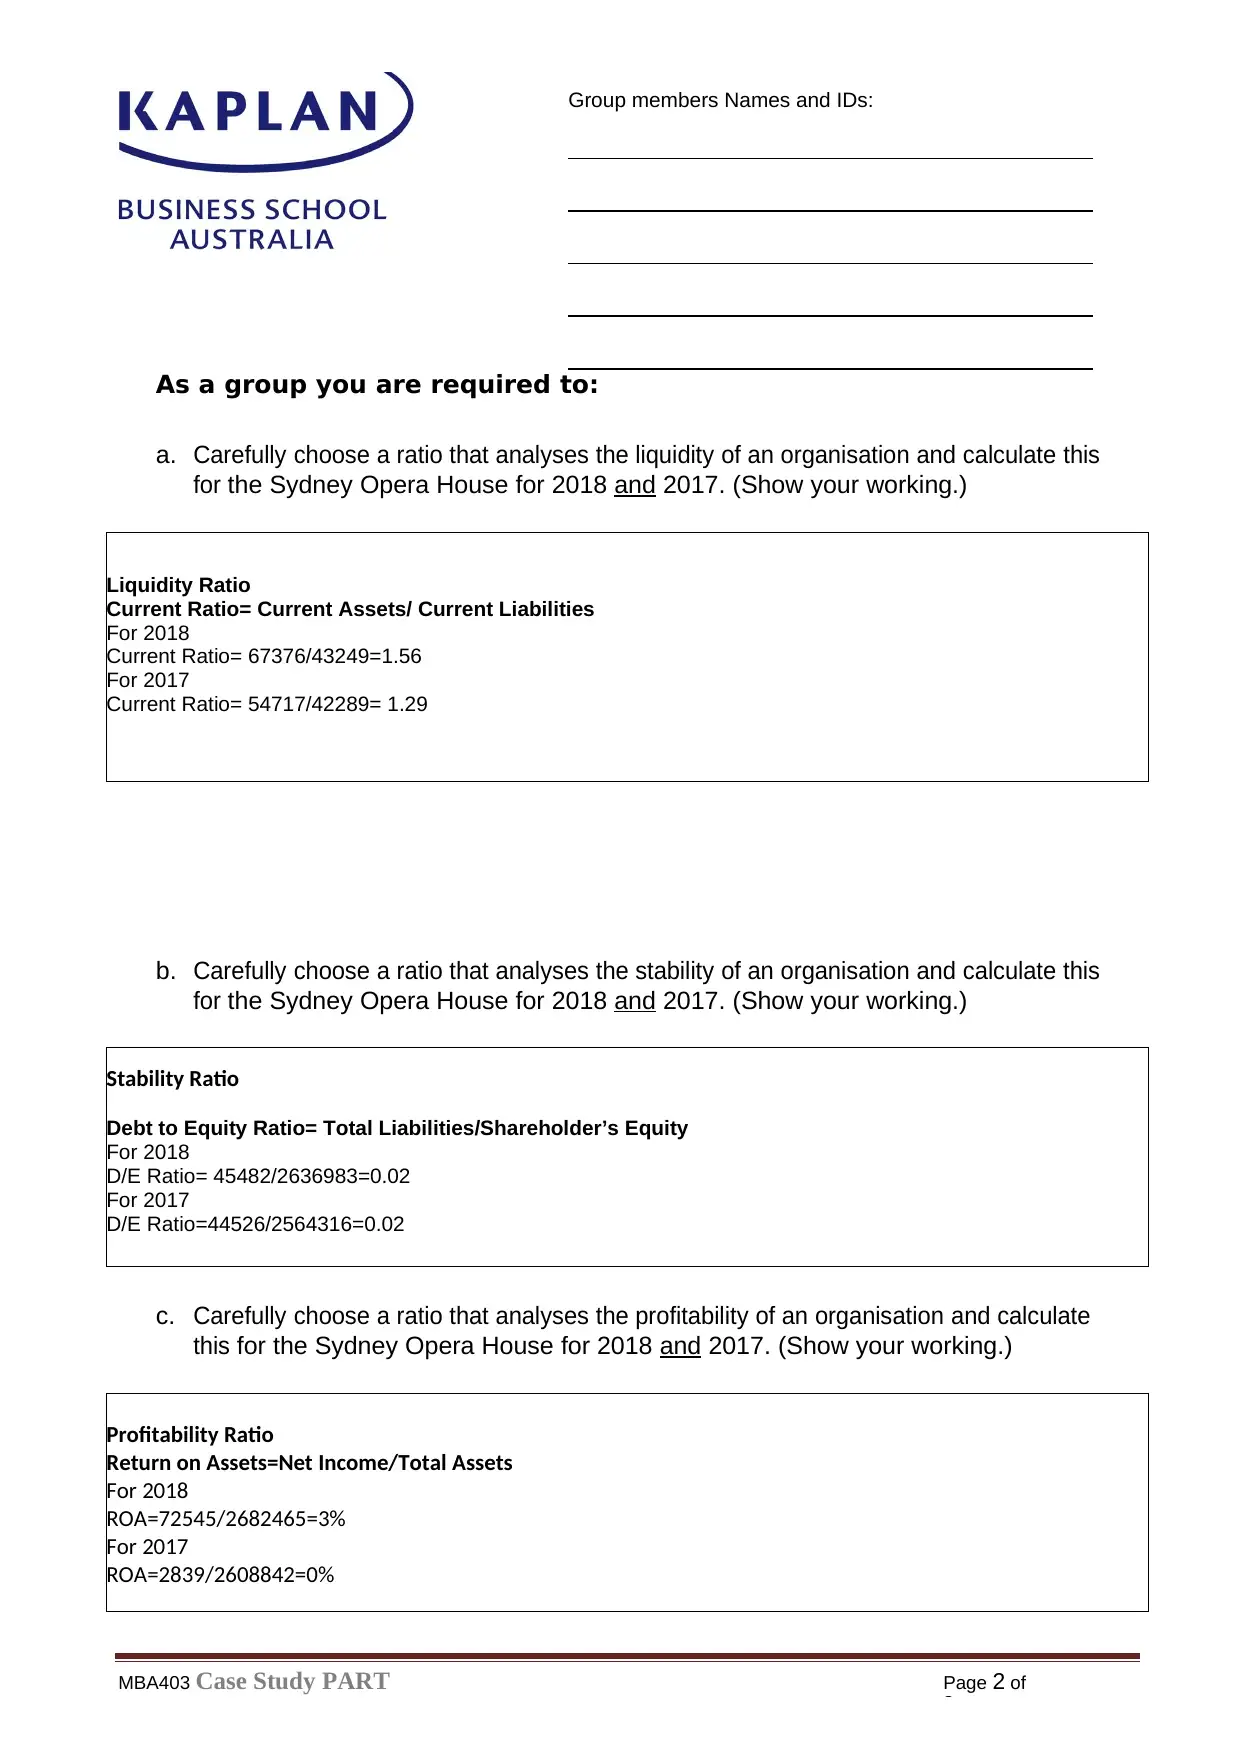
This case study analyzes the financial performance of the Sydney Opera House, focusing on the years 2017 and 2018. The analysis includes the calculation and interpretation of key financial ratios such as the current ratio (liquidity), debt-to-equity ratio (stability), and return on assets (profitability). The solution demonstrates the calculations, explains the choice of each ratio, and interprets the financial health of the organization based on the calculated values. Additionally, the case study identifies and explains the source of revenue that poses the most significant business risk to the Sydney Opera House, which is government grants and contributions. The student highlights the importance of diversifying revenue streams to mitigate this risk. The document also includes references to relevant financial literature used to support the analysis.

Group members Names and IDs:
MBA403 Case Study PART
A
Page 1 of
3
Campus (please circle): Adelaide Brisbane Melbourne Sydney
Postgraduate
Group Case Study:
PART A 2019
Trimester 2
Subject Code: MBA403
Subject Title: Financial and Economic Interpretation and
Communication Length of Case Study: 50 minutes
Total Number of Questions: Parts A – E
Total Marks: 20% for both PART A and PART B
READ THE FOLLOWING INSTRUCTIONS BEFORE COMMENCING THE CLASS
TEST
1. Prior to class students need to choose their groups of 4-5 as this entire activity
will be completed in these groups.
2. Students may bring in ANY materials they wish. Laptops and phones are fine and groups
may go on the internet to access any sites they want.
3. Students may NOT confer between groups, or share resources from other groups.
4. Students will be given Part A of the case study and have 30 minutes to complete it
in their group.
5. Each group needs to submit a single version of this booklet to their lecturer for
marking.
Paraphrase This Document
Need a fresh take? Get an instant paraphrase of this document with our AI Paraphraser

Group members Names and IDs:
Page 2 of
3
MBA403 Case Study PART
A
As a group you are required to:
a. Carefully choose a ratio that analyses the liquidity of an organisation and calculate this
for the Sydney Opera House for 2018 and 2017. (Show your working.)
Liquidity Ratio
Current Ratio= Current Assets/ Current Liabilities
For 2018
Current Ratio= 67376/43249=1.56
For 2017
Current Ratio= 54717/42289= 1.29
b. Carefully choose a ratio that analyses the stability of an organisation and calculate this
for the Sydney Opera House for 2018 and 2017. (Show your working.)
Stability Ratio
Debt to Equity Ratio= Total Liabilities/Shareholder’s Equity
For 2018
D/E Ratio= 45482/2636983=0.02
For 2017
D/E Ratio=44526/2564316=0.02
c. Carefully choose a ratio that analyses the profitability of an organisation and calculate
this for the Sydney Opera House for 2018 and 2017. (Show your working.)
Profitability Ratio
Return on Assets=Net Income/Total Assets
For 2018
ROA=72545/2682465=3%
For 2017
ROA=2839/2608842=0%

Group members Names and IDs:
Page 3 of
3
MBA403 Case Study PART
A
d. Explain why you have specifically chosen each ratio. Explain what your ratio
analyses suggest about the financial status of the Sydney Opera House.
The ratios that have been taken into consideration for the analysis of Sydney Opera
House are liquidity ratio, stability ratio and profitability ratio. In the liquidity ratio, current ratio is
calculated. The current ratio is chosen because it helps in measuring the ability of the
company for paying its short-term obligations that is due within the year. Hence, the liquidity
position of the company shows that in comparison to the year 2017, the ability of the company
for meeting its short-term obligations has been increased. Moreover, for analyzing the stability
ratio, debt to equity ratio is calculated. This ratio is chosen for the analysis because it helps to
measure the financial health of the company as it shows the proportion of debt and equity,
which the company holds (Williams and Dobelman 2017). Hence, the debt to equity ratio of
the company shows that for both the year 2017 and 2018, the company is using high level of
equity in comparison to debt. This indicates that the Sydney Opera House finances maximum
assets by the equity. Lastly, the third ratio calculated for analyzing the profitability of the
company is return on assets. This ratio is calculated because it helps in measuring the
income, which is produced by the total assets of the company. The company usually invests
into the capital assets and return is then measured in terms of profits. Hence, the return on
assets of both the years shows that there has been increase of ROA by 3% from the year
2017 to 2018. It means that Sydney Opera House is in better position in the year 2018
because it is able to get return on its capital assets (Robinson et al.2015).
e. Of all the revenue sources listed in the Resources Booklet Case Study for the Sydney
Opera House, which source shows the most business risk? Explain your reasons
why.
The revenue of Sydney Opera House is from sale of goods and services, investment
⊘ This is a preview!⊘
Do you want full access?
Subscribe today to unlock all pages.

Trusted by 1+ million students worldwide

Group members Names and IDs:
Page 4 of
3
MBA403 Case Study PART
A
revenue, sponsorship revenue, donation revenue as well as from the grants and
contribution. As it is seen, that maximum of the revenue comes from the government
grants that are 23% then philanthropy, which is 10% that is then followed by other income
and sponsorship. It the grants and contribution is not provided to the company then it will
be possessing greater amount of business risk. Business risk is the potential condition or
the events, which negatively affects the future revenue of the organization. Moreover,
contributions are generally transfer of the assets, which are voluntary, nonreciprocal as
well as unconditional (Choi, Chan and Yue 2016). Since, the government or the private
funders provide these contribution and grants, in case if they neglect and do not approve
the grants and contribution to the Sydney Opera House then the financial condition of the
company will be at great risk as it would not be able to generate revenue. Hence, Sydney
Opera House should not depend solely on grants and contribution for the revenue rather
they should try to generate revenue from the other sources for reducing the risk of
business (Sadgrove 2016).
References
Choi, T.M., Chan, H.K. and Yue, X., 2016. Recent development in big data analytics for
business operations and risk management. IEEE transactions on cybernetics, 47(1), pp.81-
92.
Robinson, T.R., Henry, E., Pirie, W.L. and Broihahn, M.A., 2015. International financial
statement analysis. John Wiley & Sons.
Sadgrove, K., 2016. The complete guide to business risk management. Routledge.
Williams, E.E. and Dobelman, J.A., 2017. Financial statement analysis. World Scientific Book
Chapters, pp.109-169.
1 out of 4
Related Documents

Your All-in-One AI-Powered Toolkit for Academic Success.
 +13062052269
info@desklib.com
Available 24*7 on WhatsApp / Email
Unlock your academic potential
Copyright © 2020–2025 A2Z Services. All Rights Reserved. Developed and managed by ZUCOL.