Integrated Business Management Project - Sydney Restaurants Analysis
VerifiedAdded on 2020/02/18
|11
|1231
|38
Project
AI Summary
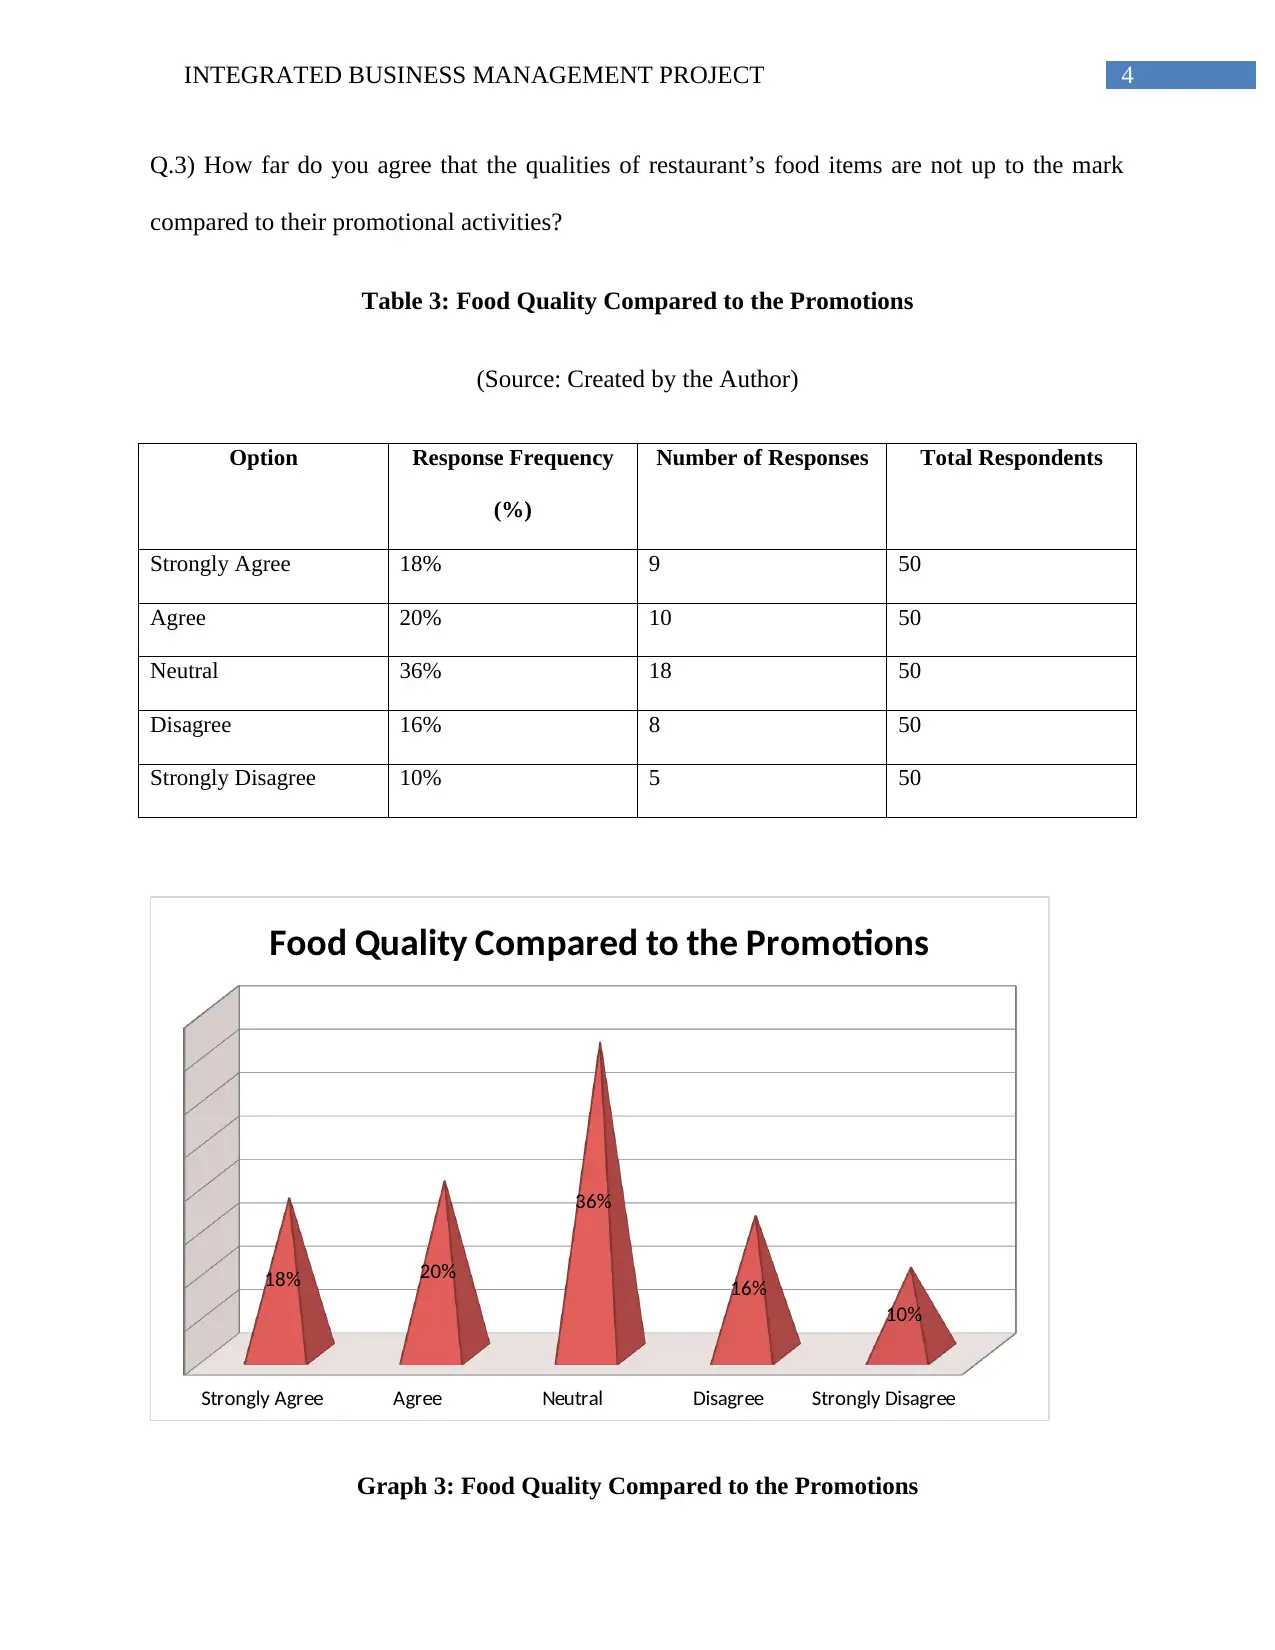
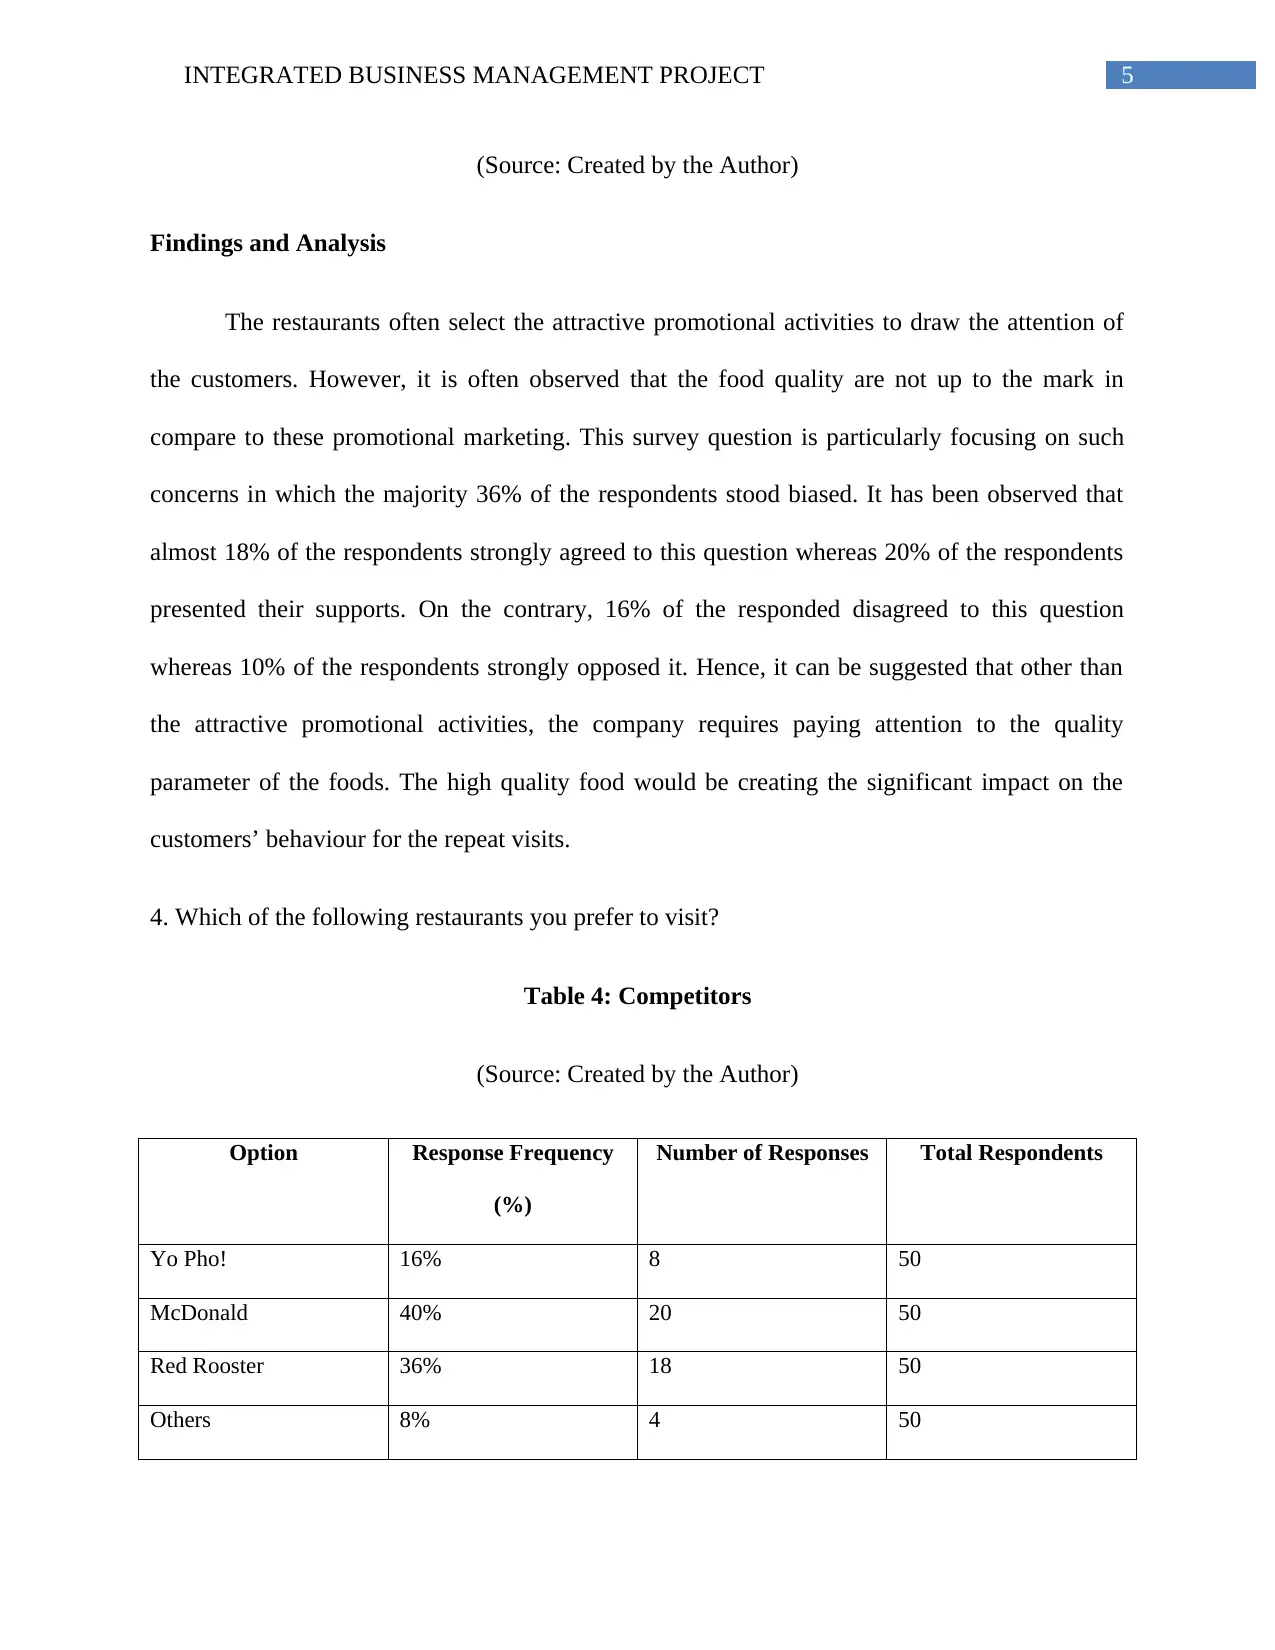
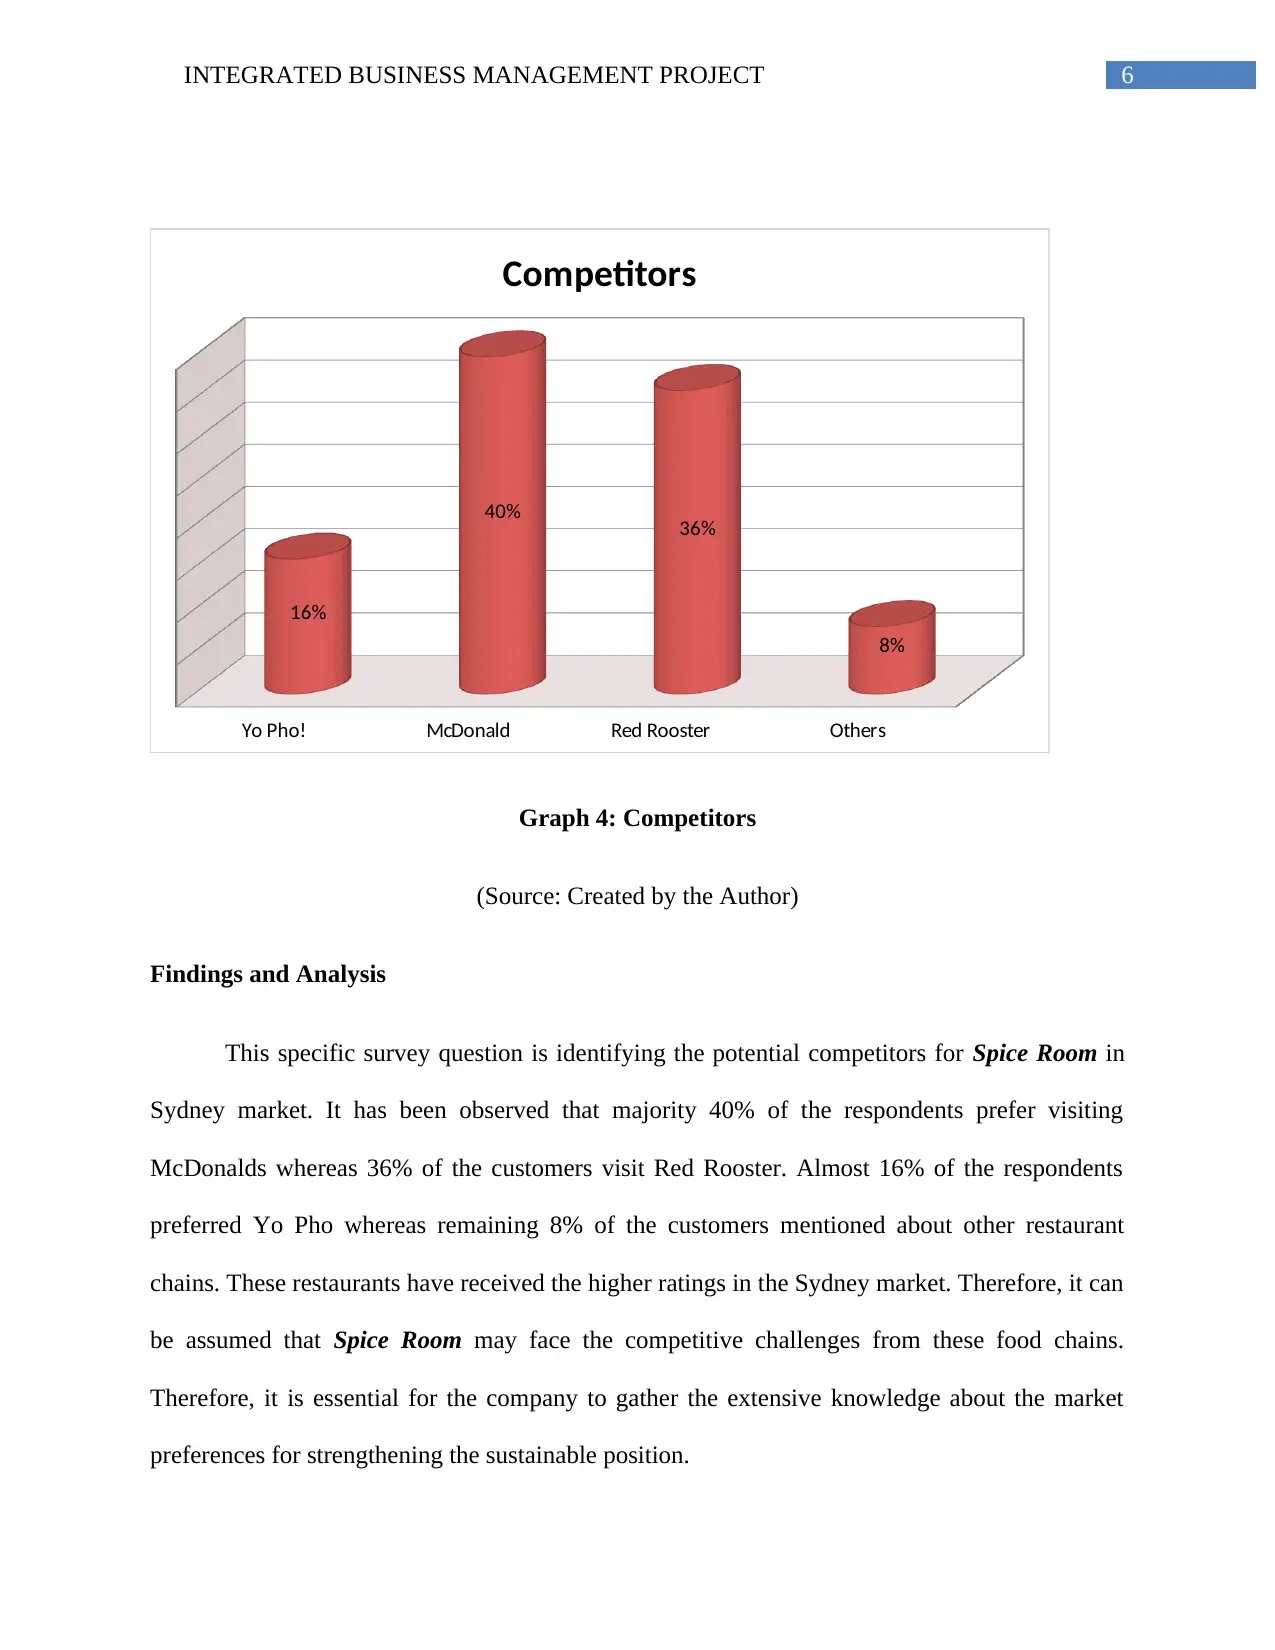
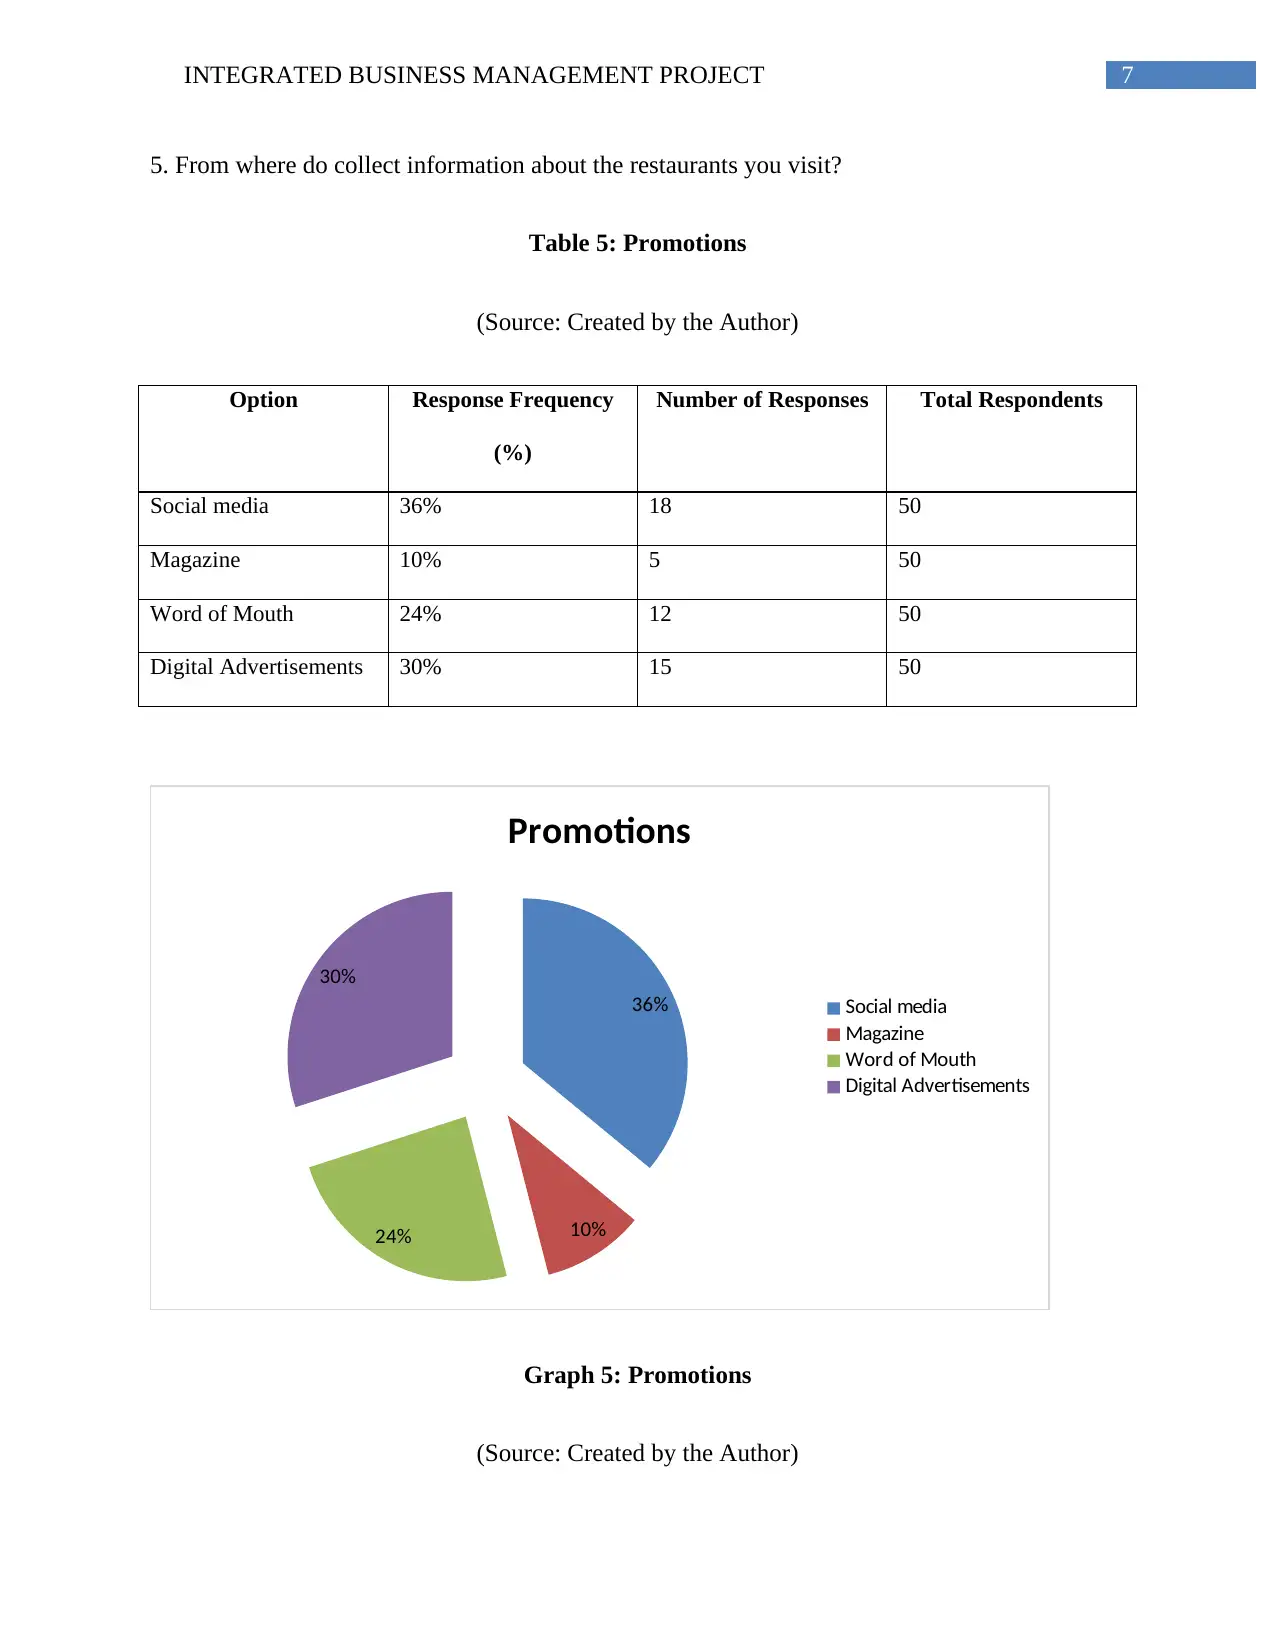
This integrated business management project analyzes the Sydney restaurant market through a customer survey. The research investigates customer visit frequency, influencing factors (food/service quality, price, ambience, location, hospitality), and the relationship between food quality and promotional activities. Competitor analysis identifies key players like McDonald's, Red Rooster, and Yo Pho!. The study also explores how customers gather information about restaurants, including social media, digital advertisements, word of mouth, and magazines. Findings suggest the importance of food quality, effective promotional strategies, and understanding competitor dynamics for success in the Sydney restaurant market. The project provides valuable insights for businesses aiming to enhance customer satisfaction and market position.

Running head: INTEGRATED BUSINESS MANAGEMENT PROJECT
Integrated business management project
Name of the student:
Name of the university:
Author note:
Integrated business management project
Name of the student:
Name of the university:
Author note:
Paraphrase This Document
Need a fresh take? Get an instant paraphrase of this document with our AI Paraphraser

1INTEGRATED BUSINESS MANAGEMENT PROJECT
Research Findings:
Q.1) How often you visit the restaurants in Sydney?
Table 1: Number of Visits
(Source: Created by the Author)
Option Response Frequency
(%)
Number of Responses Total Respondents
Once in a Week 28% 14 50
Once in a month 32% 16 50
Quite often 24% 12 50
Rare 16% 8 50
Once in a Week Once in a month Quite often Rare
28%
32%
24%
16%
Number of Visits
Graph 1: Number of Visits

2INTEGRATED BUSINESS MANAGEMENT PROJECT
(Source: Created by Author)
Findings and Analysis
The survey question follows the number of the customer visits to the restaurants in
Sydney. The obtained idea from the survey specifies that majority 32% of the respondents visit
the restaurants once in a month whereas almost 28% of the customers visit once in a week. In
fact, almost 24% of the customers are frequently visiting the restaurants in Sydney. These ratios
specify that the people from Sydney are maintaining the social lifestyles and they prefer visiting
the restaurants so often. Hence, it can be suggested that the expansion of the Spice Room in
Sydney market would be opportune for the business in terms of developing the customer base.
Q.2) Which of the following factors influence your visit to the restaurants?
Table 2: Influencing Factors
(Source: Created by the Author)
Option Response Frequency
(%)
Number of Responses Total Respondents
Food/Service Quality 24% 12 50
Price 20% 10 50
Ambience 22% 11 50
Location 16% 8 50
Hospitality 18% 9 50
⊘ This is a preview!⊘
Do you want full access?
Subscribe today to unlock all pages.

Trusted by 1+ million students worldwide

3INTEGRATED BUSINESS MANAGEMENT PROJECT
24%
20%
22%
16%
18%
Influencing Factors
Graph 2: Influencing Factors
(Source: Created by the Author)
Findings and Analysis
The question is focusing on the specific factors that have the significance influence on the
customers’ perceptions of visiting restaurants. The idea derived from this survey indicates that
majority 24% of the customers are influenced by the food quality, which is an area of the
positive ‘word of mouth’. On the other hand, this ratio is followed by 22% in ambience and 20%
in the price structures. Remaining 16% of the respondents mentioned about the location whereas
18% of the customers mentioned about the hospitality. The survey result clarifies that Spice
Room requires paying attention more on these factors since these determine the satisfactory rates
of the customers. Reaching to the level of customer satisfaction would help the company to gain
more profitability for the future run.
Paraphrase This Document
Need a fresh take? Get an instant paraphrase of this document with our AI Paraphraser

4INTEGRATED BUSINESS MANAGEMENT PROJECT
Q.3) How far do you agree that the qualities of restaurant’s food items are not up to the mark
compared to their promotional activities?
Table 3: Food Quality Compared to the Promotions
(Source: Created by the Author)
Option Response Frequency
(%)
Number of Responses Total Respondents
Strongly Agree 18% 9 50
Agree 20% 10 50
Neutral 36% 18 50
Disagree 16% 8 50
Strongly Disagree 10% 5 50
Strongly Agree Agree Neutral Disagree Strongly Disagree
18% 20%
36%
16%
10%
Food Quality Compared to the Promotions
Graph 3: Food Quality Compared to the Promotions

5INTEGRATED BUSINESS MANAGEMENT PROJECT
(Source: Created by the Author)
Findings and Analysis
The restaurants often select the attractive promotional activities to draw the attention of
the customers. However, it is often observed that the food quality are not up to the mark in
compare to these promotional marketing. This survey question is particularly focusing on such
concerns in which the majority 36% of the respondents stood biased. It has been observed that
almost 18% of the respondents strongly agreed to this question whereas 20% of the respondents
presented their supports. On the contrary, 16% of the responded disagreed to this question
whereas 10% of the respondents strongly opposed it. Hence, it can be suggested that other than
the attractive promotional activities, the company requires paying attention to the quality
parameter of the foods. The high quality food would be creating the significant impact on the
customers’ behaviour for the repeat visits.
4. Which of the following restaurants you prefer to visit?
Table 4: Competitors
(Source: Created by the Author)
Option Response Frequency
(%)
Number of Responses Total Respondents
Yo Pho! 16% 8 50
McDonald 40% 20 50
Red Rooster 36% 18 50
Others 8% 4 50
(Source: Created by the Author)
Findings and Analysis
The restaurants often select the attractive promotional activities to draw the attention of
the customers. However, it is often observed that the food quality are not up to the mark in
compare to these promotional marketing. This survey question is particularly focusing on such
concerns in which the majority 36% of the respondents stood biased. It has been observed that
almost 18% of the respondents strongly agreed to this question whereas 20% of the respondents
presented their supports. On the contrary, 16% of the responded disagreed to this question
whereas 10% of the respondents strongly opposed it. Hence, it can be suggested that other than
the attractive promotional activities, the company requires paying attention to the quality
parameter of the foods. The high quality food would be creating the significant impact on the
customers’ behaviour for the repeat visits.
4. Which of the following restaurants you prefer to visit?
Table 4: Competitors
(Source: Created by the Author)
Option Response Frequency
(%)
Number of Responses Total Respondents
Yo Pho! 16% 8 50
McDonald 40% 20 50
Red Rooster 36% 18 50
Others 8% 4 50
⊘ This is a preview!⊘
Do you want full access?
Subscribe today to unlock all pages.

Trusted by 1+ million students worldwide

6INTEGRATED BUSINESS MANAGEMENT PROJECT
Yo Pho! McDonald Red Rooster Others
16%
40% 36%
8%
Competitors
Graph 4: Competitors
(Source: Created by the Author)
Findings and Analysis
This specific survey question is identifying the potential competitors for Spice Room in
Sydney market. It has been observed that majority 40% of the respondents prefer visiting
McDonalds whereas 36% of the customers visit Red Rooster. Almost 16% of the respondents
preferred Yo Pho whereas remaining 8% of the customers mentioned about other restaurant
chains. These restaurants have received the higher ratings in the Sydney market. Therefore, it can
be assumed that Spice Room may face the competitive challenges from these food chains.
Therefore, it is essential for the company to gather the extensive knowledge about the market
preferences for strengthening the sustainable position.
Paraphrase This Document
Need a fresh take? Get an instant paraphrase of this document with our AI Paraphraser

7INTEGRATED BUSINESS MANAGEMENT PROJECT
5. From where do collect information about the restaurants you visit?
Table 5: Promotions
(Source: Created by the Author)
Option Response Frequency
(%)
Number of Responses Total Respondents
Social media 36% 18 50
Magazine 10% 5 50
Word of Mouth 24% 12 50
Digital Advertisements 30% 15 50
36%
10%24%
30%
Promotions
Social media
Magazine
Word of Mouth
Digital Advertisements
Graph 5: Promotions
(Source: Created by the Author)

8INTEGRATED BUSINESS MANAGEMENT PROJECT
Findings and Analysis
The question specifies the effectiveness of the promotional strategies that help gathering
the customers’ attention. The idea obtained from the above question implies that majority 36% of
the respondents receive information from the social media sites whereas 30% of the respondents
mentioned about digital advertisements. On the other hand, it is also noted that the ‘word of
mouth’ has been influencing the customers in a significant way and almost 24% of the
respondents agreed to it. Remaining 10% of the respondents mentioned about the magazine.
However, it clarifies that Spice Room requires concentrating on undertaking the effective
promotional activities that would gather the attention of the customers towards the restaurants. In
such cases, selecting the relevant promotional medium is essential.
⊘ This is a preview!⊘
Do you want full access?
Subscribe today to unlock all pages.

Trusted by 1+ million students worldwide

9INTEGRATED BUSINESS MANAGEMENT PROJECT
Appendix:
Q.1) How often you visit the restaurants in Sydney?
o Once in a Week
o Once in a month
o Quite often
o Rare
Q.2) Which of the following factors influence your visit to the restaurants?
Food/Service Quality
o Price
o Ambience
o Location
o Hospitality
Q.3) How far do you agree that the qualities of restaurant’s food items are not up to the mark
compared to their promotional activities?
o Strongly Agree
o Agree
o Neutral
o Disagree
o Strongly Disagree
Paraphrase This Document
Need a fresh take? Get an instant paraphrase of this document with our AI Paraphraser

10INTEGRATED BUSINESS MANAGEMENT PROJECT
4. Which of the following restaurants you prefer to visit?
o Yo Pho!
o McDonald
o Red Rooster
o Others
5. From where do collect information about the restaurants you visit?
o Social media
o Magazine
o Word of Mouth
o Digital Advertisements
4. Which of the following restaurants you prefer to visit?
o Yo Pho!
o McDonald
o Red Rooster
o Others
5. From where do collect information about the restaurants you visit?
o Social media
o Magazine
o Word of Mouth
o Digital Advertisements
1 out of 11
Related Documents

Your All-in-One AI-Powered Toolkit for Academic Success.
+13062052269
info@desklib.com
Available 24*7 on WhatsApp / Email
Unlock your academic potential
© 2024 | Zucol Services PVT LTD | All rights reserved.