University Name Rainwater Harvesting Project: Sydney Rainfall Analysis
VerifiedAdded on 2020/05/11
|21
|6208
|38
Project
AI Summary
This project investigates rainwater harvesting potential in Sydney, Australia, focusing on five rainfall stations: Sydney (Observatory Hill), Seven Hills, Richmond, Lucas Heights, and Badgerys Creek. The primary objective is to determine the most suitable tank model by analyzing rainfall data from the Australian Bureau of Meteorology and projected data from the World Bank for the periods 2020-39 and 2040-79. The study utilizes the CMIP3 global climate model for rainfall projections and compares it with CMIP5. Various tank models ranging from 2.5KL to 10KL are considered, evaluating their water-saving capacity, roof size, demand, and reliability. The analysis includes data collection, comparison of CMIP3 and CMIP5 models, and the computation of data for general equations related to tank models, leading to the identification of optimal tank sizes for each location. The project emphasizes the importance of rainwater harvesting for sustainable water management and provides a detailed assessment of current gaps and future potential.

1
Rainwater harvesting Sydney
<Student iD>
<Student Name>
<University Name>
Rainwater harvesting Sydney
<Student iD>
<Student Name>
<University Name>
Paraphrase This Document
Need a fresh take? Get an instant paraphrase of this document with our AI Paraphraser
2
Contents
Introduction................................................................................................................................3
Brief description of the 5 rainfall stations..................................................................................3
Primary Objective......................................................................................................................4
Data Collection and Analysis.....................................................................................................5
Selection of data.........................................................................................................................5
Analysis of collected data..........................................................................................................6
Comparison between CMIP3 and CMIP5 global climate model...............................................7
1. Coupled Model Intercomparison Project (CMIP3) refers to a set of climate model
experiment that is the largest and most inclusive global coupled climate model..............7
2. The CMIP3 model was introduced prior to CMIP5 but its projection model makes it a
highly preferred model as compared to its counterpart......................................................7
3. The existing CMIP3 climate projections are highly popular since these models take
into account the various factors that have an impact on the environment and climate......7
Tank models – Computation of data for general equation.........................................................8
Results and Discussion.............................................................................................................10
Annual water saving capacity and Reliability..........................................................................14
Current Gaps............................................................................................................................15
Conclusion................................................................................................................................16
References................................................................................................................................16
3
Brief description of the 5 rainfall stations
The Sydney (Observatory Hill)rainfall station is one of the areas of the research study. As per
the available data, for the period 2012, the area experiences an average of 101 mm of rainfall.
This figure indicates that the requirements of the tank must be based on the rainwater that can
be actually conserved in order to be used in the future. The reliability, water saving capacity
and tank size has been taken into consideration so that the most suitable tank model can be
selected for the water storage purpose (Aye, et al., 2014).
As per the estimation for the period 2020-39, the area would experience a total of 753.05 mm
rainfall during the period and it would have an average of 62.75 mm of rainfall. As per the
estimation for the period 2040-79, the area would experience rainfall of 767.52 mm during
the year with an average of 63.96 mm of rainfall (Campisano, et al., 2017).
Seven Hills rainfall station is the second area of the research study. The data that has been
captured shows the rainfall details for the year 1973. As per the available data, for the period
1973, the area experiences an average of 75.99 mm of rainfall. As per the estimation for the
period 2020-39, the area would experience a total of 726.05 mm rainfall during the period
and it would have an average of 60.05 mm of rainfall. Similarly, for the period 2040-79, it
has been estimated that the area would experience rainfall of 768.19 mm during the year with
an average of 64 mm of rainfall (Castonguay, et al., 2016).
The Richmond is the third area of the research study. In 1933, the area experiences an
average of 66.68 mm of rainfall. As per the estimation for the period 2020-39 the area would
experience a total of 1186.35 mm rainfall during the period and it would have an average of
98.86 mm of rainfall. Similarly, for the period 2040-79, it has been estimated that the area
would experience rainfall of 768.19 mm during the year with an average of 64 mm of rainfall.
Lucas Heights is the fourth area of the research study. The data for the year 1986 indicate that
it had experienced 85.65 mm of rainfall on an average in the year. As per the estimation for
the period 2020-39, the area would experience a total of 753.05 mm rainfall during the period
and it would have an average of 62.75 mm of rainfall. Similarly, for the period 2040-79, it
has been estimated that the area would experience rainfall of 768.19 mm during the year with
an average of 64 mm of rainfall (Christian Amos, Rahman&MwangiGathenya, 2016).
Badgerys Creek is the final area of the research study. The data of rainfall has been captured
for the year 2003. It indicates that the average amount of rainfall that the area has
⊘ This is a preview!⊘
Do you want full access?
Subscribe today to unlock all pages.
Trusted by 1+ million students worldwide
4
experienced is 48.73 mm. According to the estimations, for the period 2020-39 the area
would experience a total of 684.92 mm rainfall during the period and it would have an
average of 57.07 mm of rainfall. For the period 2040-79, it has been estimated that the area
would experience rainfall of 695.54 mm during the year with an average of 57.96 mm of
rainfall (Coombes, 2015).
Primary Objective
The main objective of conducting the study is to identify the most suitable tank model based
on the roof area, water storage capacity and tank size. The estimated amount of rainfall that is
supposed to happen for the period 2020-39 and 2040-79 have been made so that the tank can
be introduced to save maximum environmental water that can be used in the future
Data Collection and Analysis
A total of 5 different areas or stations have been considered in the research study for the
purpose of introduction of the tank system. The monthly rainfall data has been gathered from
the Bureau of meteorology and the estimated future data for the periods 2020-39 and 2040-79
have been collected from World Bank so that the originality of the study can be maintained
throughout the process. The CMIP3 model has been used to collect the futuristic data since
the model basically shows a higher tendency towards the decline in the rainfall that occurs in
the eastern and central Australia as compared to the CMIP5 model (Elgert, Austin
&Picchione, 2016).
The rainfall projections that have been included in the study form a vital segment of the entire
process since it helps to understand the rainfall projection that can influence the effectiveness
of the selected tank model.The table below represents the five stations that have been selected
for the particular task. The latitude and longitude of the areas have been presented so that the
amount of rainfall that has been predicted can be understood based on their geographic
location.
Rainfall stations Latitude Longitude Site Number Direction
Sydney (Observatory Hill) 33.85° S 151.20° E 066062 Central
Seven Hills 33.77° S 150.94° E 067026 North-West
Richmond-UWS
Hawkesbury
33.61° S 150.75° E 067021 North-West
Lucas Heights (ANSTO) 34.05° S 150.98° E 066078 South-West
Badgerys Creek AWS 33.90° S 150.73° E 067108 West
Paraphrase This Document
Need a fresh take? Get an instant paraphrase of this document with our AI Paraphraser
5
Selection of data
The following table presents the data relating to the amount of precipitation that is likely to
be experienced in the five rainfall stations in the periods 2020-39 and 2040-79. The projected
data that has been collected from World Bank indicates that during both the periods the
Sydney (Observatory Hill) is likely to experience 753 mm and 768 mm of rainfall. The Seven
Hills area would be experiencing the similar rainfall trend during the period. It would have
726 mm and 768 mm of rainfall during the specified periods. The same trend is not followed
in case of Richmond-UWS Hawkesbury rainfall station since in the period 2020-39 the area
will receive 1186 mm of rainfall whereas during 2040-79 the area would receive 768 mm of
rainfall. The Lucas Heights (ANSTO) region would be receiving 753 mm of rainfall and 768
mm of rainfall during 2020-39 and 2040-79 respectively (Floyd, et al., 2014).
It has been estimated that the final rainfall station that has been considered for the study –
Badgerys Creek AWS would receive the least amount of rainfall. During 2020-39 it would
receive 685 mm of rainfall and during the period 2040-79 it would receive 696 mm of
rainfall. The tabular representation shows the rainfall trend in the five selected rainfall
stations (Gao, Kim & Lee, 2014).
Rainfall
stations
Future
years
Ja
n
Fe
b
M
ar
A
pr
M
ay
Ju
n
J
ul
A
ug
Se
p
O
ct
N
ov
D
ec
Tota
l
rainf
all in
each
stati
on
p.a.
(mm
)
Sydney
(Observato
ry Hill)
2020-39 58 59 85 71 64 63 5
7 53 44 60 71 68 753
2040-79 72 79 89 55 51 68 6
2 62 52 51 55 72 768
Seven Hills
2020-39 58 59 58 71 64 63 5
7 53 44 60 71 68 726
2040-79 72 79 89 55 51 68 6
2 62 52 51 55 73 768
Richmond-
UWS
Hawkesbur
y
2020-39 58 49
2 85 71 64 63 5
7 53 44 60 71 68 1186
2040-79 72 79 89 55 51 68 6
2 62 52 51 55 73 768
Lucas
Heights
(ANSTO)
2020-39 58 59 85 71 64 63 5
7 53 44 60 71 68 753
2040-79 72 79 89 55 51 68 6 62 52 51 55 73 768
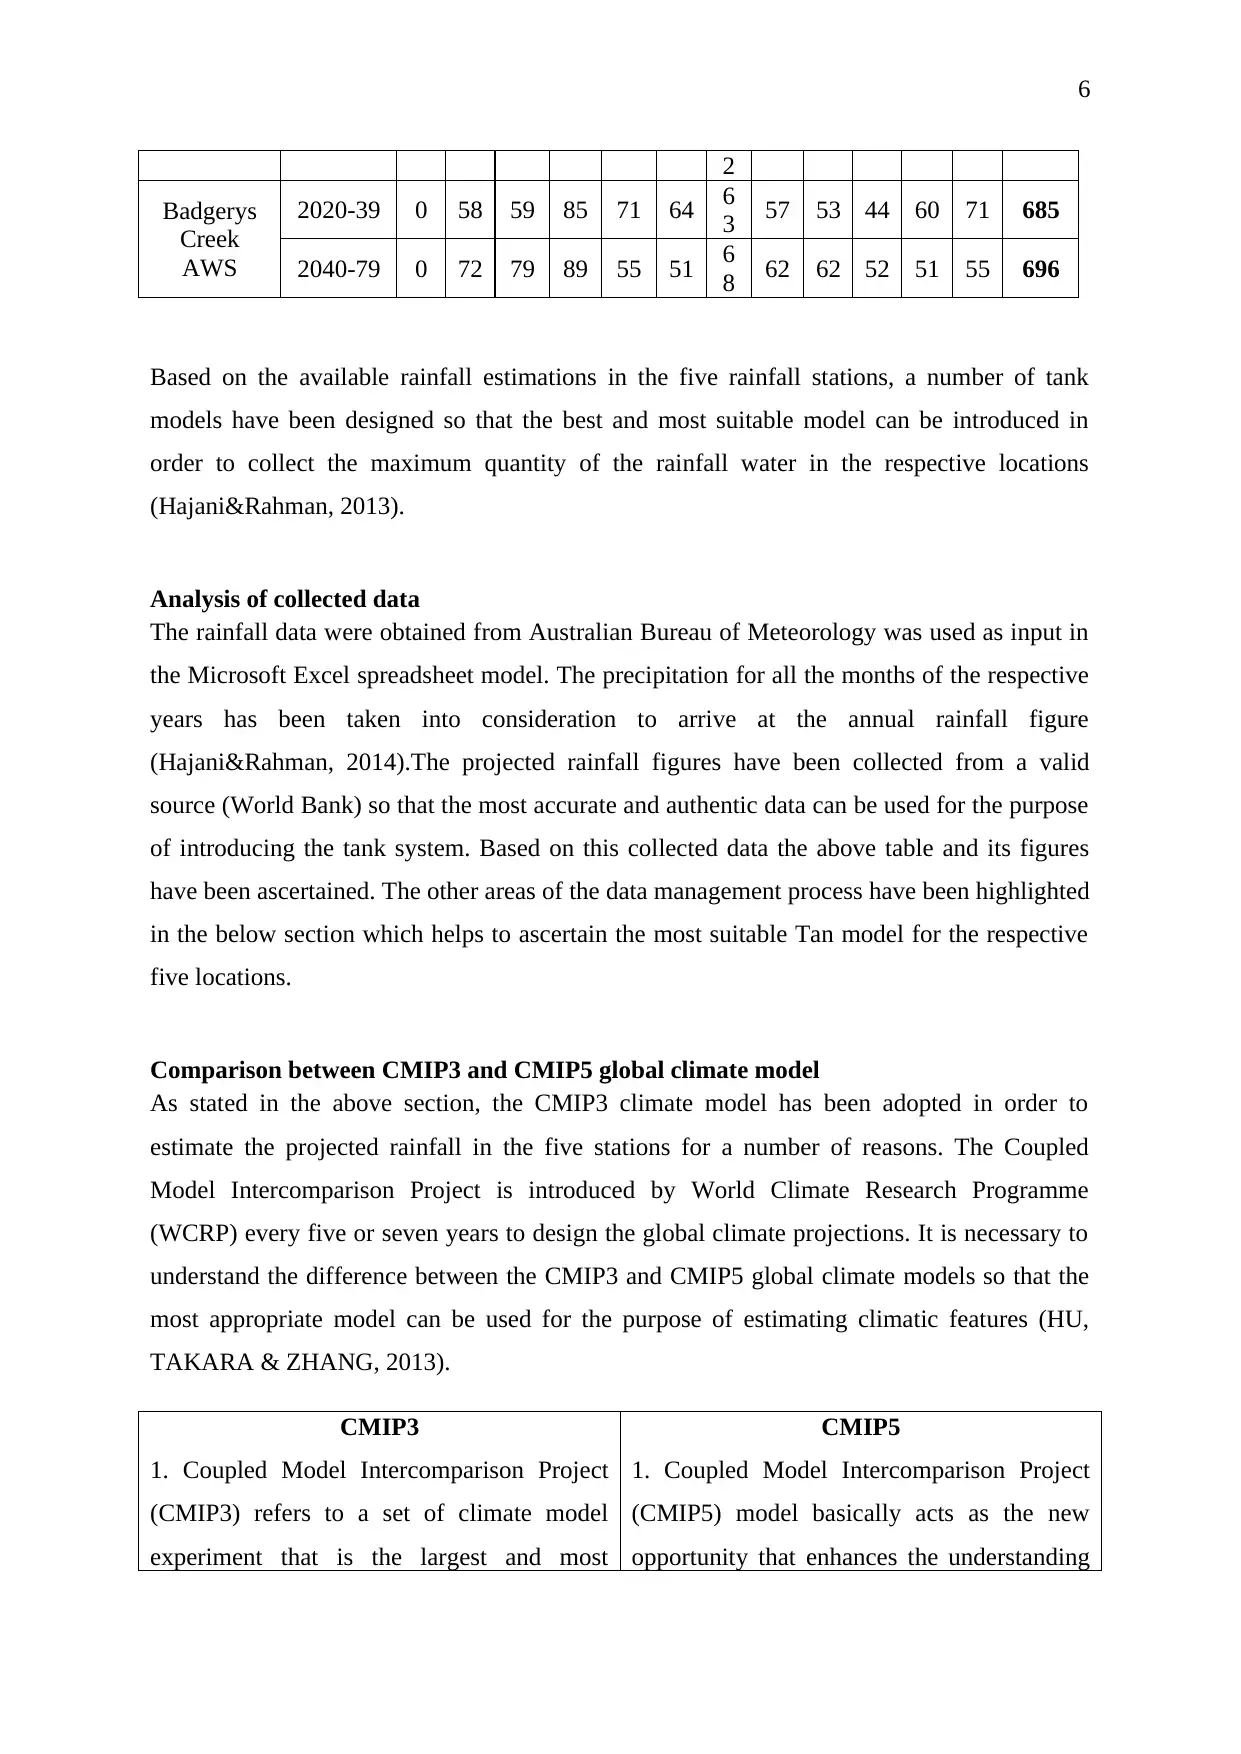
6
2
Badgerys
Creek
AWS
2020-39 0 58 59 85 71 64 6
3 57 53 44 60 71 685
2040-79 0 72 79 89 55 51 6
8 62 62 52 51 55 696
Based on the available rainfall estimations in the five rainfall stations, a number of tank
models have been designed so that the best and most suitable model can be introduced in
order to collect the maximum quantity of the rainfall water in the respective locations
(Hajani&Rahman, 2013).
Analysis of collected data
The rainfall data were obtained from Australian Bureau of Meteorology was used as input in
the Microsoft Excel spreadsheet model. The precipitation for all the months of the respective
years has been taken into consideration to arrive at the annual rainfall figure
(Hajani&Rahman, 2014).The projected rainfall figures have been collected from a valid
source (World Bank) so that the most accurate and authentic data can be used for the purpose
of introducing the tank system. Based on this collected data the above table and its figures
have been ascertained. The other areas of the data management process have been highlighted
in the below section which helps to ascertain the most suitable Tan model for the respective
five locations.
Comparison between CMIP3 and CMIP5 global climate model
As stated in the above section, the CMIP3 climate model has been adopted in order to
estimate the projected rainfall in the five stations for a number of reasons. The Coupled
Model Intercomparison Project is introduced by World Climate Research Programme
(WCRP) every five or seven years to design the global climate projections. It is necessary to
understand the difference between the CMIP3 and CMIP5 global climate models so that the
most appropriate model can be used for the purpose of estimating climatic features (HU,
TAKARA & ZHANG, 2013).
CMIP3
1. Coupled Model Intercomparison Project
(CMIP3) refers to a set of climate model
experiment that is the largest and most
CMIP5
1. Coupled Model Intercomparison Project
(CMIP5) model basically acts as the new
opportunity that enhances the understanding
⊘ This is a preview!⊘
Do you want full access?
Subscribe today to unlock all pages.
Trusted by 1+ million students worldwide
7
inclusive global coupled climate model.
2. The CMIP3 model was introduced prior to
CMIP5 but its projection model makes it a
highly preferred model as compared to its
counterpart.
3. The existing CMIP3 climate projections
are highly popular since these models take
into account the various factors that have an
impact on the environment and climate.
of the climate science.
2. The CMIP5 is a newer version of CMIP3
but this element does not make it a better and
more reliable model that can be used to
project various aspects of climate.
3. The CMIP5 global climate model can be
surely used as an additional model that can
support and strengthen the projection
outcome of CMIP3 but it cannot be used as a
replacement of the currently existing CMIP3
projection system.
Due to the reliability and accuracy of the CMIP3 model, the same has been used to predict
the rainfall for the periods 2020-39 and 2040-79.
Tank models– Computation of data for general equation
A number of tank models have been designed that have taken into account various internal
and external aspects including water saving capacity, roof size, demand, reliability, projected
rainfall. The key features of the systems have been highlighted so that ultimately the most
practical and simple yet effective tank model can be introduced for the purpose of water
storage in the rainfall stations (Imteaz, Moniruzzaman&Karim, 2017).
This research study has basically considered the tanks that range between 2.5KL to 10KL.
The four different tank sizes that have been selected include 2.5KL, 5KL, 7.5KL and 10KL
sizes which are the most common sizes of tanks that are used in Australia. The demand that
has been taken into account comes between 100KL and 500KL (Kandasamy,
Kus&Vigneswaran, 2016). The various influencing factors such as the evaporation of water,
overflow or loss of water and leakage have been taken into account while determining the
demand of the rainwater. Thus the average demand of rainwater comes to 100KL in each
rainfall station. These factors have been included in the data collection process since they
have a crucial bearing on the tank selection process (Kim, et al., 2016). The apt roof area of
the tanks is between 100 m2 to 500 m2 so that the optimum area of the tank could be utilized
for the purpose of storage of clean rainwater. In order to ascertain the best possible tank
Paraphrase This Document
Need a fresh take? Get an instant paraphrase of this document with our AI Paraphraser
8
selection output, the available data including the internal features of the tank system have
been considered for the five rainfall stations so that the annual water saving model can be
strengthened and a reliable model can be introduced based on the requirements of the
environmental water (Ladson, 2014).
Sydney (observatory Hill) rainfall station
The annual water saving model of Sydney (Observatory Hill) rainfall station for the different
tank sizes have been presented in the tabular form below:
Demand RA=200
Tank size 2500 5000 7500 10000
2020-39 200 64 70 71 71
400 89 106 115 120
2040-79 200 64 69 71 71
400 89 107 107 120
Current 200 62 67 71 71
400 55.1 63.3 105 109
Seven Hills rainfall station
The annual water saving model of Seven Hills rainfall station the different tank sizes have
been presented in the tabular form below:
Demand RA=200
Tank size 2500 5000 7500 10000
2020-39 200 64 69 70 70
400 90 108 114 117
2040-79 200 64 69 71 71
400 92 110 119 121
Current 200 63 69 71 71
400 84 99 106 108
Richmond-UWS Hawkesbury rainfall station
The annual water saving model of Richmond-UWS Hawkesbury rainfall station the different
tank sizes have been presented in the tabular form below:
Demand RA=200
9
Tank size 2500 5000 7500 10000
2020-39 200 60 68 71 71
400 76 101 112 117
2040-79 200 62 69 71 71
400 79 104 115 119
Current 200 51 60 67 70
400 67 83 93 98
Lucas Heights (ANSTO) rainfall station
The annual water saving model of Lucas Heights (ANSTO) rainfall station the different tank
sizes have been presented in the tabular form below:
Demand RA=200
Tank size 2500 5000 7500 10000
2020-39 200 54 66 71 71
400 77 96 107 115
2040-79 200 54 66 70 71
400 77 98 112 120
Current 200 57 65 68 70
400 70 83 92 99
Badgerys Creek AWS rainfall station
The annual water saving model of Badgerys Creek AWS rainfall station rainfall station the
different tank sizes have been presented in the tabular form below:
Demand RA=200
Tank size 2500 5000 7500 10000
2020-39 200 57 68 72 72
400 73 96 112 118
2040-79 200 57 69 71 72
400 72 95 110 120
Current 200 52 62 65 67
400 66 82 88 93
The annual water savings model corresponding to the respective roof areas and water demand
for all the five rainfall stations has been obtained as the particular output of the model. The
Tank size 2500 5000 7500 10000
2020-39 200 60 68 71 71
400 76 101 112 117
2040-79 200 62 69 71 71
400 79 104 115 119
Current 200 51 60 67 70
400 67 83 93 98
Lucas Heights (ANSTO) rainfall station
The annual water saving model of Lucas Heights (ANSTO) rainfall station the different tank
sizes have been presented in the tabular form below:
Demand RA=200
Tank size 2500 5000 7500 10000
2020-39 200 54 66 71 71
400 77 96 107 115
2040-79 200 54 66 70 71
400 77 98 112 120
Current 200 57 65 68 70
400 70 83 92 99
Badgerys Creek AWS rainfall station
The annual water saving model of Badgerys Creek AWS rainfall station rainfall station the
different tank sizes have been presented in the tabular form below:
Demand RA=200
Tank size 2500 5000 7500 10000
2020-39 200 57 68 72 72
400 73 96 112 118
2040-79 200 57 69 71 72
400 72 95 110 120
Current 200 52 62 65 67
400 66 82 88 93
The annual water savings model corresponding to the respective roof areas and water demand
for all the five rainfall stations has been obtained as the particular output of the model. The
⊘ This is a preview!⊘
Do you want full access?
Subscribe today to unlock all pages.
Trusted by 1+ million students worldwide
10
water saving capacity of all the tank sizes has been reflected for the stations so that the most
feasible tank size can be selected based on the projected rainfall that will be received in the
specific locations(Matos, et al., 2015).
The term “reliability” can be defined as the percentage of the days on which the rainwater
tank system is adequate to meet the specific water demand in the particular climatic setting. It
is an effective element that helps to determine the optimum size of rainwater tank in the
region where the rainwater tank could act as a major supplier of water.
Results and Discussion
Most feasible tank models for rainfall stations
After taking into account the various aspects such as the tank models have been determined.
The most suitable combination including the particular tank size, roof area, and water
demand form a vital part of the study to arrive at the most effective and suitable tank model
(Moglia, et al., 2016).
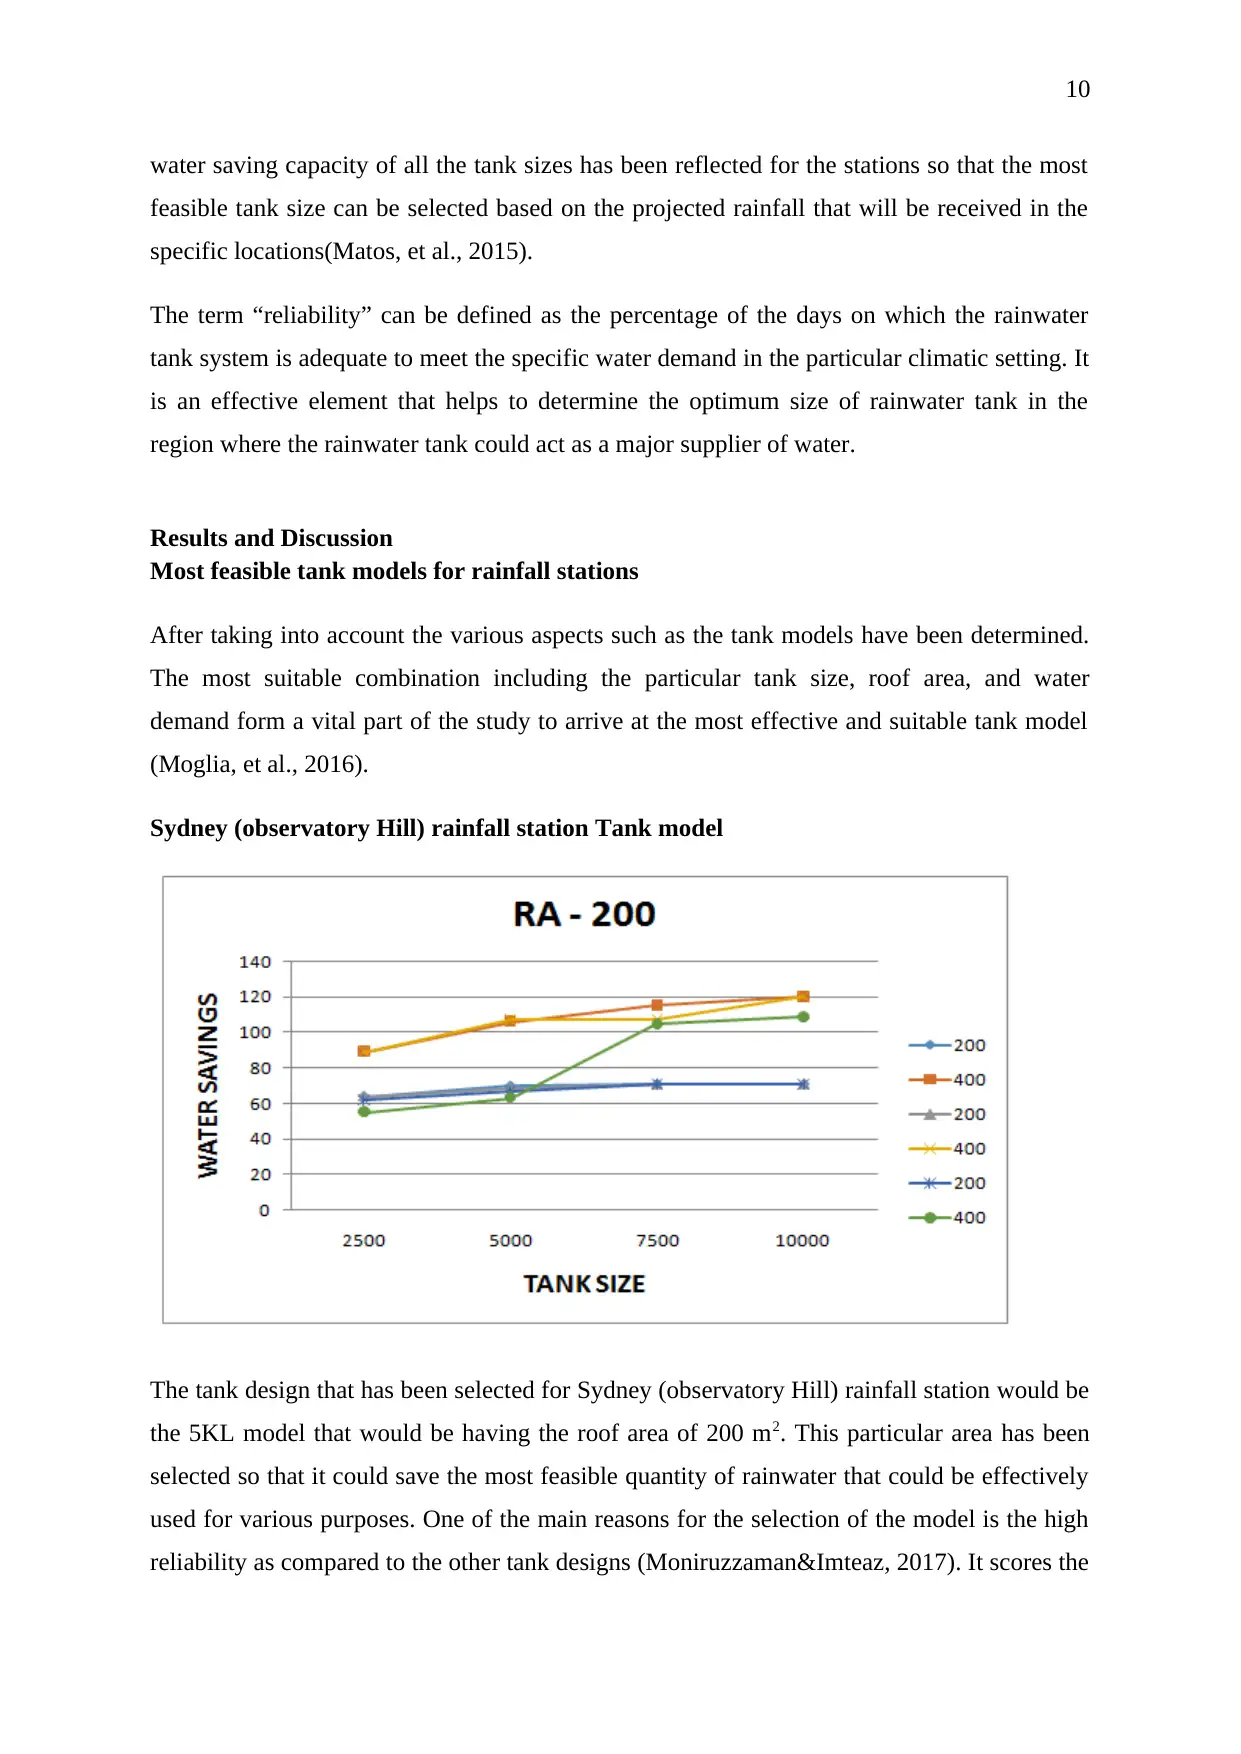
Sydney (observatory Hill) rainfall station Tank model
The tank design that has been selected for Sydney (observatory Hill) rainfall station would be
the 5KL model that would be having the roof area of 200 m2. This particular area has been
selected so that it could save the most feasible quantity of rainwater that could be effectively
used for various purposes. One of the main reasons for the selection of the model is the high
reliability as compared to the other tank designs (Moniruzzaman&Imteaz, 2017). It scores the
water saving capacity of all the tank sizes has been reflected for the stations so that the most
feasible tank size can be selected based on the projected rainfall that will be received in the
specific locations(Matos, et al., 2015).
The term “reliability” can be defined as the percentage of the days on which the rainwater
tank system is adequate to meet the specific water demand in the particular climatic setting. It
is an effective element that helps to determine the optimum size of rainwater tank in the
region where the rainwater tank could act as a major supplier of water.
Results and Discussion
Most feasible tank models for rainfall stations
After taking into account the various aspects such as the tank models have been determined.
The most suitable combination including the particular tank size, roof area, and water
demand form a vital part of the study to arrive at the most effective and suitable tank model
(Moglia, et al., 2016).
Sydney (observatory Hill) rainfall station Tank model
The tank design that has been selected for Sydney (observatory Hill) rainfall station would be
the 5KL model that would be having the roof area of 200 m2. This particular area has been
selected so that it could save the most feasible quantity of rainwater that could be effectively
used for various purposes. One of the main reasons for the selection of the model is the high
reliability as compared to the other tank designs (Moniruzzaman&Imteaz, 2017). It scores the
Paraphrase This Document
Need a fresh take? Get an instant paraphrase of this document with our AI Paraphraser
11
maximum in terms of reliability aspect,thus during the rainy period, the maximum quantity of
the water could be saved in the station. Even though the average demand is of rainwater is
100 KL, the model has been planned so that between 200 KL and 400 KL of rainfall can be
saved for productive purposes.
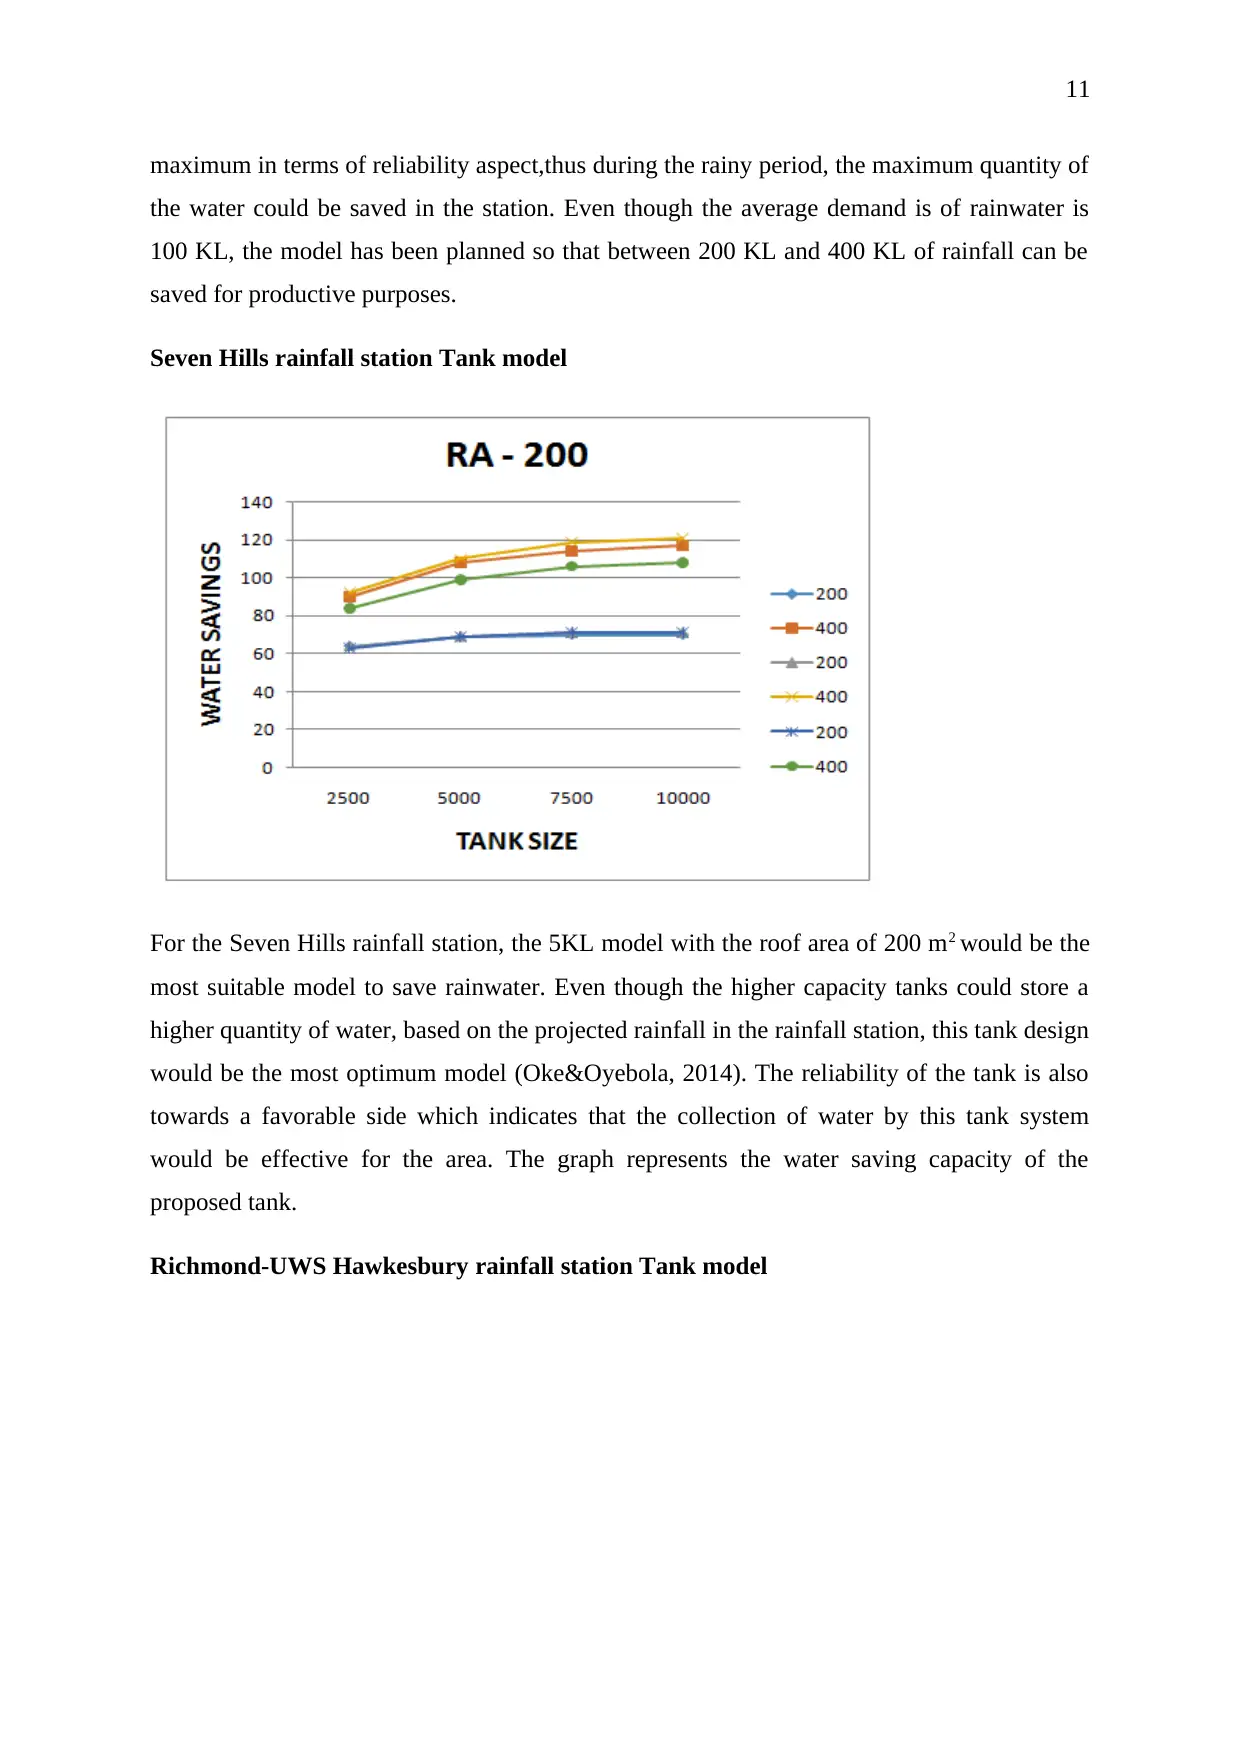
Seven Hills rainfall station Tank model
For the Seven Hills rainfall station, the 5KL model with the roof area of 200 m2 would be the
most suitable model to save rainwater. Even though the higher capacity tanks could store a
higher quantity of water, based on the projected rainfall in the rainfall station, this tank design
would be the most optimum model (Oke&Oyebola, 2014). The reliability of the tank is also
towards a favorable side which indicates that the collection of water by this tank system
would be effective for the area. The graph represents the water saving capacity of the
proposed tank.
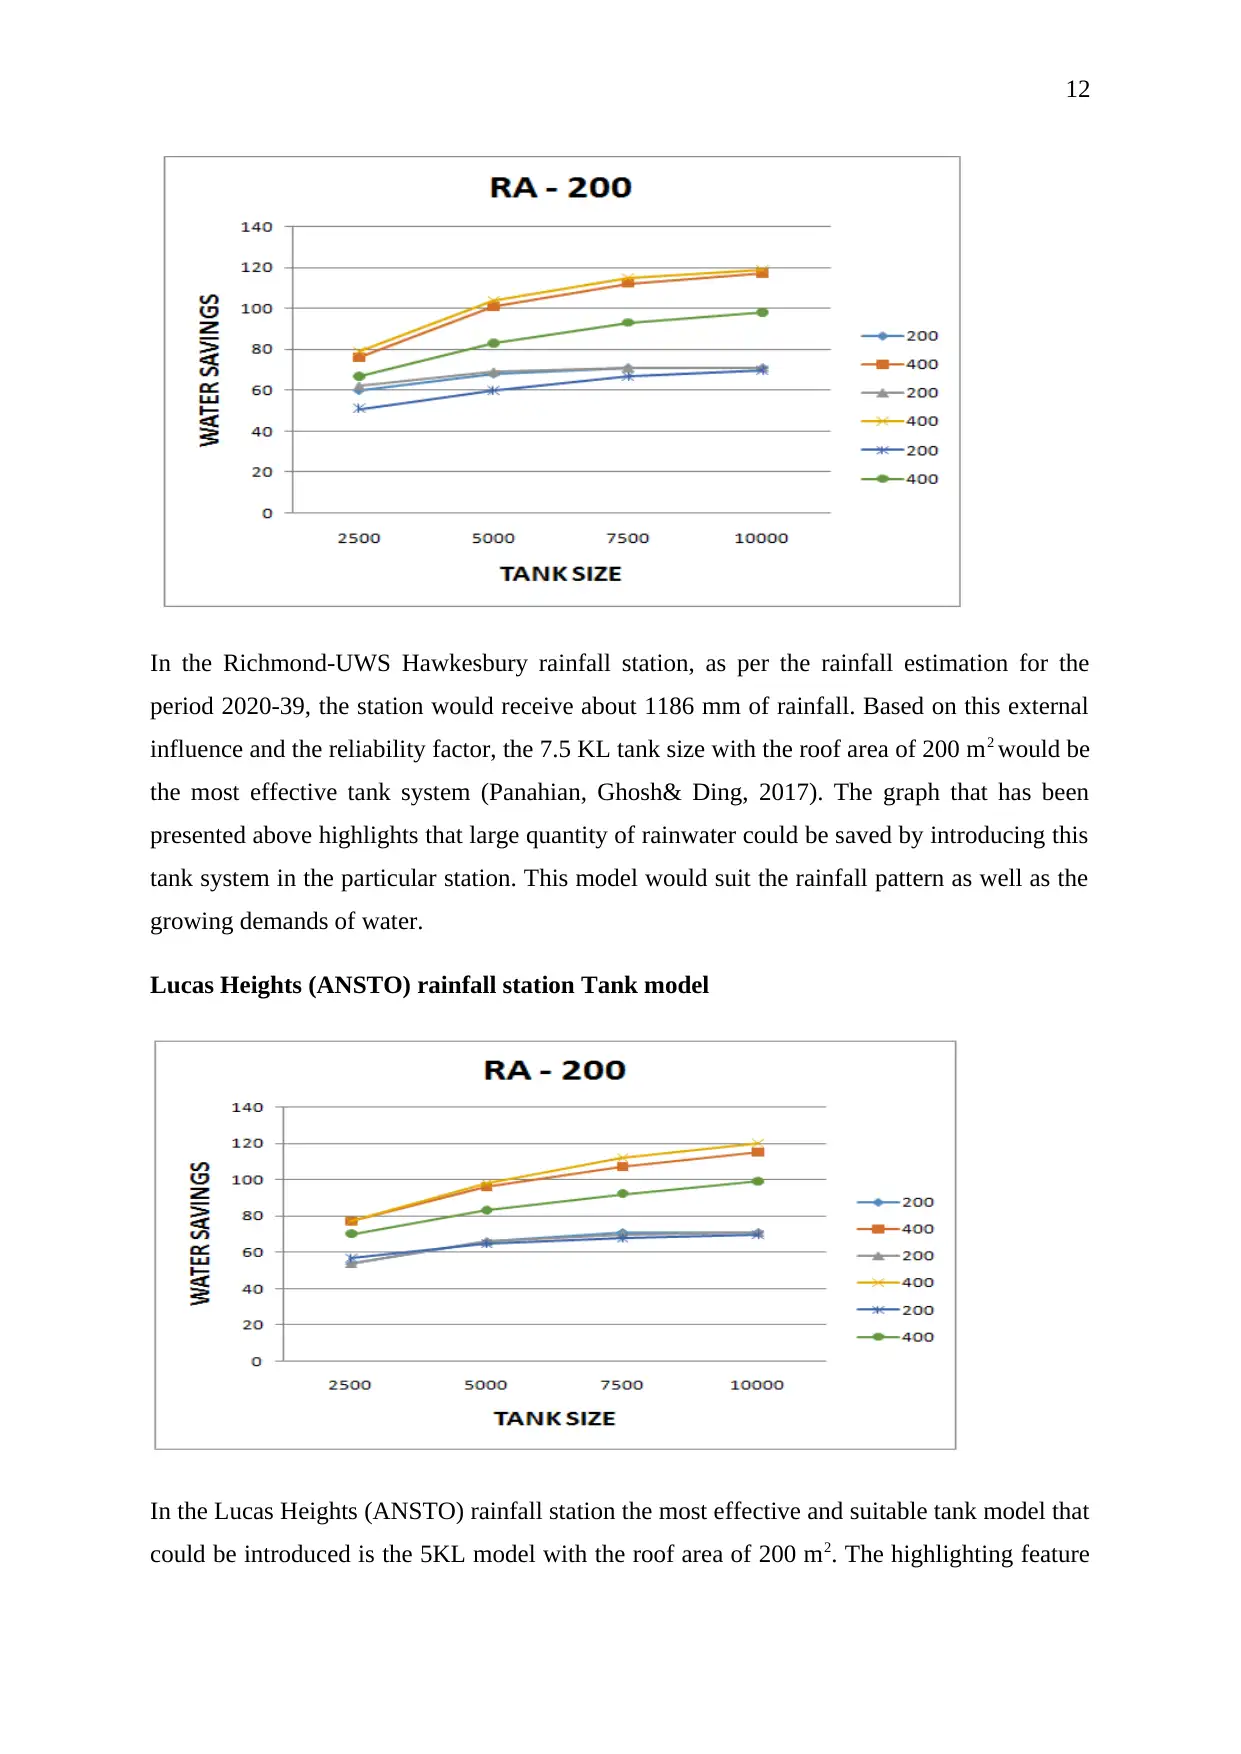
Richmond-UWS Hawkesbury rainfall station Tank model
maximum in terms of reliability aspect,thus during the rainy period, the maximum quantity of
the water could be saved in the station. Even though the average demand is of rainwater is
100 KL, the model has been planned so that between 200 KL and 400 KL of rainfall can be
saved for productive purposes.
Seven Hills rainfall station Tank model
For the Seven Hills rainfall station, the 5KL model with the roof area of 200 m2 would be the
most suitable model to save rainwater. Even though the higher capacity tanks could store a
higher quantity of water, based on the projected rainfall in the rainfall station, this tank design
would be the most optimum model (Oke&Oyebola, 2014). The reliability of the tank is also
towards a favorable side which indicates that the collection of water by this tank system
would be effective for the area. The graph represents the water saving capacity of the
proposed tank.
Richmond-UWS Hawkesbury rainfall station Tank model
12
In the Richmond-UWS Hawkesbury rainfall station, as per the rainfall estimation for the
period 2020-39, the station would receive about 1186 mm of rainfall. Based on this external
influence and the reliability factor, the 7.5 KL tank size with the roof area of 200 m2 would be
the most effective tank system (Panahian, Ghosh& Ding, 2017). The graph that has been
presented above highlights that large quantity of rainwater could be saved by introducing this
tank system in the particular station. This model would suit the rainfall pattern as well as the
growing demands of water.
Lucas Heights (ANSTO) rainfall station Tank model
In the Lucas Heights (ANSTO) rainfall station the most effective and suitable tank model that
could be introduced is the 5KL model with the roof area of 200 m2. The highlighting feature
⊘ This is a preview!⊘
Do you want full access?
Subscribe today to unlock all pages.
Trusted by 1+ million students worldwide
1 out of 21


Your All-in-One AI-Powered Toolkit for Academic Success.
+13062052269
info@desklib.com
Available 24*7 on WhatsApp / Email
![[object Object]](/_next/static/media/star-bottom.7253800d.svg)
Unlock your academic potential
Copyright © 2020–2026 A2Z Services. All Rights Reserved. Developed and managed by ZUCOL.