Project: Data Analysis and Forecasting of Sydney Wind Speed Data
VerifiedAdded on 2021/02/19
|8
|968
|163
Project
AI Summary
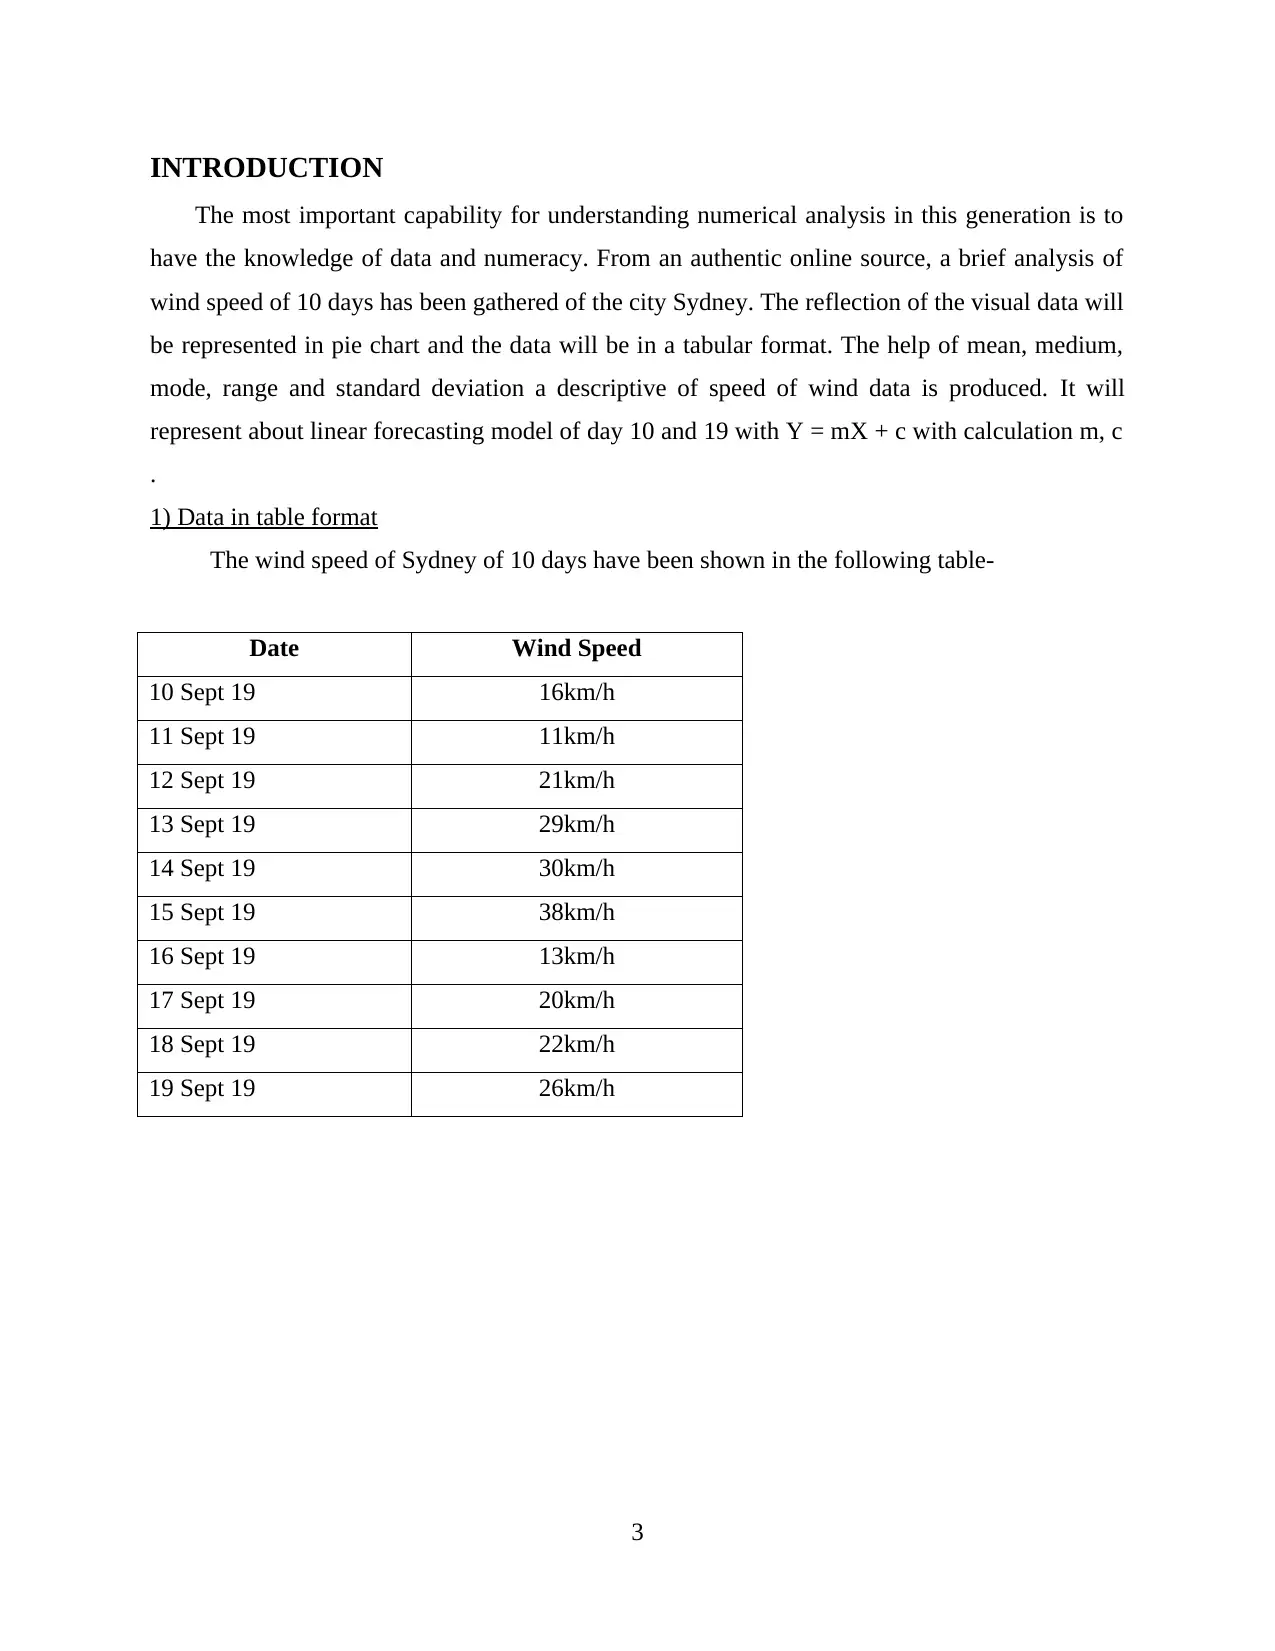
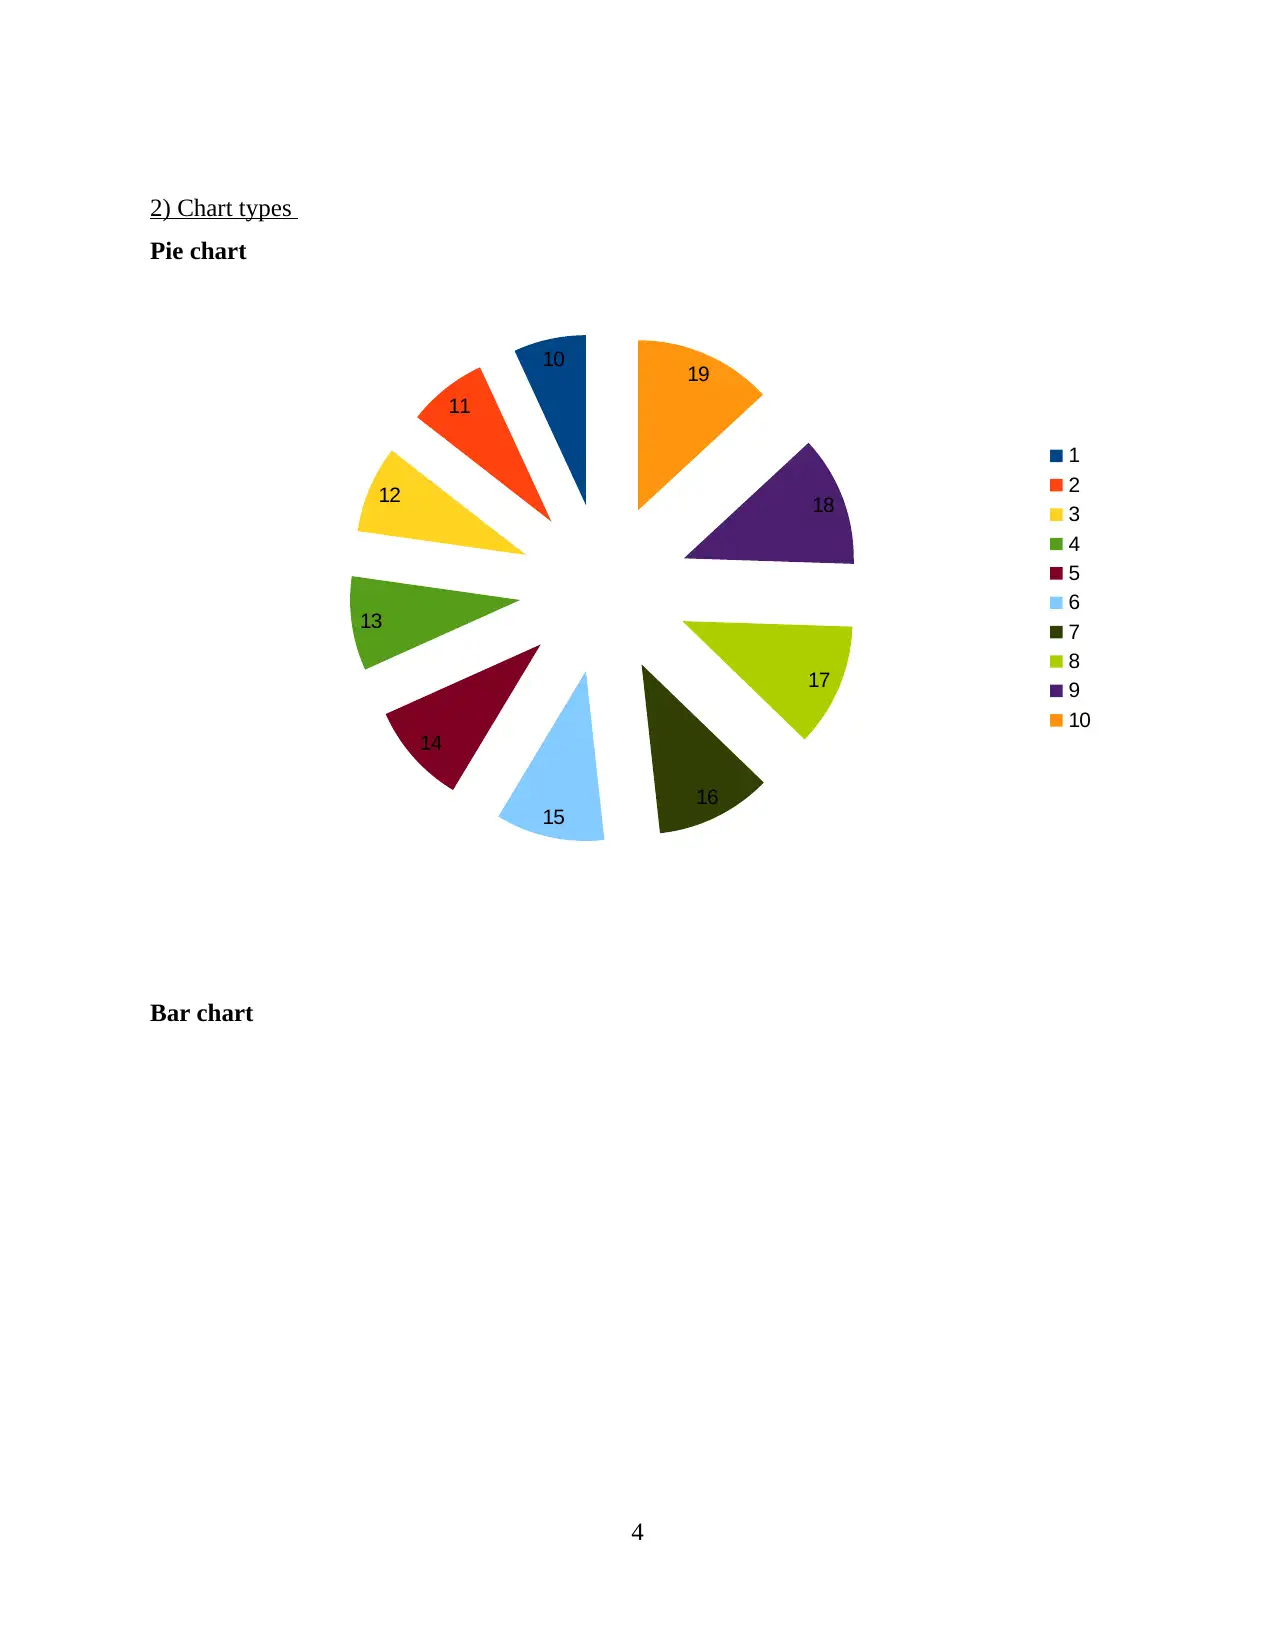
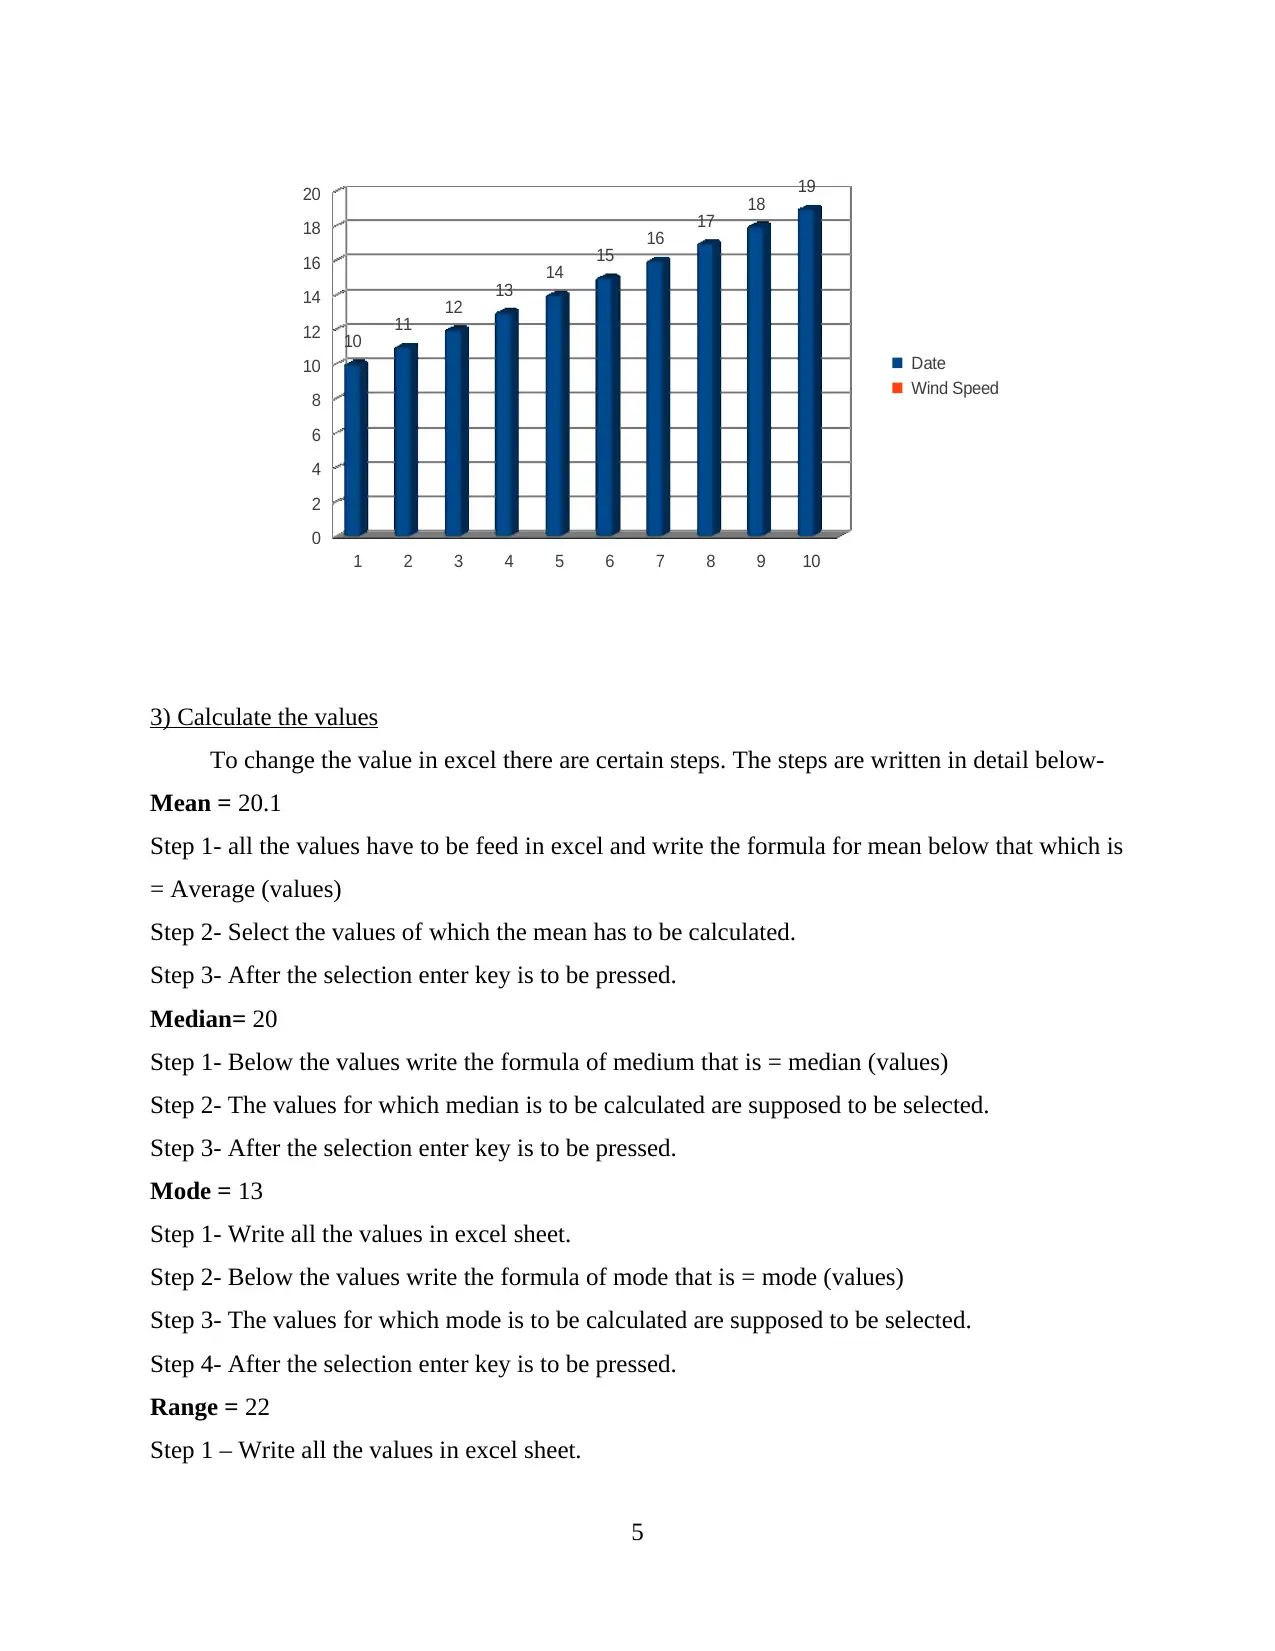
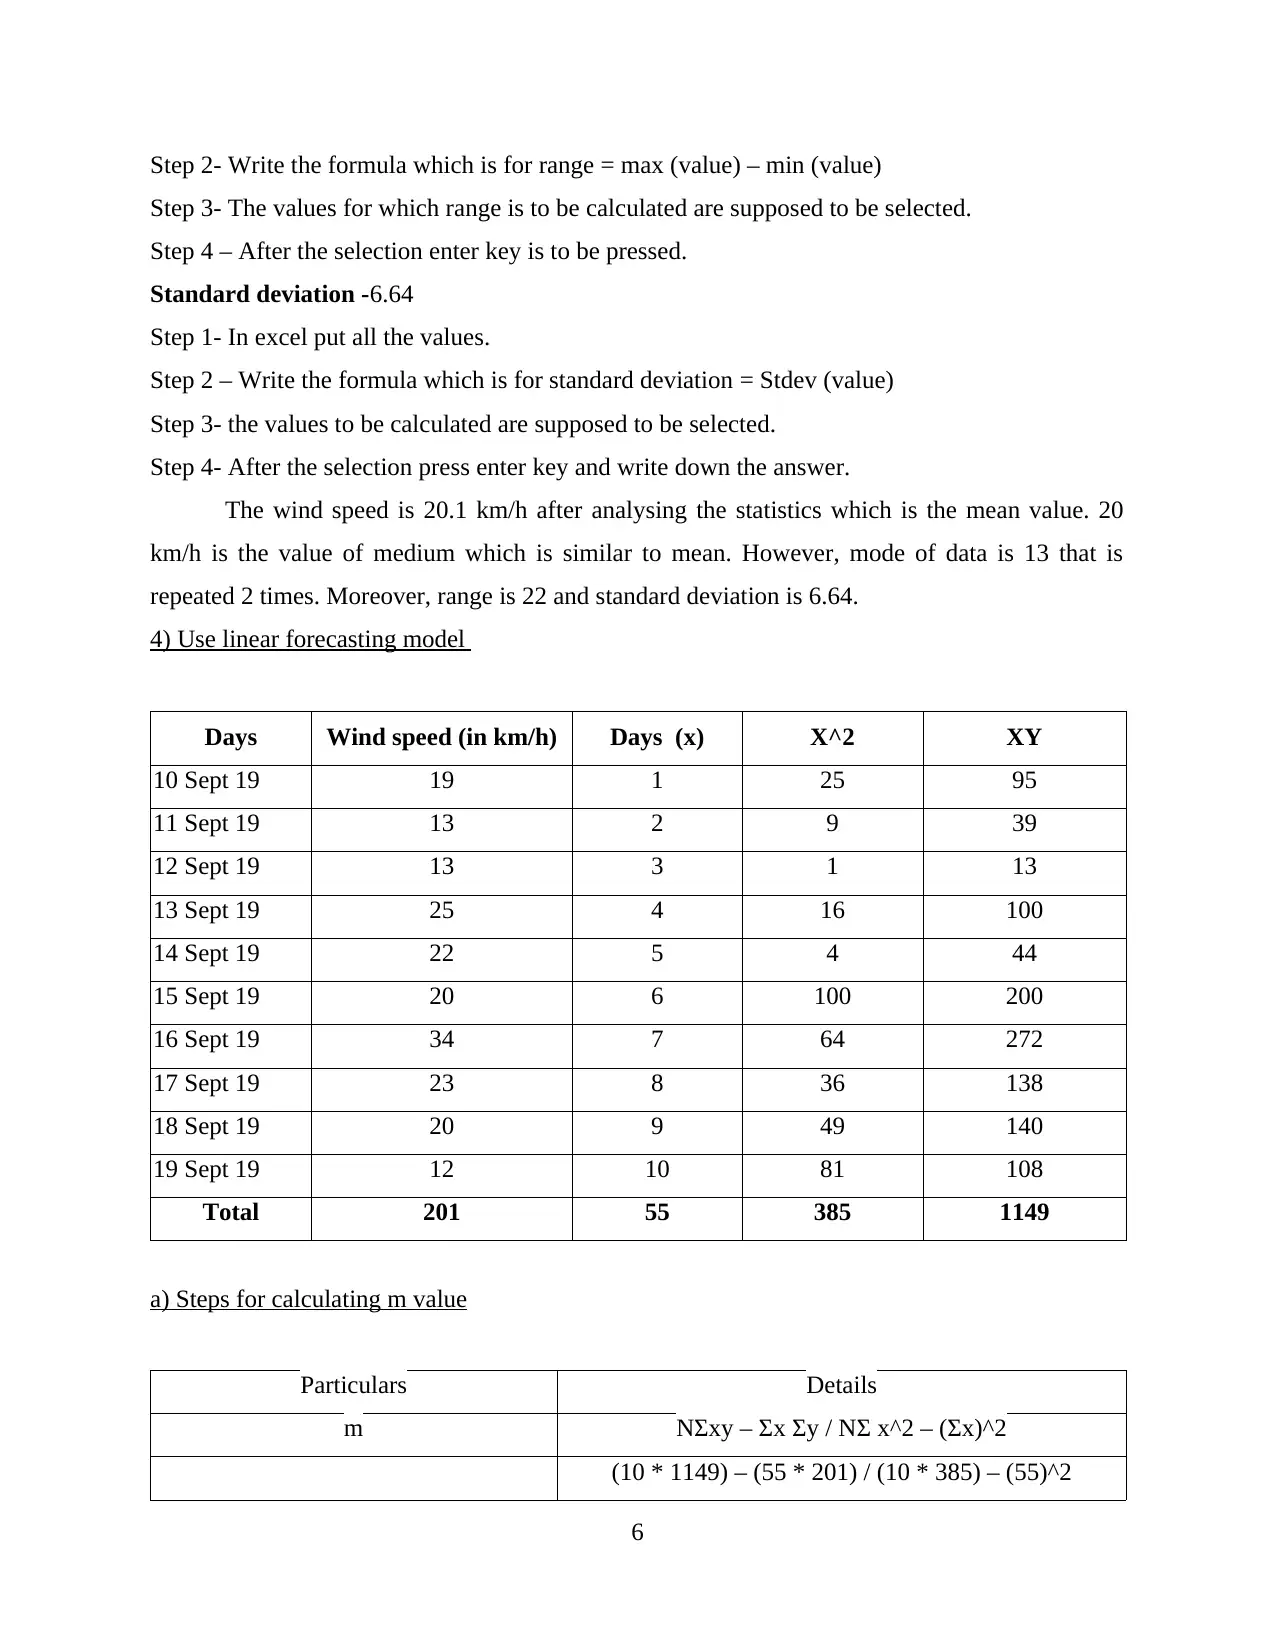
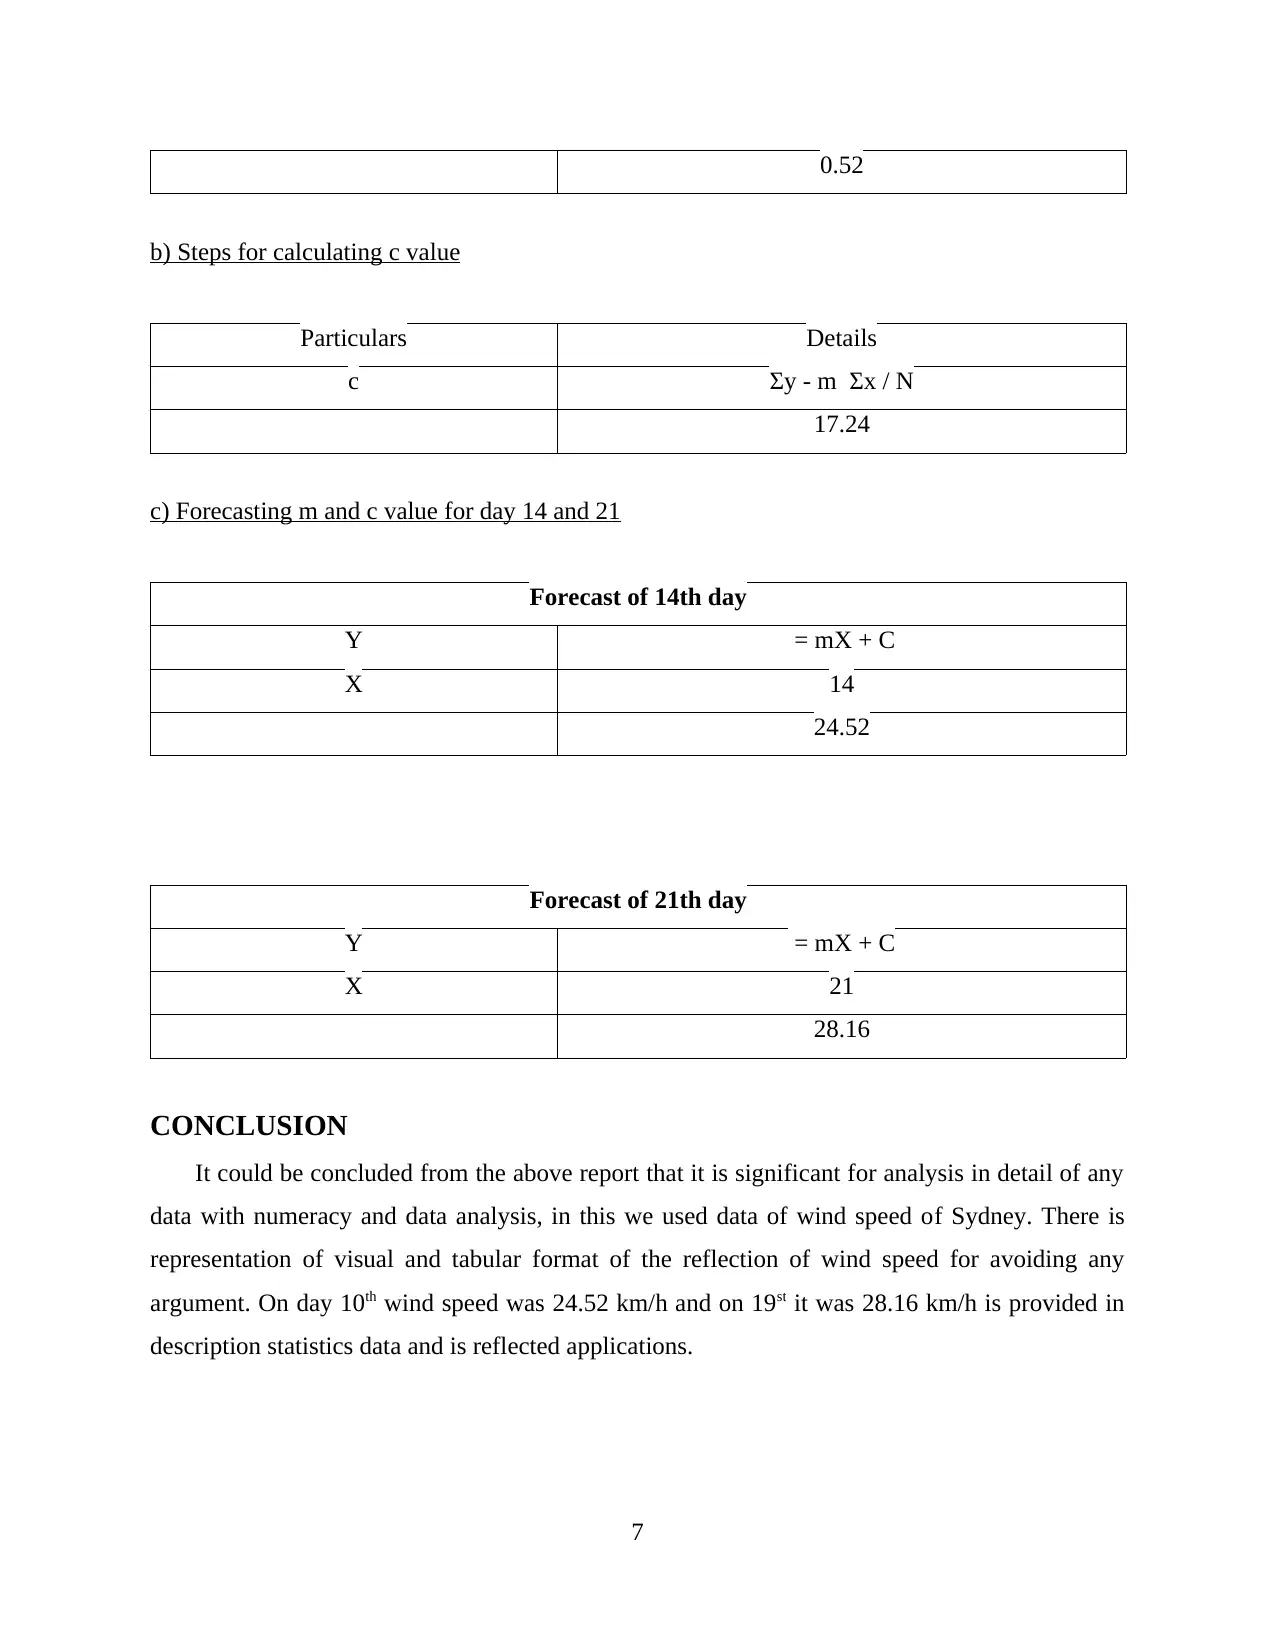
This project provides a comprehensive analysis of wind speed data collected from Sydney over a 10-day period. The assignment begins with presenting the data in a tabular format and visualizing it using pie and bar charts. Descriptive statistics, including mean, median, mode, range, and standard deviation, are calculated to summarize the data. The core of the project involves applying a linear forecasting model (Y = mX + c) to predict wind speeds. Detailed steps for calculating the 'm' and 'c' values are provided, followed by forecasts for wind speed on the 14th and 21st days. The project demonstrates practical application of data analysis techniques. The project uses Excel to calculate the values and to create the charts.

PROJECT ON DATA
ANALYSIS AND
FORECASTING
1
ANALYSIS AND
FORECASTING
1
Paraphrase This Document
Need a fresh take? Get an instant paraphrase of this document with our AI Paraphraser

Table of Contents
INTRODUCTION ..........................................................................................................................3
1) Data in table format.................................................................................................................3
2) Chart types ..............................................................................................................................3
3) Calculate the values.................................................................................................................4
4) Use linear forecasting model ..................................................................................................5
a) Steps for calculating m value...................................................................................................5
b) Steps for calculating c value....................................................................................................5
c) Forecasting m and c value for day 14 and 21..........................................................................6
CONCLUSION ...............................................................................................................................6
REFERENCES................................................................................................................................7
2

INTRODUCTION
The most important capability for understanding numerical analysis in this generation is to
have the knowledge of data and numeracy. From an authentic online source, a brief analysis of
wind speed of 10 days has been gathered of the city Sydney. The reflection of the visual data will
be represented in pie chart and the data will be in a tabular format. The help of mean, medium,
mode, range and standard deviation a descriptive of speed of wind data is produced. It will
represent about linear forecasting model of day 10 and 19 with Y = mX + c with calculation m, c
.
1) Data in table format
The wind speed of Sydney of 10 days have been shown in the following table-
Date Wind Speed
10 Sept 19 16km/h
11 Sept 19 11km/h
12 Sept 19 21km/h
13 Sept 19 29km/h
14 Sept 19 30km/h
15 Sept 19 38km/h
16 Sept 19 13km/h
17 Sept 19 20km/h
18 Sept 19 22km/h
19 Sept 19 26km/h
3
⊘ This is a preview!⊘
Do you want full access?
Subscribe today to unlock all pages.

Trusted by 1+ million students worldwide

2) Chart types
Pie chart
Bar chart
4
10
11
12
13
14
15 16
17
18
19
1
2
3
4
5
6
7
8
9
10
Pie chart
Bar chart
4
10
11
12
13
14
15 16
17
18
19
1
2
3
4
5
6
7
8
9
10
Paraphrase This Document
Need a fresh take? Get an instant paraphrase of this document with our AI Paraphraser

1 2 3 4 5 6 7 8 9 10
0
2
4
6
8
10
12
14
16
18
20
10 11 12 13 14 15 16 17 18 19
Date
Wind Speed
3) Calculate the values
To change the value in excel there are certain steps. The steps are written in detail below-
Mean = 20.1
Step 1- all the values have to be feed in excel and write the formula for mean below that which is
= Average (values)
Step 2- Select the values of which the mean has to be calculated.
Step 3- After the selection enter key is to be pressed.
Median= 20
Step 1- Below the values write the formula of medium that is = median (values)
Step 2- The values for which median is to be calculated are supposed to be selected.
Step 3- After the selection enter key is to be pressed.
Mode = 13
Step 1- Write all the values in excel sheet.
Step 2- Below the values write the formula of mode that is = mode (values)
Step 3- The values for which mode is to be calculated are supposed to be selected.
Step 4- After the selection enter key is to be pressed.
Range = 22
Step 1 – Write all the values in excel sheet.
5

Step 2- Write the formula which is for range = max (value) – min (value)
Step 3- The values for which range is to be calculated are supposed to be selected.
Step 4 – After the selection enter key is to be pressed.
Standard deviation -6.64
Step 1- In excel put all the values.
Step 2 – Write the formula which is for standard deviation = Stdev (value)
Step 3- the values to be calculated are supposed to be selected.
Step 4- After the selection press enter key and write down the answer.
The wind speed is 20.1 km/h after analysing the statistics which is the mean value. 20
km/h is the value of medium which is similar to mean. However, mode of data is 13 that is
repeated 2 times. Moreover, range is 22 and standard deviation is 6.64.
4) Use linear forecasting model
Days Wind speed (in km/h) Days (x) X^2 XY
10 Sept 19 19 1 25 95
11 Sept 19 13 2 9 39
12 Sept 19 13 3 1 13
13 Sept 19 25 4 16 100
14 Sept 19 22 5 4 44
15 Sept 19 20 6 100 200
16 Sept 19 34 7 64 272
17 Sept 19 23 8 36 138
18 Sept 19 20 9 49 140
19 Sept 19 12 10 81 108
Total 201 55 385 1149
a) Steps for calculating m value
Particulars Details
m NΣxy – Σx Σy / NΣ x^2 – (Σx)^2
(10 * 1149) – (55 * 201) / (10 * 385) – (55)^2
6
⊘ This is a preview!⊘
Do you want full access?
Subscribe today to unlock all pages.

Trusted by 1+ million students worldwide

0.52
b) Steps for calculating c value
Particulars Details
c Σy - m Σx / N
17.24
c) Forecasting m and c value for day 14 and 21
Forecast of 14th day
Y = mX + C
X 14
24.52
Forecast of 21th day
Y = mX + C
X 21
28.16
CONCLUSION
It could be concluded from the above report that it is significant for analysis in detail of any
data with numeracy and data analysis, in this we used data of wind speed of Sydney. There is
representation of visual and tabular format of the reflection of wind speed for avoiding any
argument. On day 10th wind speed was 24.52 km/h and on 19st it was 28.16 km/h is provided in
description statistics data and is reflected applications.
7
Paraphrase This Document
Need a fresh take? Get an instant paraphrase of this document with our AI Paraphraser

REFERENCES
Books and journals
8
Books and journals
8
1 out of 8
Related Documents

Your All-in-One AI-Powered Toolkit for Academic Success.
+13062052269
info@desklib.com
Available 24*7 on WhatsApp / Email
Unlock your academic potential
Copyright © 2020–2025 A2Z Services. All Rights Reserved. Developed and managed by ZUCOL.