Sygenta: Evaluating Performance in Japan & US Market Expansion Plan

Verified

Added on  2023/04/22

|12
|760
|286
Report
AI Summary
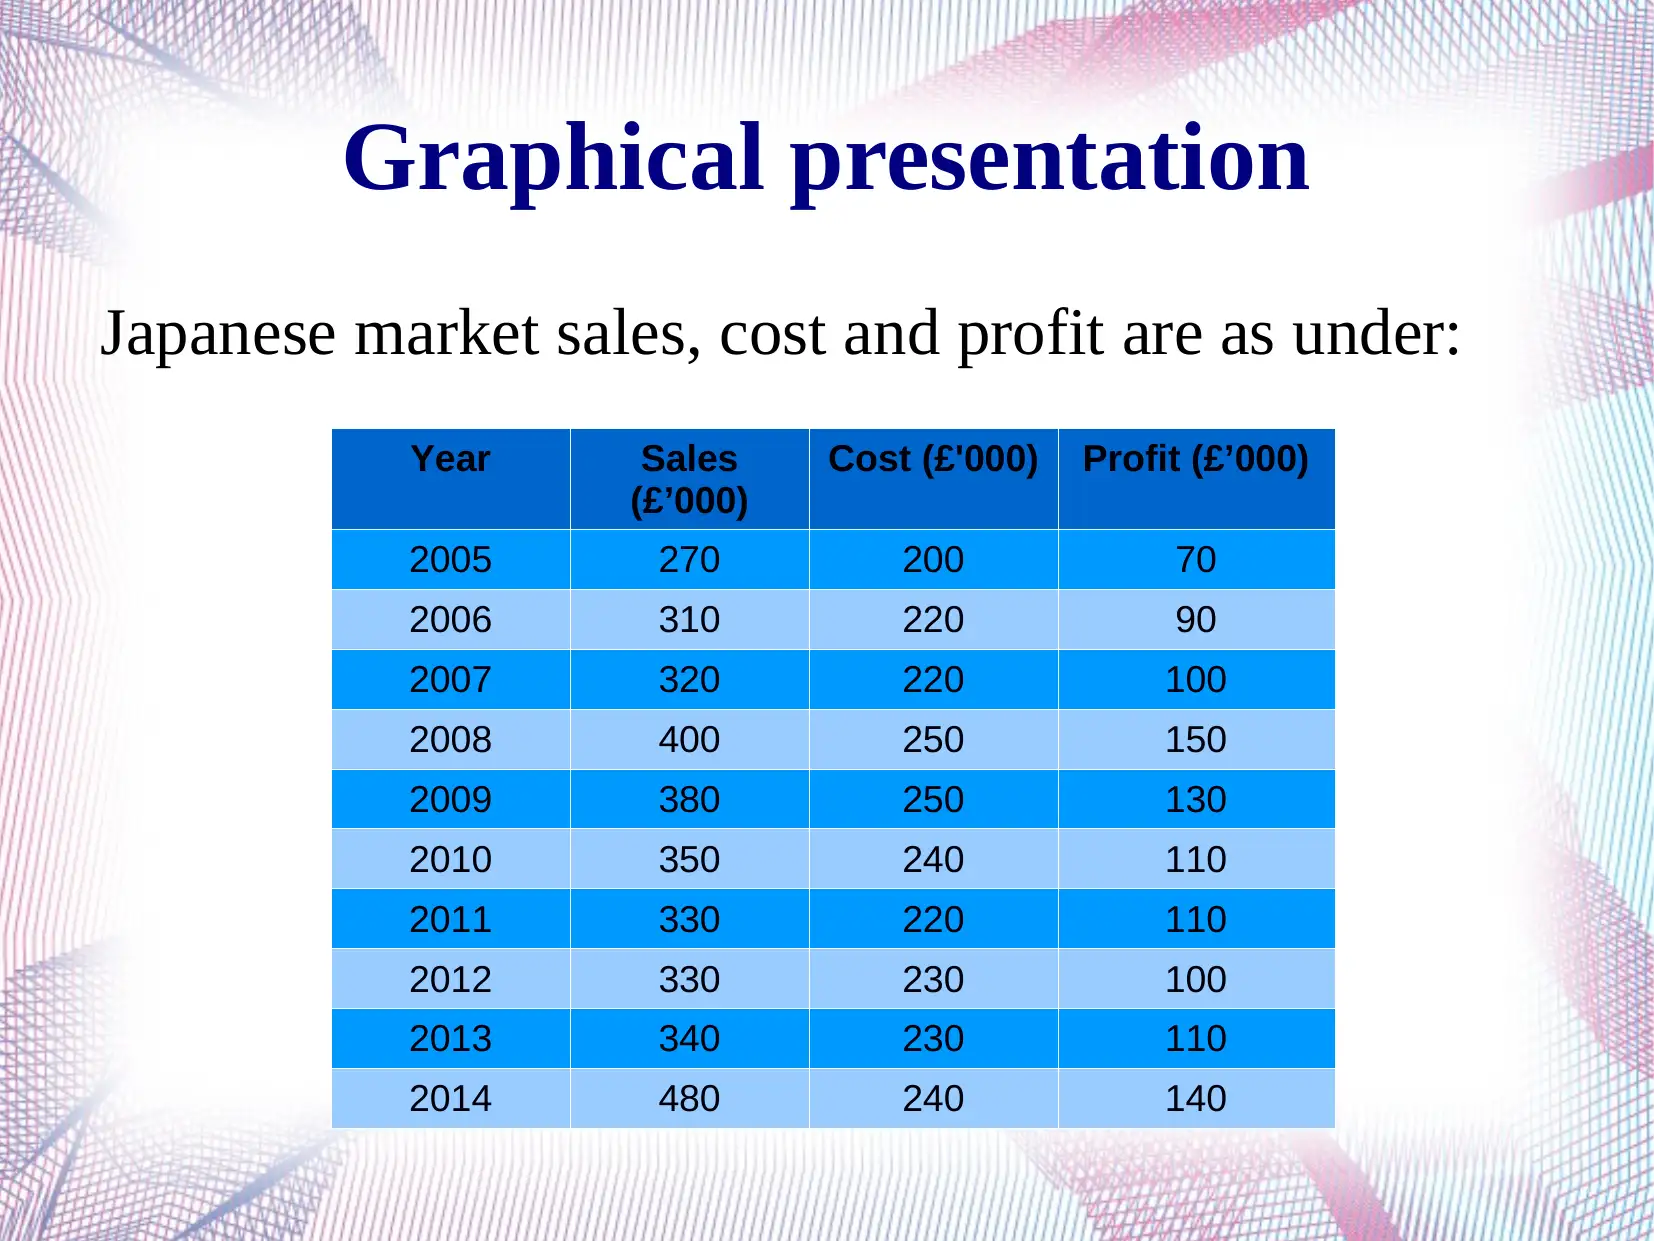
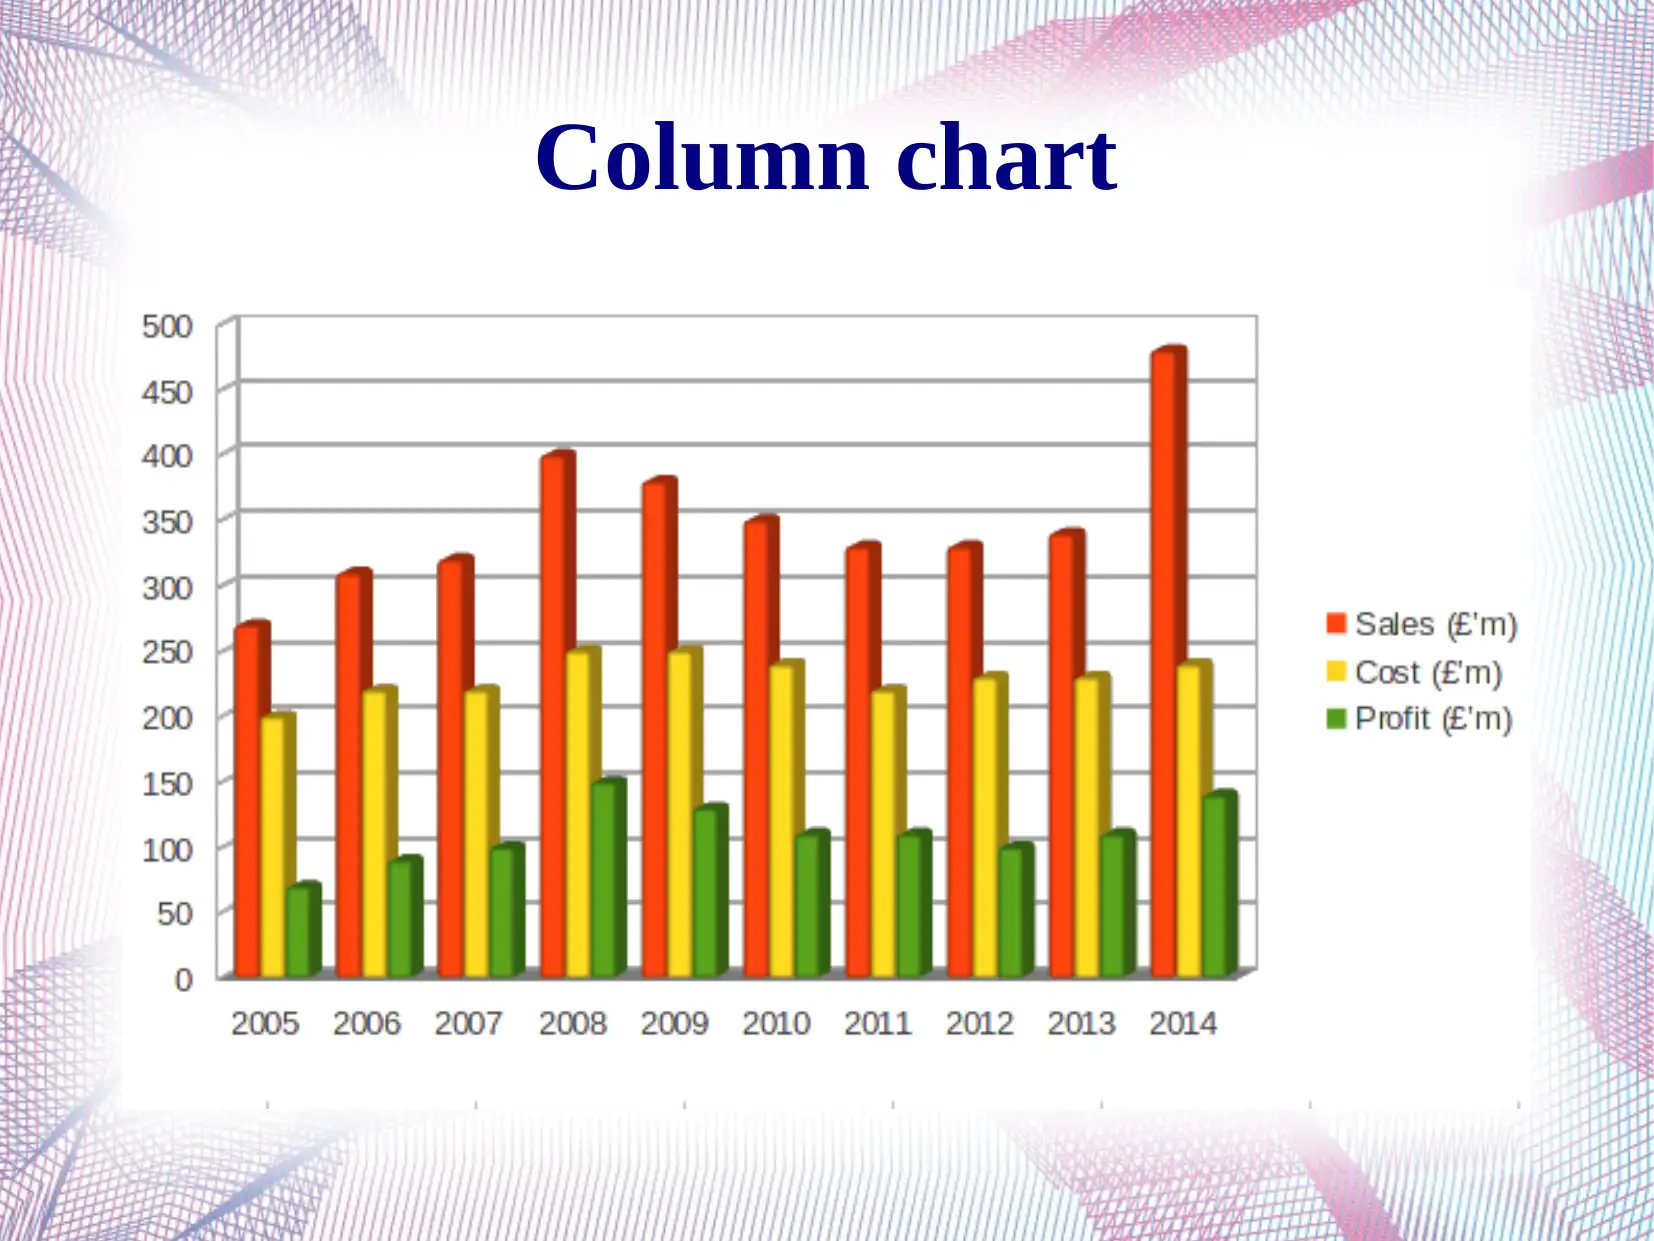
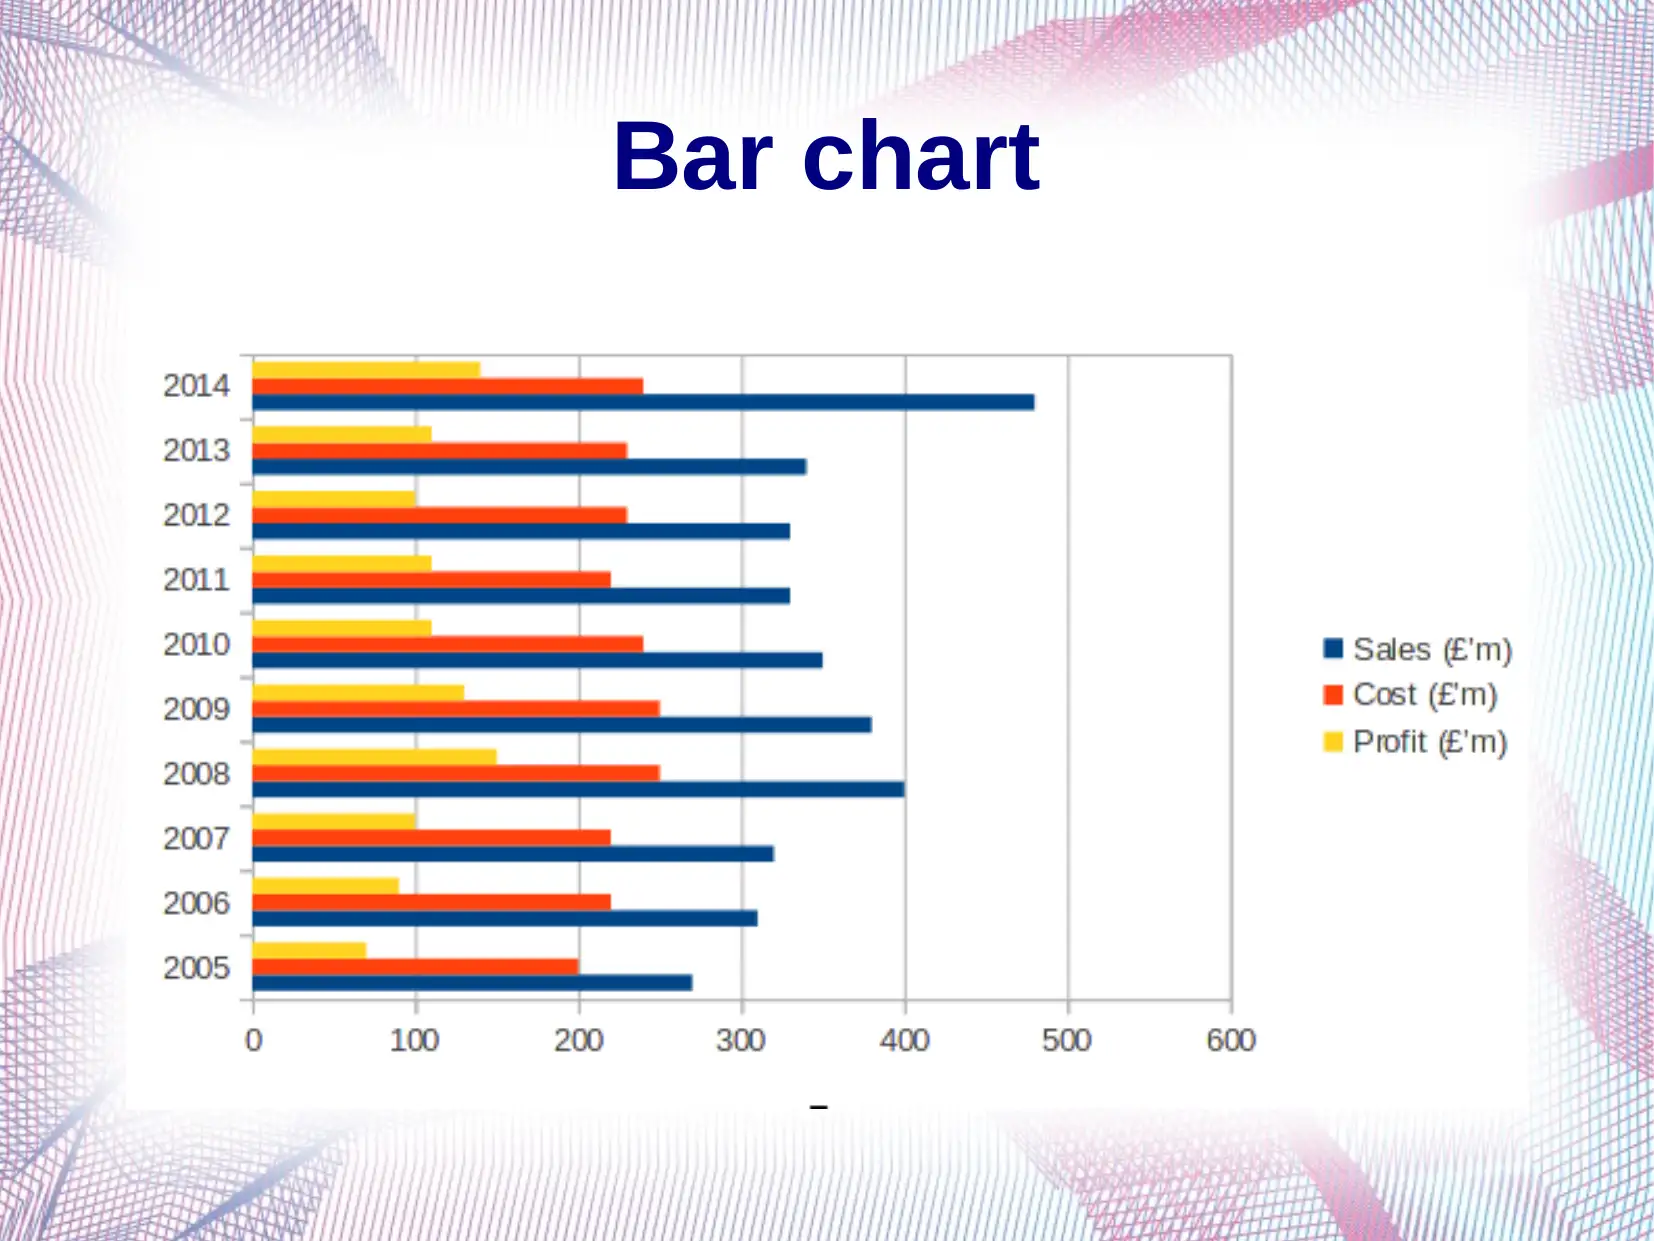
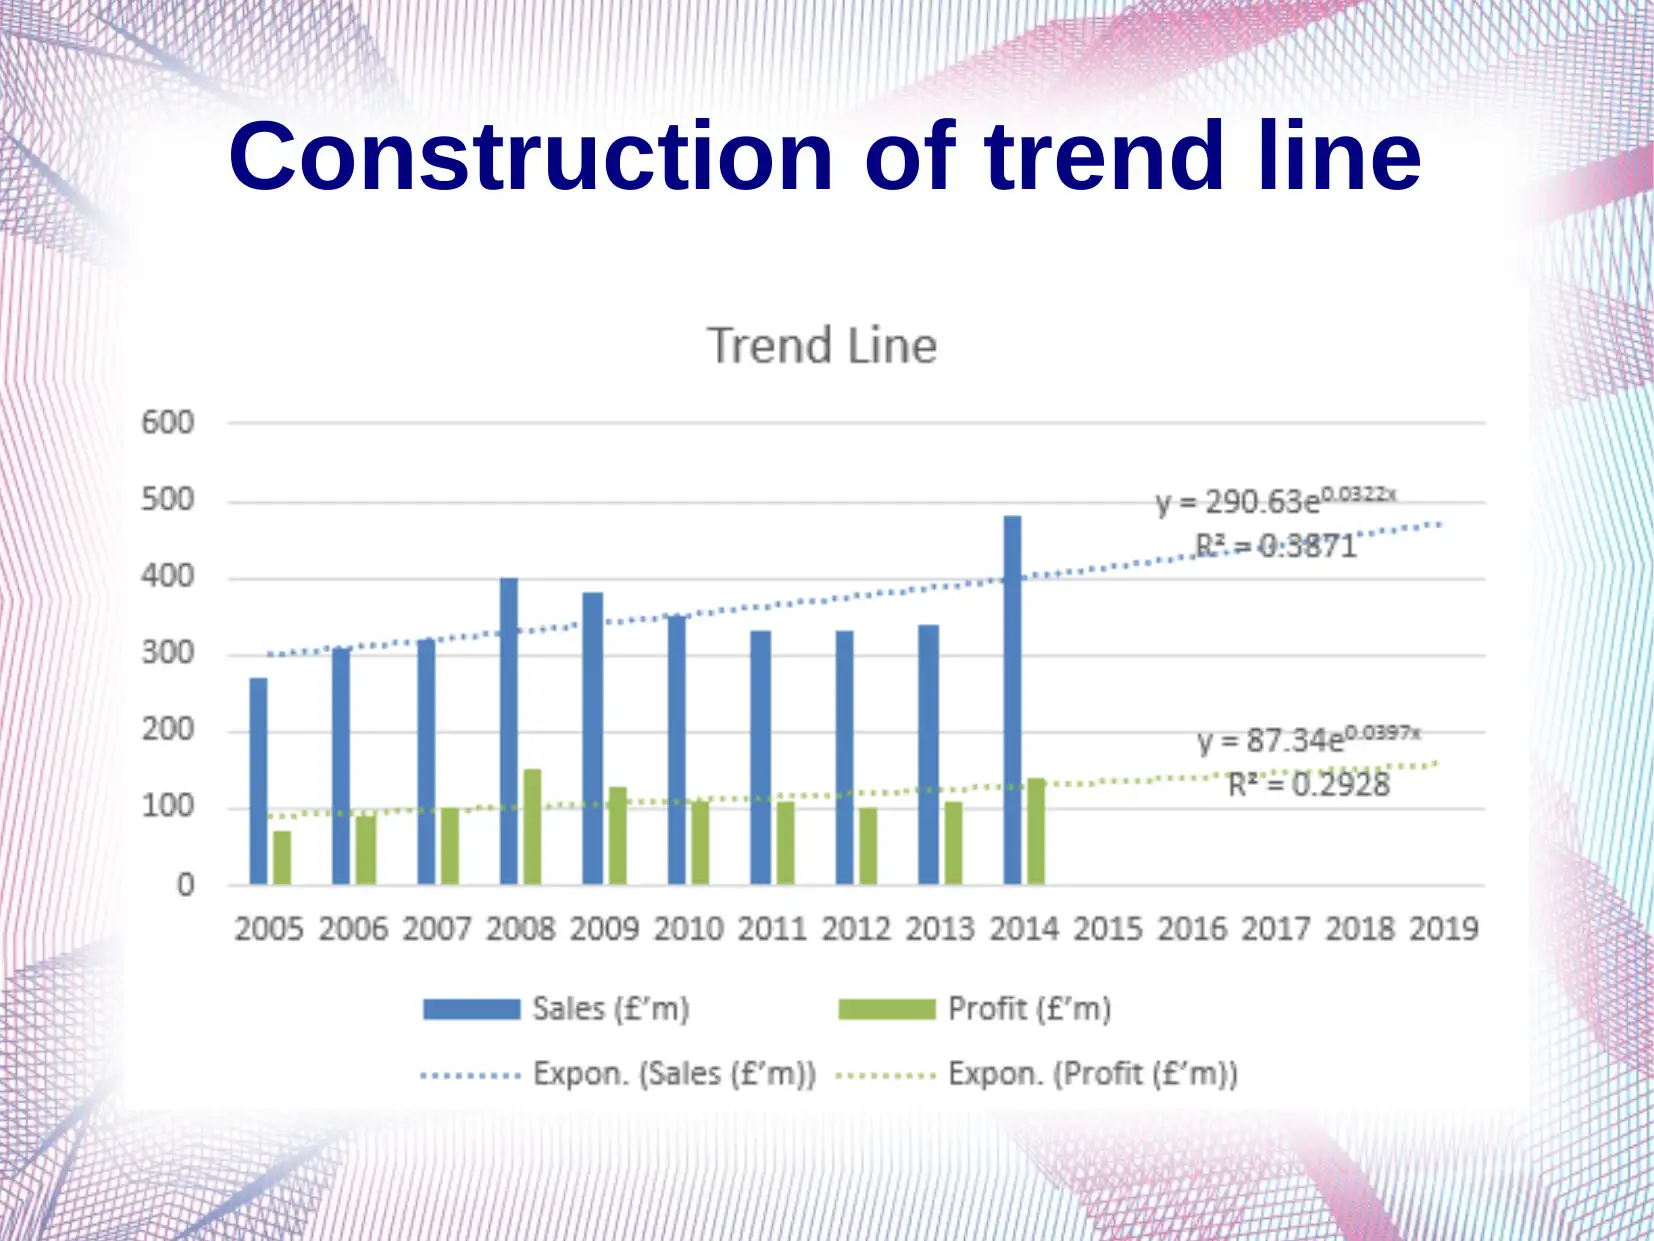
This report assesses Sygenta's performance in the Japanese market, analyzing sales, costs, and profitability from 2005 to 2014. It utilizes column charts, bar charts, and trend lines to interpret market trends and identify opportunities for improvement. The analysis reveals fluctuating sales and profitability, highlighting the need for strategic decisions to stabilize performance. The report suggests launching the Amistar fungicide in the US market to enhance revenues and profitability, ultimately improving Sygenta's overall market performance and achieving long-term business success. The study also references relevant research on trend analysis and market research methodologies.
Document Page
TASK 3
Business decisions making
tabler-icon-diamond-filled.svg

Paraphrase This Document

Need a fresh take? Get an instant paraphrase of this document with our AI Paraphraser
Document Page
Introduction
Sygenta is the world's leading organization with having more
than 28000 employees and it operates in 90 countries. It has
been established with the purpose of bringing plant potential to
life. In the present market, company intend to launch a broad
spectrum fungicide named Amistar for its Integrated Pest
Management. The presentation depicts about measuring the
performance of Sygenta in Japanese market. Moreover, it help
to assess the growth opportunities in US market for launcing
Amistar.
Document Page
Graphical presentation
Japanese market sales, cost and profit are as under:
Year Sales
(£’000)
Cost (£'000) Profit (£’000)
2005 270 200 70
2006 310 220 90
2007 320 220 100
2008 400 250 150
2009 380 250 130
2010 350 240 110
2011 330 220 110
2012 330 230 100
2013 340 230 110
2014 480 240 140
Document Page
Column chart
tabler-icon-diamond-filled.svg

Paraphrase This Document

Need a fresh take? Get an instant paraphrase of this document with our AI Paraphraser
Document Page
Bar chart
Document Page
Interpretation
Presented column and bar chart indicated that sales figures
shows an fluctuating trend. It got improved from 270£m to
400£m in 2008 thereafter, it got declined to 340£m in 2014.
However, 2014 posses highest sales of 480£m. The reason
behind changing sales is incline or decline in cost figures. Due
to this impact, profitability also changed accordingly. It got
increased to 150£m there after, it got fall. On contrary, in 2014,
profits got enhanced due to larger sales. Thus, it can be said
that Sygenta improved its performance in 2014 in Japanese
market as compared to PY.
Document Page
Trend line
It is a line that can be used to measure historical changes
in sales and profits figures in Japanese market. Through
constructing trend line, Sygenta line manager will be
able to determine previous movement. Moreover, it
helps to predict future sales and profitability analysis on
the basis of historical occurences. Thus, it assist
Sygneta's manager to construct necessary policies to
improve its potential sales and profitability. This in turn,
company will be able to improve its potential
performance for the future period. As per the given
scenario, trend line have been constructed here:
tabler-icon-diamond-filled.svg

Paraphrase This Document

Need a fresh take? Get an instant paraphrase of this document with our AI Paraphraser
Document Page
Construction of trend line
Document Page
Interpretation
As per the constructed trend line, it became clear that trend line for sales
shows an fluctuating trend. Although, in 2014, it is higher compare to all
the other years. Thus, it indicate that there is a great chance of improving
Sygenta's sales for the future period in Japanese market. Along with this,
its cost also tend to fluctuate as it got increased till the year 2009 there
after, fall in cost has been noticed. Again in 2014, it shows a little
increases as it went up to 240£m. However, on the basis of trend line, it
can be concluded that in upcoming period, its cost will go towards in
upwards direction. In order to remove this fluctuating trend, Sygenta
company manager need to take necessary decisions and construct policies
to bringing stability in sales. It can be done through introducing its new
product Amistar in US market. By launching this product, Sygenta
company's sales will be significantly increase contributes to provide high
profitability to the business.
Document Page
Conclusion
On the basis of above analysis, it can be concluded
that Sygenta company has to launch its new product
in US market. It will add more revenues and
profitability to the company. This in turn, Sygenta
will be able to improve its market performance and
achieve long term business success.
tabler-icon-diamond-filled.svg

Paraphrase This Document

Need a fresh take? Get an instant paraphrase of this document with our AI Paraphraser
Document Page
References
Jackson, A.C. and et.al., 2014. Improving gambling survey research
using dual-frame sampling of landline and mobile phone
numbers. Journal of gambling studies. 30(2). pp. 291-307.
Li, H., Critchley, L.A. and Zhang, J., 2015. Does using two Doppler
cardiac output monitors in tandem provide a reliable trend line of
changes for validation studies?. Journal of clinical monitoring
and computing. pp. 1-9.
Li, J., Lee, H., Yang, K.Y. and Vahala, K.J., 2012. Sideband
spectroscopy and dispersion measurement in microcavities.
Optics express. 20(24). pp. 26337-26344.
Document Page
Thank You!
chevron_up_icon
1 out of 12
circle_padding
hide_on_mobile
zoom_out_icon
[object Object]