Business Decision Making Report: Sygenta Amistar Launch in US Market
VerifiedAdded on 2020/01/23
|20
|5243
|143
Report
AI Summary
This report delves into Sygenta's business decision-making process, focusing on the potential launch of its fungicide product, Amistar, in the US market. It begins with an introduction to decision-making and its importance for organizational success, followed by an overview of Sygenta's operations. The report then details the collection of primary and secondary data, including survey methodology and sampling frames. It explores statistical tools such as mean, mode, median, skewness, range, standard deviation, quartile, percentile, and correlation. The report also covers graphical presentations of sales, cost, and profit, along with trend line analysis and the application of capital budgeting tools like the internal rate of return (IRR), Gantt charts, and network diagrams for project management. Finally, the report concludes with an evaluation of the time series for forecasting and the uses of investment appraisal techniques to make strategic investment decisions.

BUSINESS DECISION MAKING
Paraphrase This Document
Need a fresh take? Get an instant paraphrase of this document with our AI Paraphraser
Table of Contents
INTRODUCTION......................................................................................................................1
TASK 1......................................................................................................................................1
Q. 1. Collection of primary and secondary data, survey methodology and sampling frame
...........................................................................................................................................1
Q. 2. Designing a market survey questionnaire................................................................2
TASK 2......................................................................................................................................3
Q. 1. Mean, Mode and Median.........................................................................................3
M1..............................................................................................................................................4
Calculation and uses of skewness to improve organization performance........................4
TASK 2......................................................................................................................................5
Q. 1. Mean, Mode and Median.........................................................................................5
Q . 2. Range and standard deviation.................................................................................6
Q. 3 Quartile, percentile and correlation...........................................................................6
TASK 3......................................................................................................................................7
Q. 1. Graphical presentation of sales, cost and profit.......................................................7
Q. 2 . Trend line of sales and profits.................................................................................9
Q.3. Presentation.............................................................................................................10
D1.............................................................................................................................................10
Evaluation of time series for forecasting........................................................................10
TASK 4....................................................................................................................................10
Q. 1. Preparation of Gantt chart and its benefits in project management.......................10
Q. 2. Preparation of network diagram for the activities..................................................12
TASK 4....................................................................................................................................13
Q. 3. Uses of Investment appraisal techniques...............................................................13
D3 ............................................................................................................................................15
(1) Internal rate of return (IRR)......................................................................................15
(2) Critical evaluation.....................................................................................................15
CONCLUSION........................................................................................................................16
REFERENCES.........................................................................................................................17
INTRODUCTION
Decision making is the process of collecting necessary information, data storage and
analysing data by applying different statistical methods to take effective decisions (Ferrell
and Fraedrich, 2016). It plays a crucial role in the organization success by achieving set
business targets and objectives. Sygenta is the world's leading organization with having more
than 28000 employees and it operates in 90 countries. It has been established with the
purpose of bringing plant potential to life. In the present market, company intend to launch a
broad spectrum fungicide named Amistar for its Integrated Pest Management.
Present project report will explain the information collection process through various
primary and secondary data collection techniques. Moreover, various statistical analytical
tools will be applied to the data analysis. It includes central tendency measurement such as
mean, mode and median while dispersion measurement includes range, quartile, standard
deviation and others. Along with it, data will be presented in a graphical manner for
analytical purpose. Furthermore, capital budgeting tools will be used to take strategic
investment decisions.
TASK 1
Q. 1. Collection of primary and secondary data, survey methodology and sampling frame
Market selection: Sygenta intending to launch its fungicide product called Amistar
for pest management. US country has been selected for this purpose. The reason behind this
is agricultural production in US is very high. It exports variety of food products in various
countries. It exports products like Soybeans, Cotton, Grapes, Rice, Oranges, Apples,
Sorghum, Wheat, Corn and others. Thus, the demand for pesticides and fungicide products
will be very high to protect agricultural production. Moreover, it is a developed country
henceforth; it provides great opportunities to Sygenta for achieving growth. Therefore,
through launching Amistar in US, Sygenta will be able to generate huge revenue and
profitability. It can improve its performance and can get a good corporate position by serving
better quality of fungicide products, Amistar. It can achieve long term success and
accomplish its target of bringing plant potential to life.
Data collection: At the initial stage, Sygenta Company has to gather required
information about the market. Both the primary and secondary information can be collected
by the researcher for this purpose. Primary data refers to the information which is collected
by Sygenta for the first time while secondary information is already available in the market.
Primary data can be collected by survey methodology, questionnaire and conducting
1 | P a g e
⊘ This is a preview!⊘
Do you want full access?
Subscribe today to unlock all pages.
Trusted by 1+ million students worldwide
interviews. It provides assistance to Sygenta for collecting large quantity of data and
appropriate for gathering specific information about Amistar. On contrary, secondary data
can be gathered through historical industrial sales records, their published annual reports, US
government economic reports, trade reports, internet, published scholarly articles, books,
newspaper, magazines and reports published by trade associations. It takes less time and
effort in data collection process.
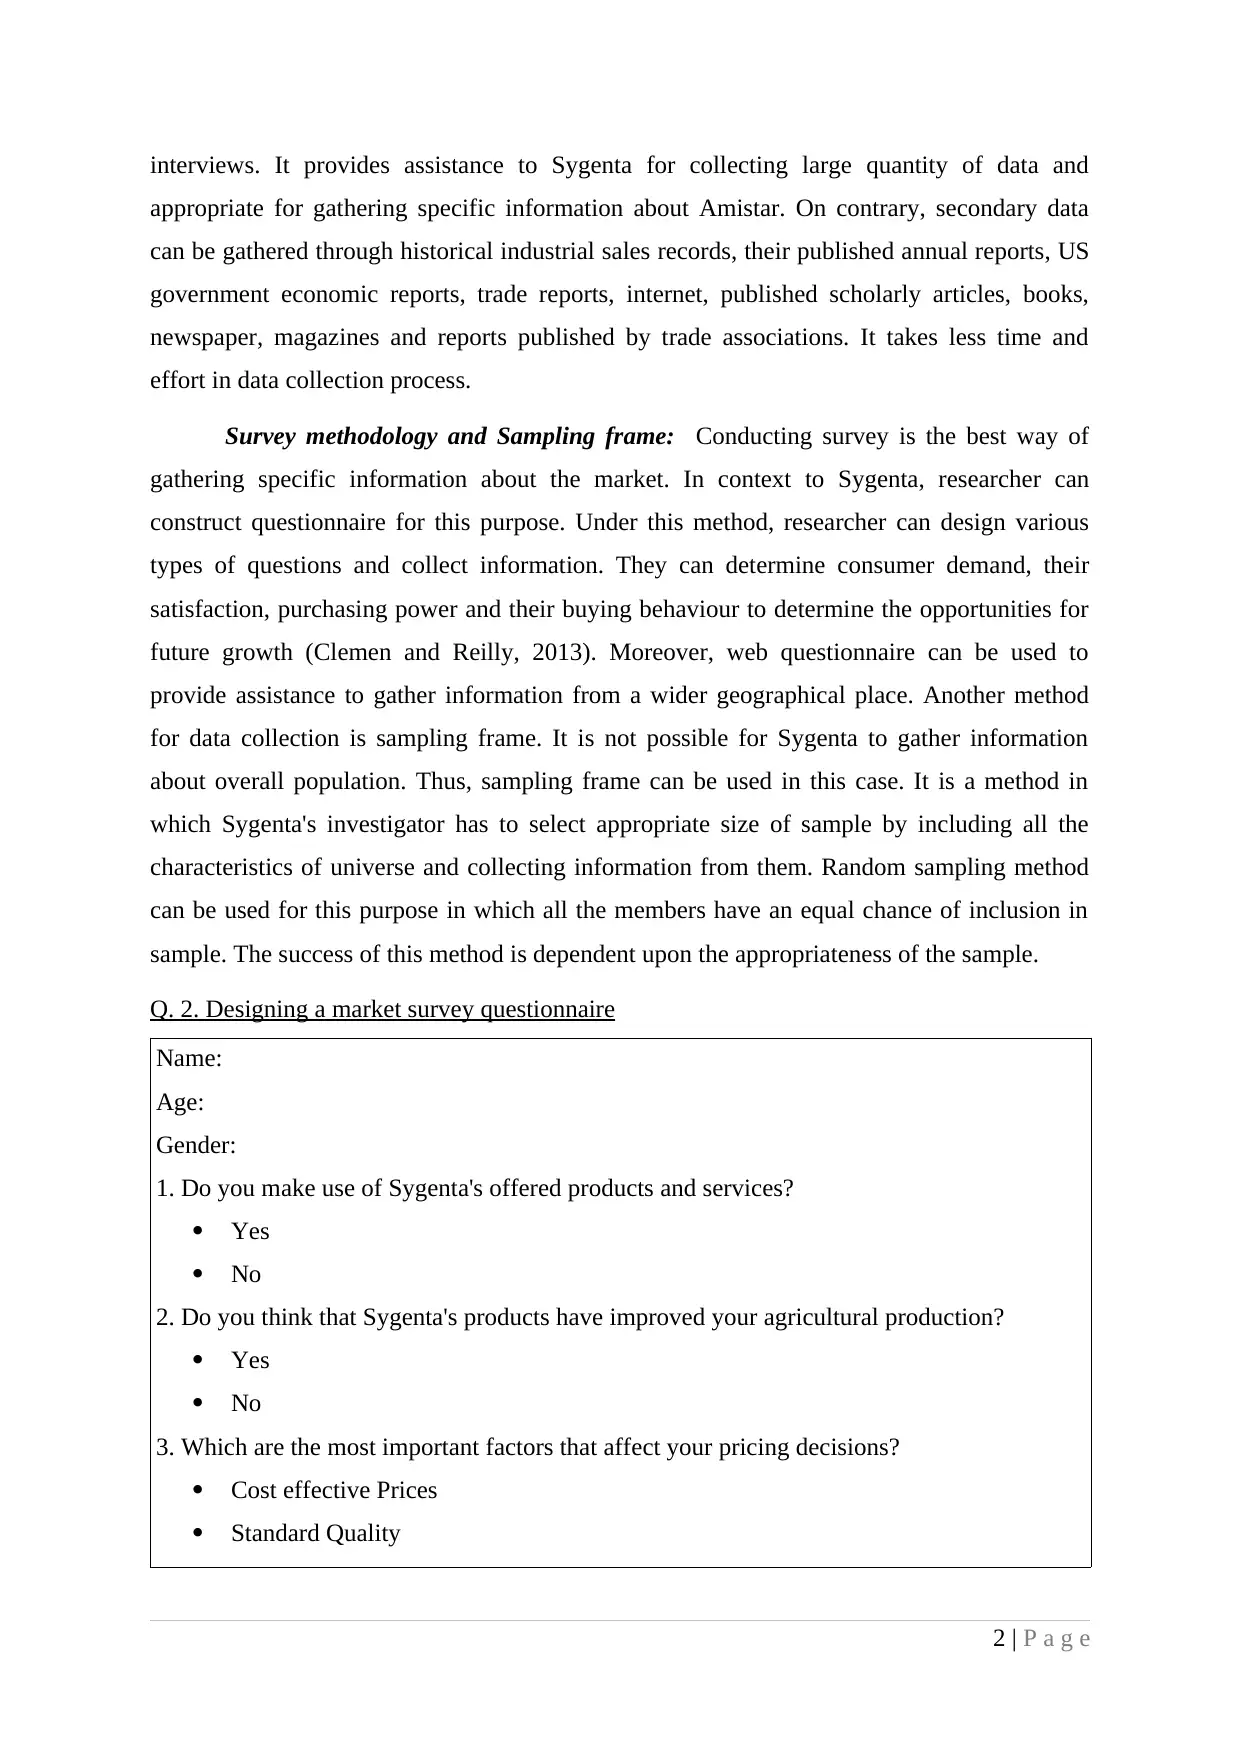
Survey methodology and Sampling frame: Conducting survey is the best way of
gathering specific information about the market. In context to Sygenta, researcher can
construct questionnaire for this purpose. Under this method, researcher can design various
types of questions and collect information. They can determine consumer demand, their
satisfaction, purchasing power and their buying behaviour to determine the opportunities for
future growth (Clemen and Reilly, 2013). Moreover, web questionnaire can be used to
provide assistance to gather information from a wider geographical place. Another method
for data collection is sampling frame. It is not possible for Sygenta to gather information
about overall population. Thus, sampling frame can be used in this case. It is a method in
which Sygenta's investigator has to select appropriate size of sample by including all the
characteristics of universe and collecting information from them. Random sampling method
can be used for this purpose in which all the members have an equal chance of inclusion in
sample. The success of this method is dependent upon the appropriateness of the sample.
Q. 2. Designing a market survey questionnaire
Name:
Age:
Gender:
1. Do you make use of Sygenta's offered products and services?
Yes
No
2. Do you think that Sygenta's products have improved your agricultural production?
Yes
No
3. Which are the most important factors that affect your pricing decisions?
Cost effective Prices
Standard Quality
2 | P a g e
appropriate for gathering specific information about Amistar. On contrary, secondary data
can be gathered through historical industrial sales records, their published annual reports, US
government economic reports, trade reports, internet, published scholarly articles, books,
newspaper, magazines and reports published by trade associations. It takes less time and
effort in data collection process.
Survey methodology and Sampling frame: Conducting survey is the best way of
gathering specific information about the market. In context to Sygenta, researcher can
construct questionnaire for this purpose. Under this method, researcher can design various
types of questions and collect information. They can determine consumer demand, their
satisfaction, purchasing power and their buying behaviour to determine the opportunities for
future growth (Clemen and Reilly, 2013). Moreover, web questionnaire can be used to
provide assistance to gather information from a wider geographical place. Another method
for data collection is sampling frame. It is not possible for Sygenta to gather information
about overall population. Thus, sampling frame can be used in this case. It is a method in
which Sygenta's investigator has to select appropriate size of sample by including all the
characteristics of universe and collecting information from them. Random sampling method
can be used for this purpose in which all the members have an equal chance of inclusion in
sample. The success of this method is dependent upon the appropriateness of the sample.
Q. 2. Designing a market survey questionnaire
Name:
Age:
Gender:
1. Do you make use of Sygenta's offered products and services?
Yes
No
2. Do you think that Sygenta's products have improved your agricultural production?
Yes
No
3. Which are the most important factors that affect your pricing decisions?
Cost effective Prices
Standard Quality
2 | P a g e
Paraphrase This Document
Need a fresh take? Get an instant paraphrase of this document with our AI Paraphraser
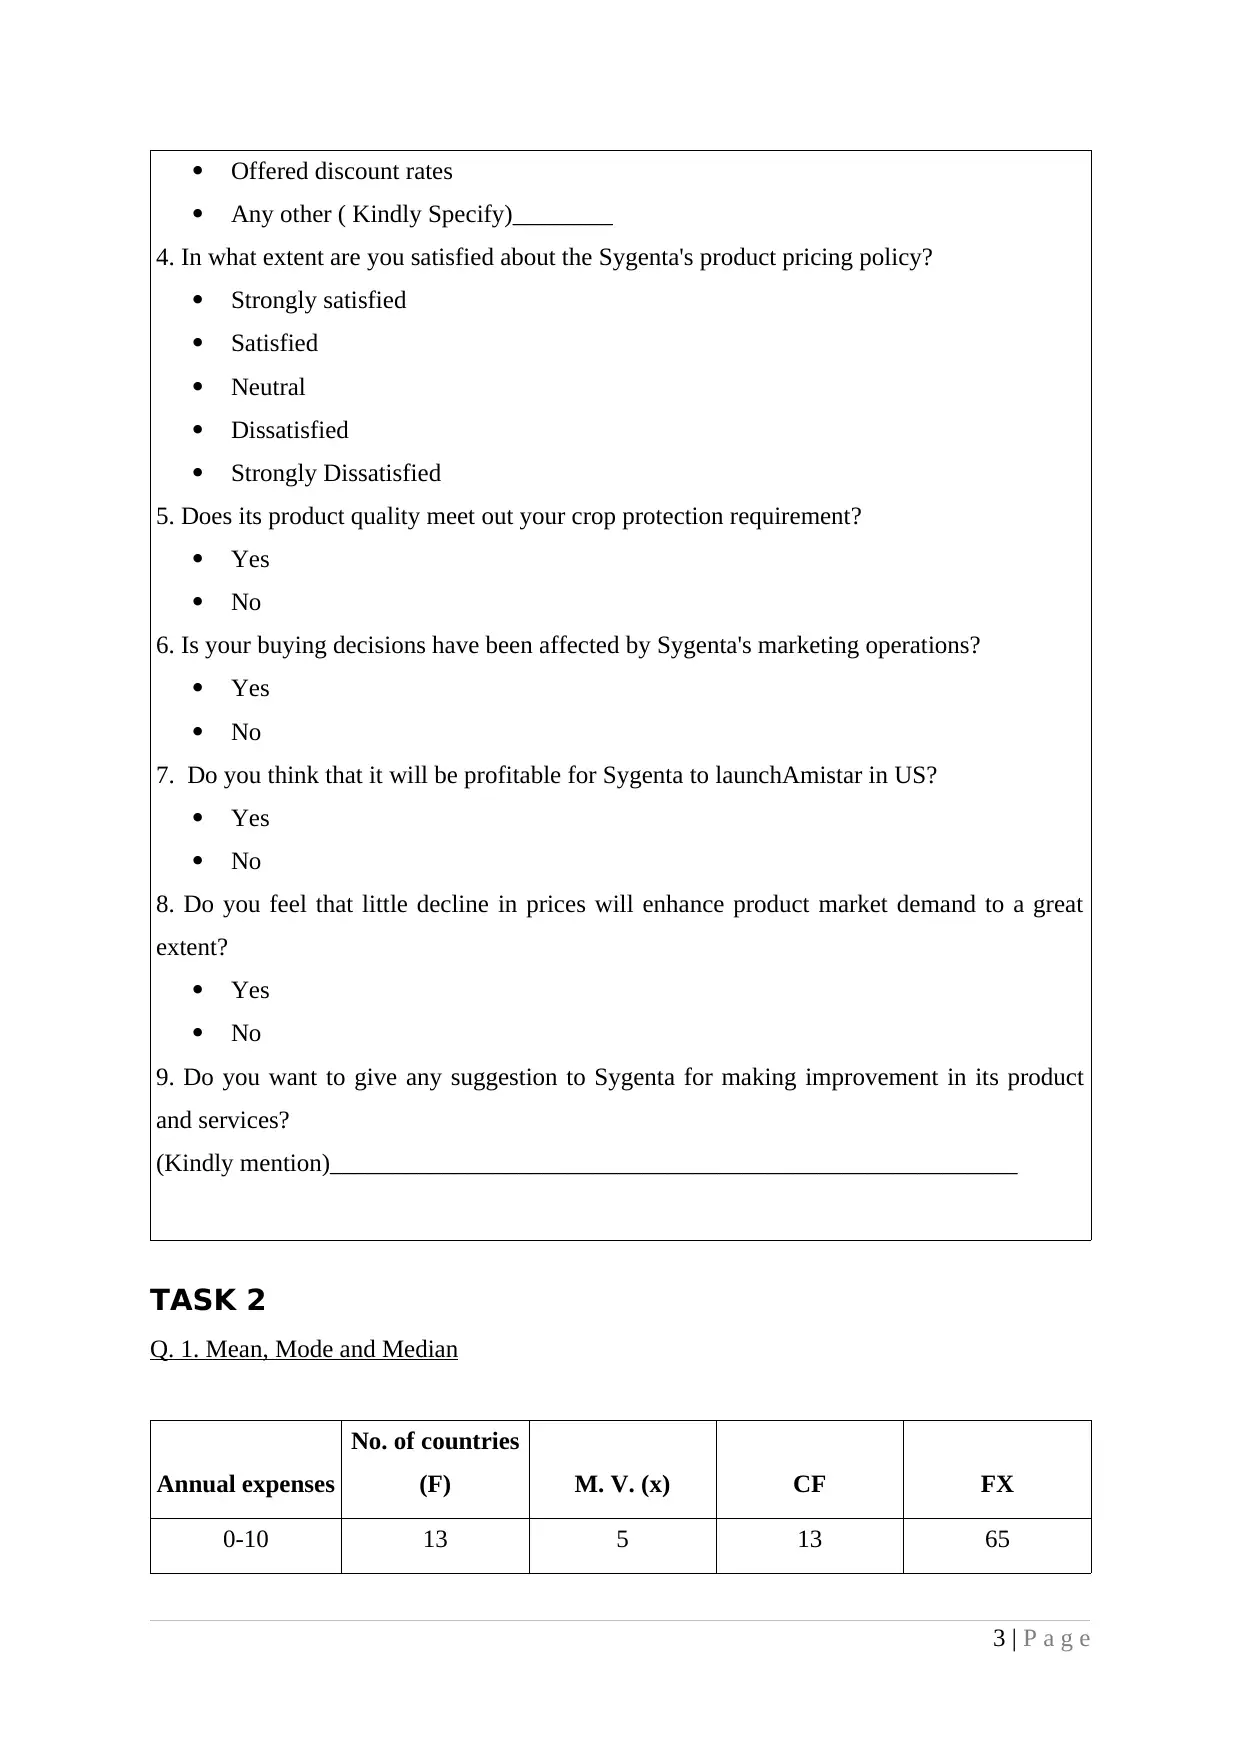
Offered discount rates
Any other ( Kindly Specify)________
4. In what extent are you satisfied about the Sygenta's product pricing policy?
Strongly satisfied
Satisfied
Neutral
Dissatisfied
Strongly Dissatisfied
5. Does its product quality meet out your crop protection requirement?
Yes
No
6. Is your buying decisions have been affected by Sygenta's marketing operations?
Yes
No
7. Do you think that it will be profitable for Sygenta to launchAmistar in US?
Yes
No
8. Do you feel that little decline in prices will enhance product market demand to a great
extent?
Yes
No
9. Do you want to give any suggestion to Sygenta for making improvement in its product
and services?
(Kindly mention)_______________________________________________________
TASK 2
Q. 1. Mean, Mode and Median
Annual expenses
No. of countries
(F) M. V. (x) CF FX
0-10 13 5 13 65
3 | P a g e
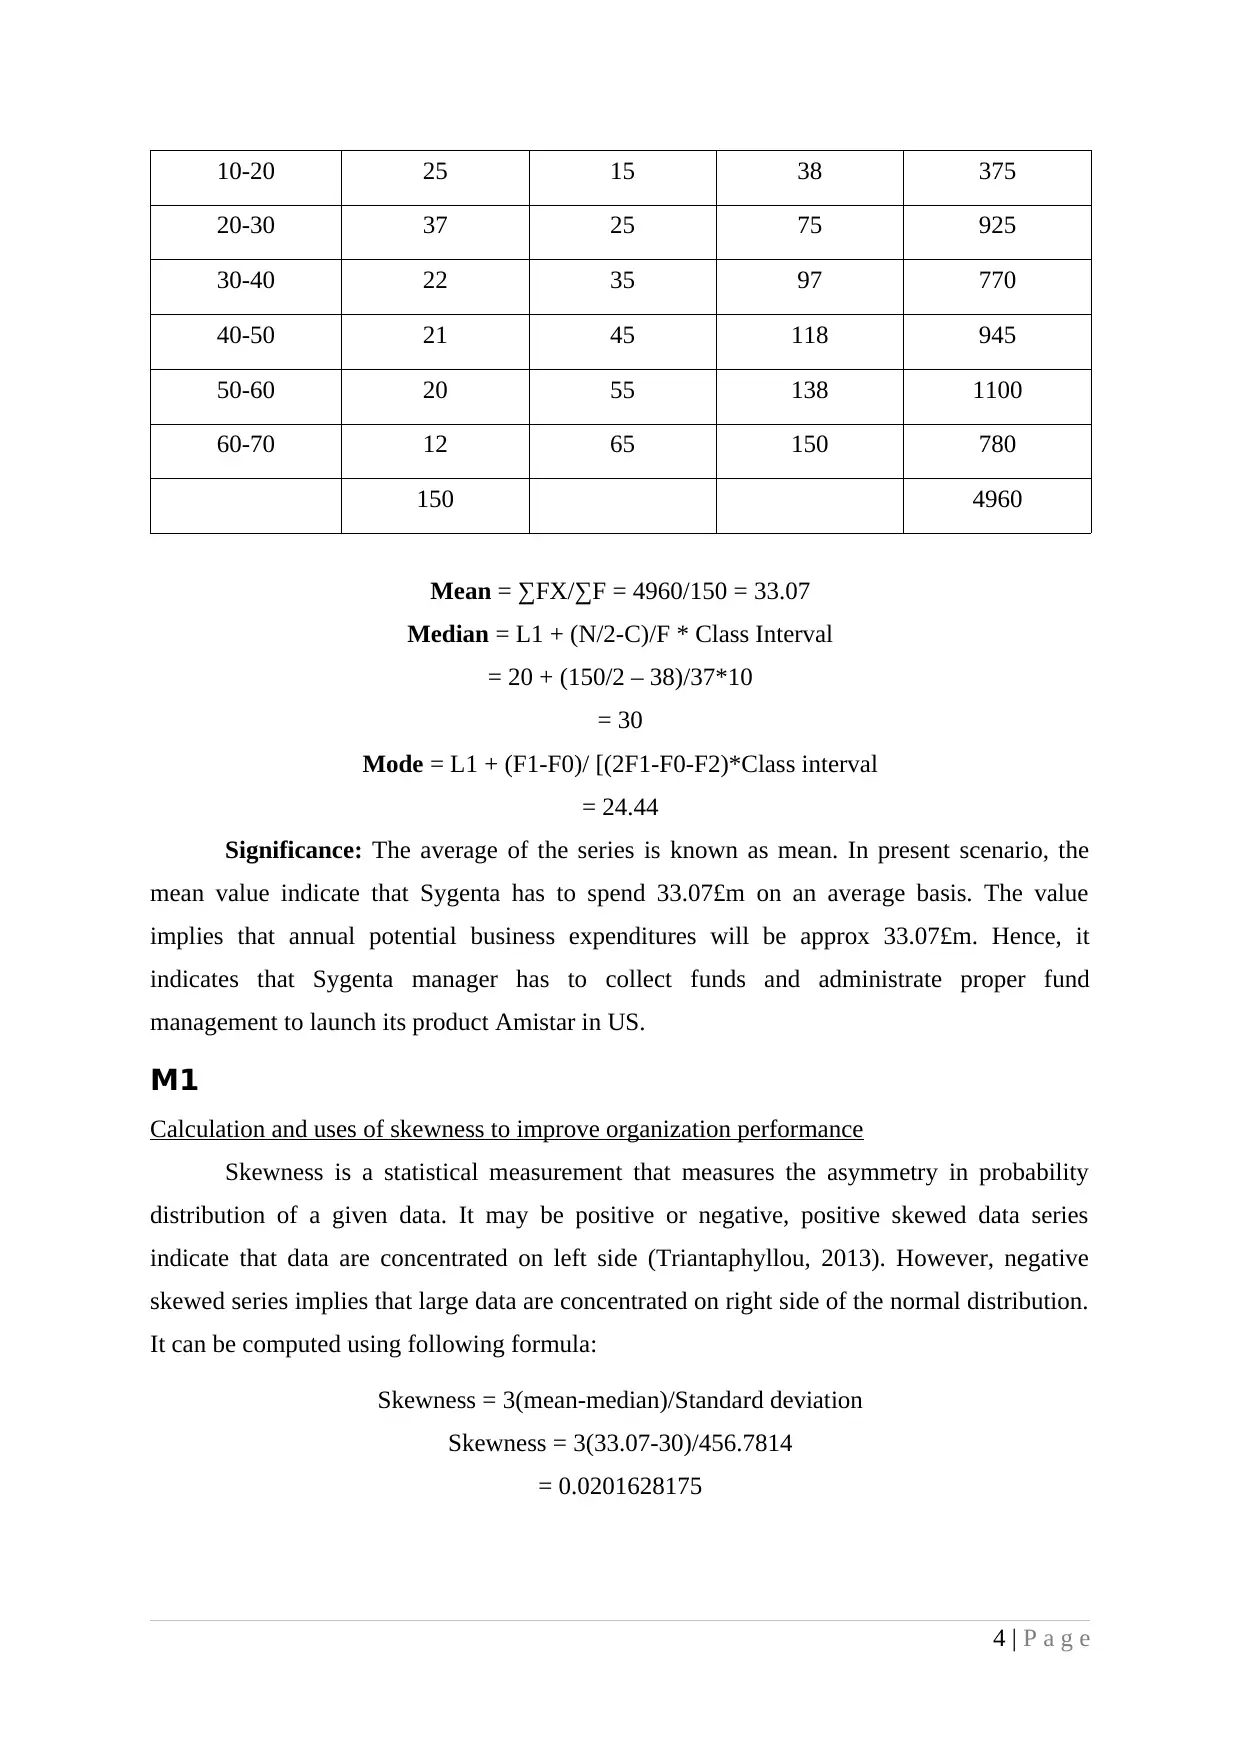
10-20 25 15 38 375
20-30 37 25 75 925
30-40 22 35 97 770
40-50 21 45 118 945
50-60 20 55 138 1100
60-70 12 65 150 780
150 4960
Mean = ∑FX/∑F = 4960/150 = 33.07
Median = L1 + (N/2-C)/F * Class Interval
= 20 + (150/2 – 38)/37*10
= 30
Mode = L1 + (F1-F0)/ [(2F1-F0-F2)*Class interval
= 24.44
Significance: The average of the series is known as mean. In present scenario, the
mean value indicate that Sygenta has to spend 33.07£m on an average basis. The value
implies that annual potential business expenditures will be approx 33.07£m. Hence, it
indicates that Sygenta manager has to collect funds and administrate proper fund
management to launch its product Amistar in US.
M1
Calculation and uses of skewness to improve organization performance
Skewness is a statistical measurement that measures the asymmetry in probability
distribution of a given data. It may be positive or negative, positive skewed data series
indicate that data are concentrated on left side (Triantaphyllou, 2013). However, negative
skewed series implies that large data are concentrated on right side of the normal distribution.
It can be computed using following formula:
Skewness = 3(mean-median)/Standard deviation
Skewness = 3(33.07-30)/456.7814
= 0.0201628175
4 | P a g e
⊘ This is a preview!⊘
Do you want full access?
Subscribe today to unlock all pages.
Trusted by 1+ million students worldwide
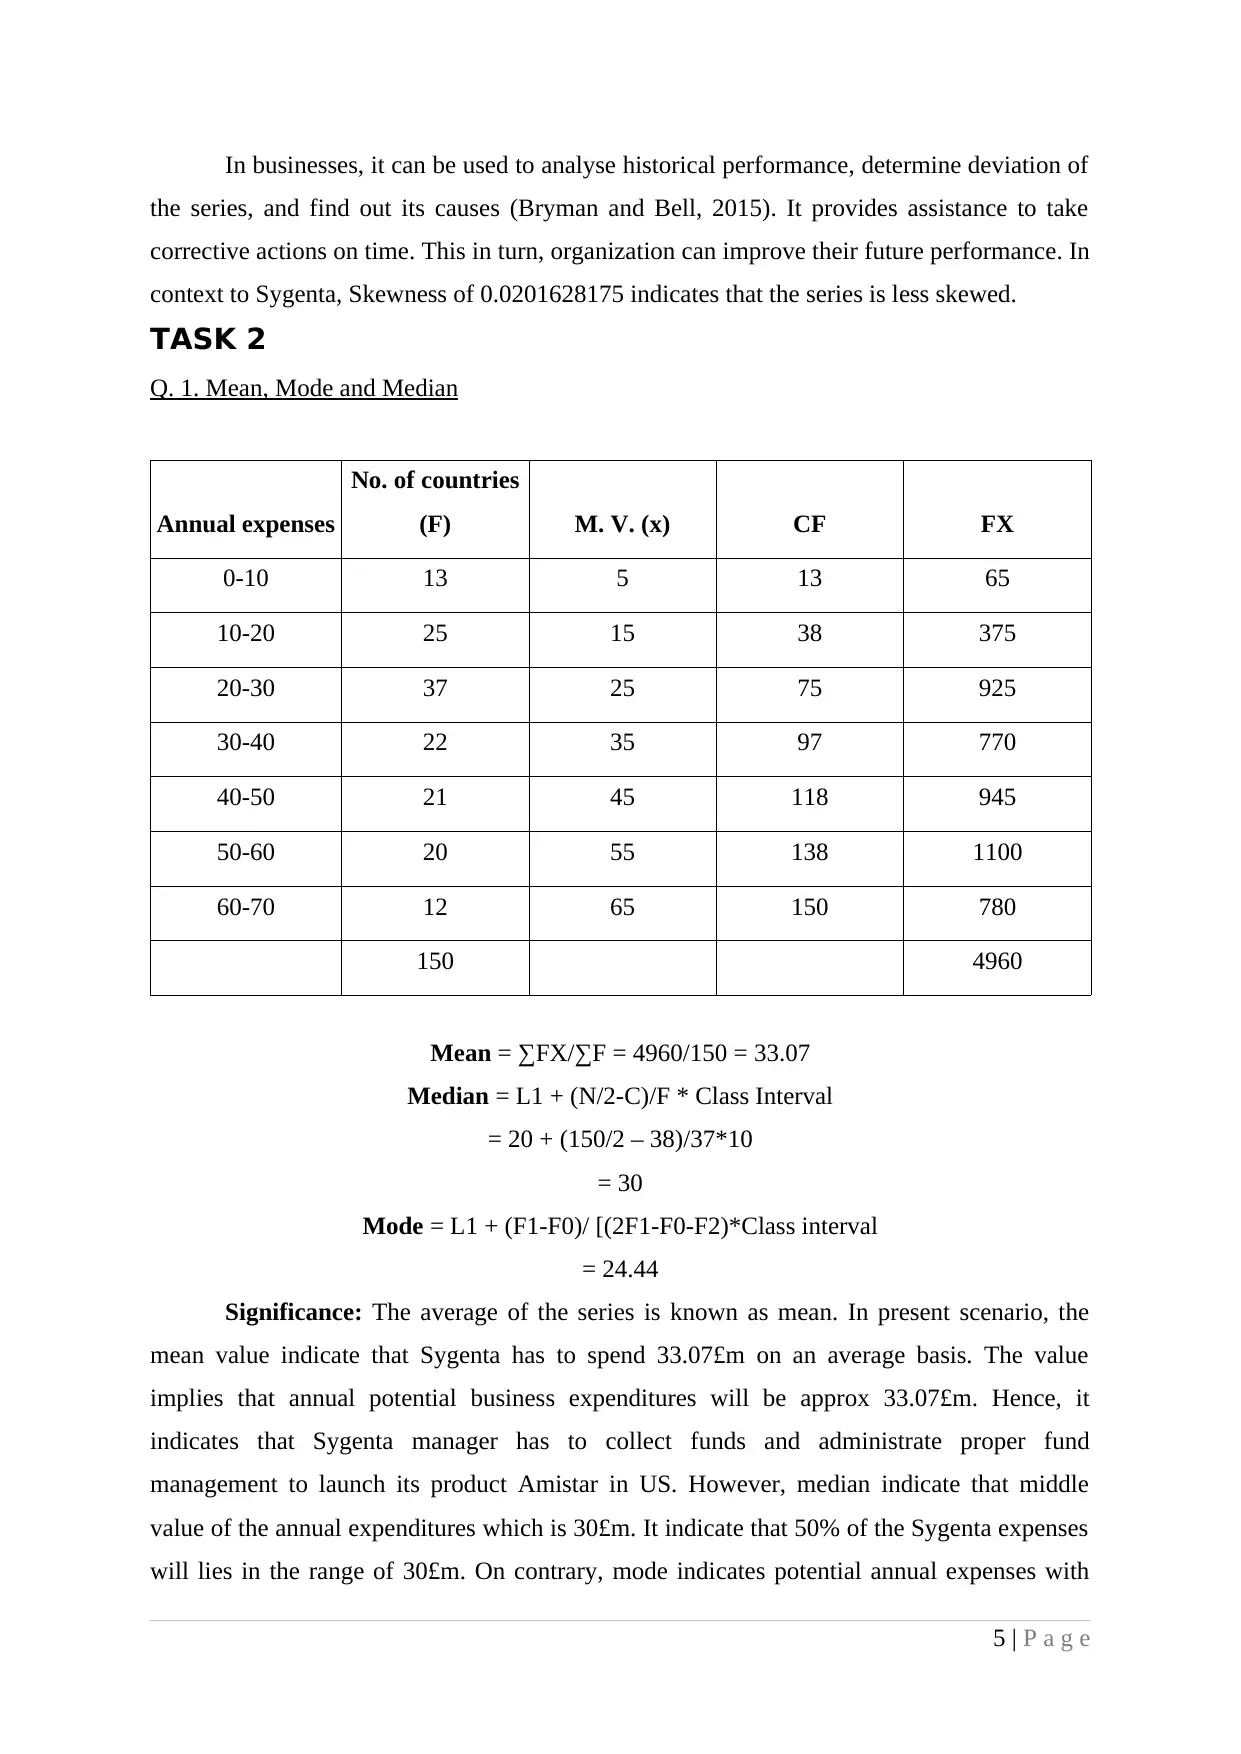
In businesses, it can be used to analyse historical performance, determine deviation of
the series, and find out its causes (Bryman and Bell, 2015). It provides assistance to take
corrective actions on time. This in turn, organization can improve their future performance. In
context to Sygenta, Skewness of 0.0201628175 indicates that the series is less skewed.
TASK 2
Q. 1. Mean, Mode and Median
Annual expenses
No. of countries
(F) M. V. (x) CF FX
0-10 13 5 13 65
10-20 25 15 38 375
20-30 37 25 75 925
30-40 22 35 97 770
40-50 21 45 118 945
50-60 20 55 138 1100
60-70 12 65 150 780
150 4960
Mean = ∑FX/∑F = 4960/150 = 33.07
Median = L1 + (N/2-C)/F * Class Interval
= 20 + (150/2 – 38)/37*10
= 30
Mode = L1 + (F1-F0)/ [(2F1-F0-F2)*Class interval
= 24.44
Significance: The average of the series is known as mean. In present scenario, the
mean value indicate that Sygenta has to spend 33.07£m on an average basis. The value
implies that annual potential business expenditures will be approx 33.07£m. Hence, it
indicates that Sygenta manager has to collect funds and administrate proper fund
management to launch its product Amistar in US. However, median indicate that middle
value of the annual expenditures which is 30£m. It indicate that 50% of the Sygenta expenses
will lies in the range of 30£m. On contrary, mode indicates potential annual expenses with
5 | P a g e
Paraphrase This Document
Need a fresh take? Get an instant paraphrase of this document with our AI Paraphraser
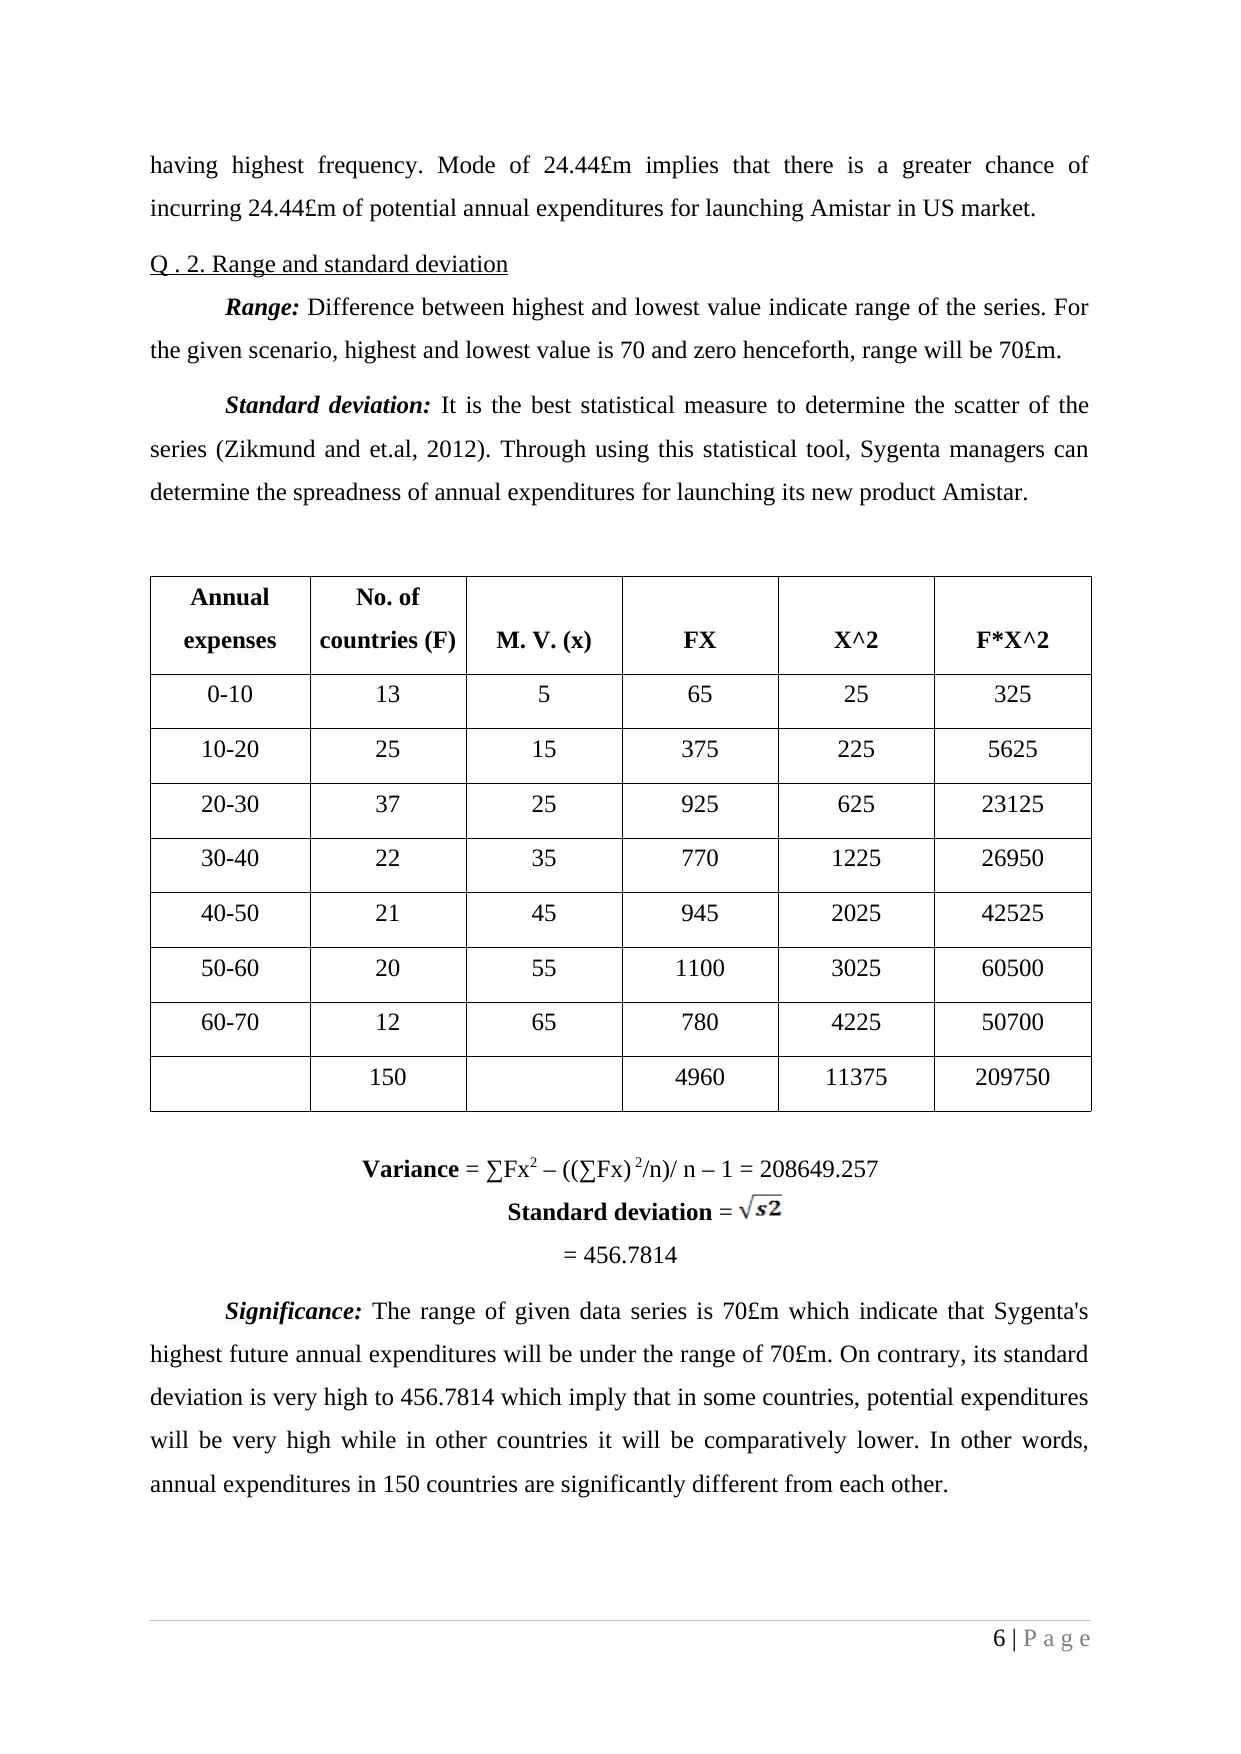
having highest frequency. Mode of 24.44£m implies that there is a greater chance of
incurring 24.44£m of potential annual expenditures for launching Amistar in US market.
Q . 2. Range and standard deviation
Range: Difference between highest and lowest value indicate range of the series. For
the given scenario, highest and lowest value is 70 and zero henceforth, range will be 70£m.
Standard deviation: It is the best statistical measure to determine the scatter of the
series (Zikmund and et.al, 2012). Through using this statistical tool, Sygenta managers can
determine the spreadness of annual expenditures for launching its new product Amistar.
Annual
expenses
No. of
countries (F) M. V. (x) FX X^2 F*X^2
0-10 13 5 65 25 325
10-20 25 15 375 225 5625
20-30 37 25 925 625 23125
30-40 22 35 770 1225 26950
40-50 21 45 945 2025 42525
50-60 20 55 1100 3025 60500
60-70 12 65 780 4225 50700
150 4960 11375 209750
Variance = ∑Fx2 – ((∑Fx) 2/n)/ n – 1 = 208649.257
Standard deviation =
= 456.7814
Significance: The range of given data series is 70£m which indicate that Sygenta's
highest future annual expenditures will be under the range of 70£m. On contrary, its standard
deviation is very high to 456.7814 which imply that in some countries, potential expenditures
will be very high while in other countries it will be comparatively lower. In other words,
annual expenditures in 150 countries are significantly different from each other.
6 | P a g e
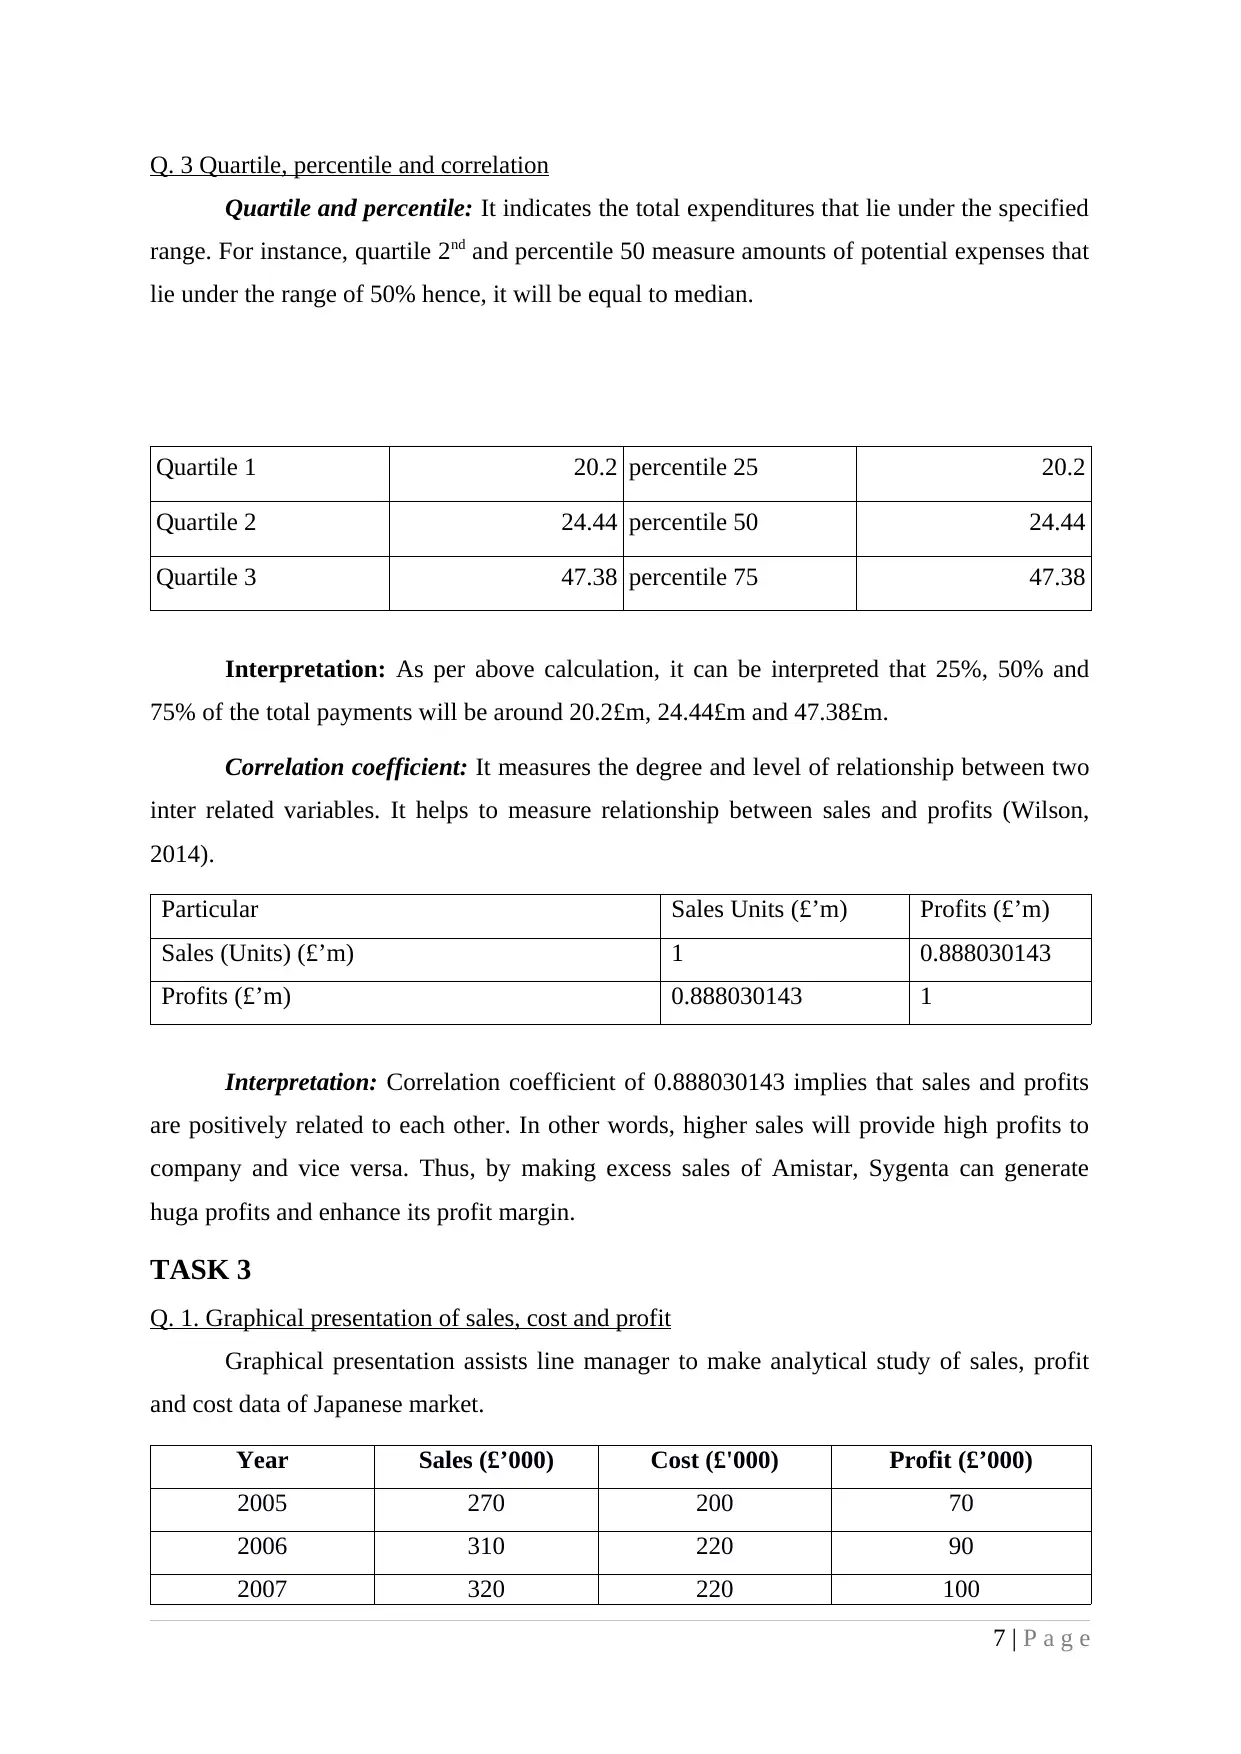
Q. 3 Quartile, percentile and correlation
Quartile and percentile: It indicates the total expenditures that lie under the specified
range. For instance, quartile 2nd and percentile 50 measure amounts of potential expenses that
lie under the range of 50% hence, it will be equal to median.
Quartile 1 20.2 percentile 25 20.2
Quartile 2 24.44 percentile 50 24.44
Quartile 3 47.38 percentile 75 47.38
Interpretation: As per above calculation, it can be interpreted that 25%, 50% and
75% of the total payments will be around 20.2£m, 24.44£m and 47.38£m.
Correlation coefficient: It measures the degree and level of relationship between two
inter related variables. It helps to measure relationship between sales and profits (Wilson,
2014).
Particular Sales Units (£’m) Profits (£’m)
Sales (Units) (£’m) 1 0.888030143
Profits (£’m) 0.888030143 1
Interpretation: Correlation coefficient of 0.888030143 implies that sales and profits
are positively related to each other. In other words, higher sales will provide high profits to
company and vice versa. Thus, by making excess sales of Amistar, Sygenta can generate
huga profits and enhance its profit margin.
TASK 3
Q. 1. Graphical presentation of sales, cost and profit
Graphical presentation assists line manager to make analytical study of sales, profit
and cost data of Japanese market.
Year Sales (£’000) Cost (£'000) Profit (£’000)
2005 270 200 70
2006 310 220 90
2007 320 220 100
7 | P a g e
⊘ This is a preview!⊘
Do you want full access?
Subscribe today to unlock all pages.
Trusted by 1+ million students worldwide
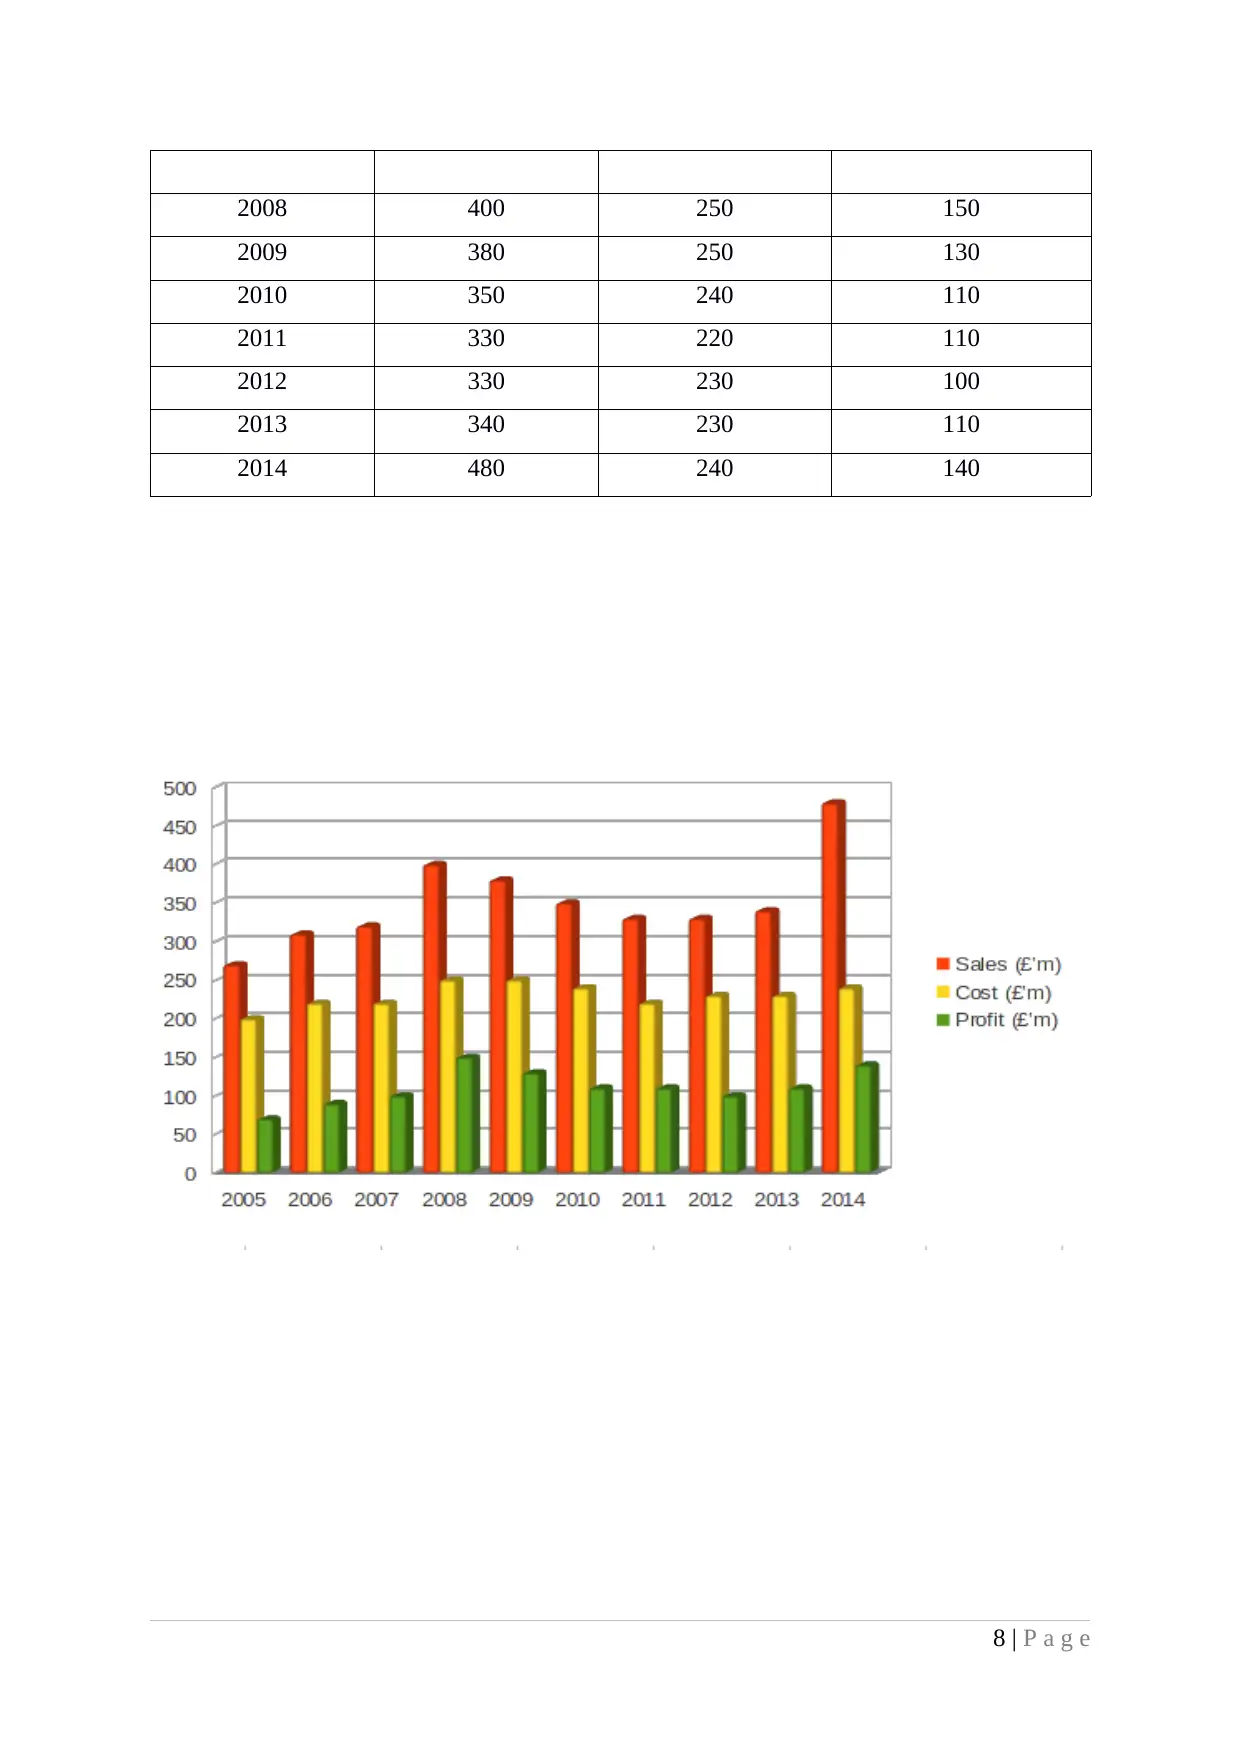
2008 400 250 150
2009 380 250 130
2010 350 240 110
2011 330 220 110
2012 330 230 100
2013 340 230 110
2014 480 240 140
8 | P a g e
2009 380 250 130
2010 350 240 110
2011 330 220 110
2012 330 230 100
2013 340 230 110
2014 480 240 140
8 | P a g e
Paraphrase This Document
Need a fresh take? Get an instant paraphrase of this document with our AI Paraphraser
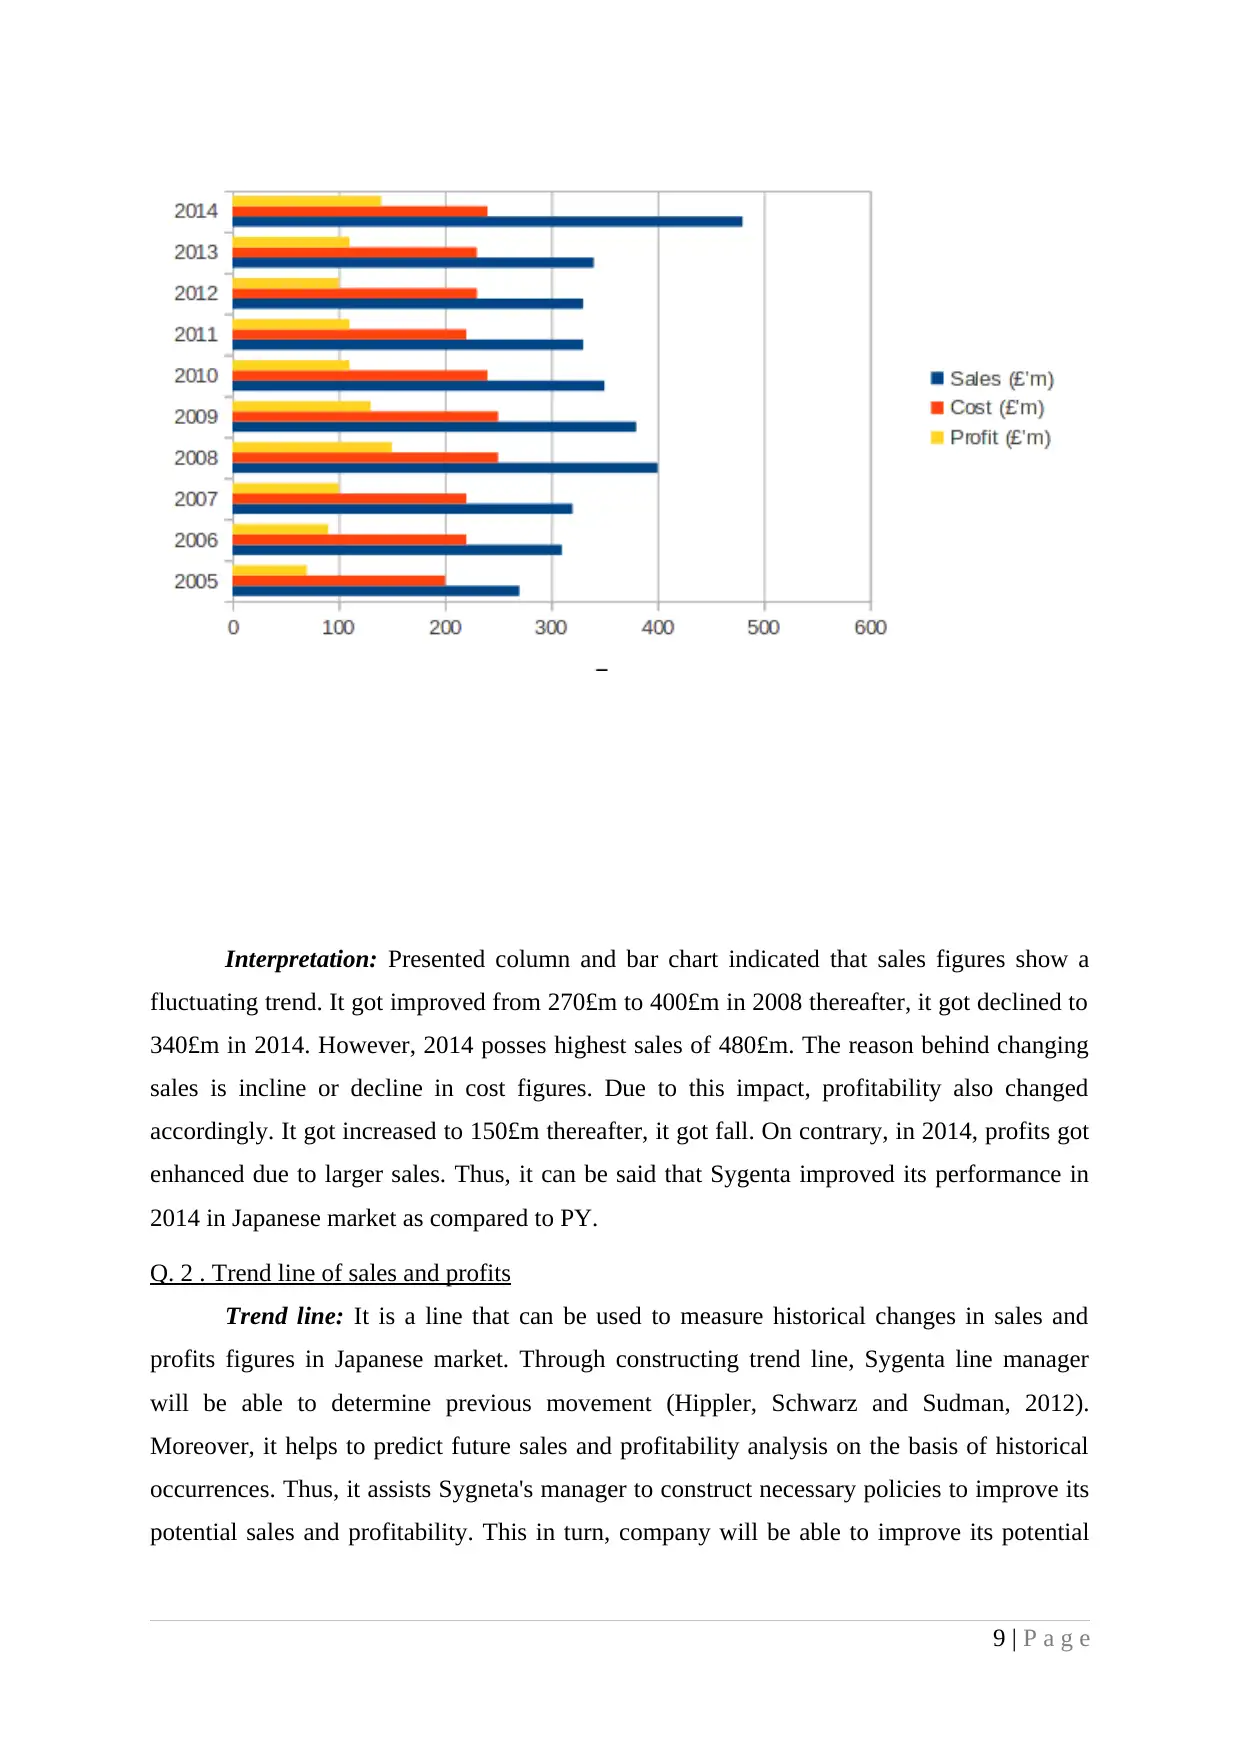
Interpretation: Presented column and bar chart indicated that sales figures show a
fluctuating trend. It got improved from 270£m to 400£m in 2008 thereafter, it got declined to
340£m in 2014. However, 2014 posses highest sales of 480£m. The reason behind changing
sales is incline or decline in cost figures. Due to this impact, profitability also changed
accordingly. It got increased to 150£m thereafter, it got fall. On contrary, in 2014, profits got
enhanced due to larger sales. Thus, it can be said that Sygenta improved its performance in
2014 in Japanese market as compared to PY.
Q. 2 . Trend line of sales and profits
Trend line: It is a line that can be used to measure historical changes in sales and
profits figures in Japanese market. Through constructing trend line, Sygenta line manager
will be able to determine previous movement (Hippler, Schwarz and Sudman, 2012).
Moreover, it helps to predict future sales and profitability analysis on the basis of historical
occurrences. Thus, it assists Sygneta's manager to construct necessary policies to improve its
potential sales and profitability. This in turn, company will be able to improve its potential
9 | P a g e
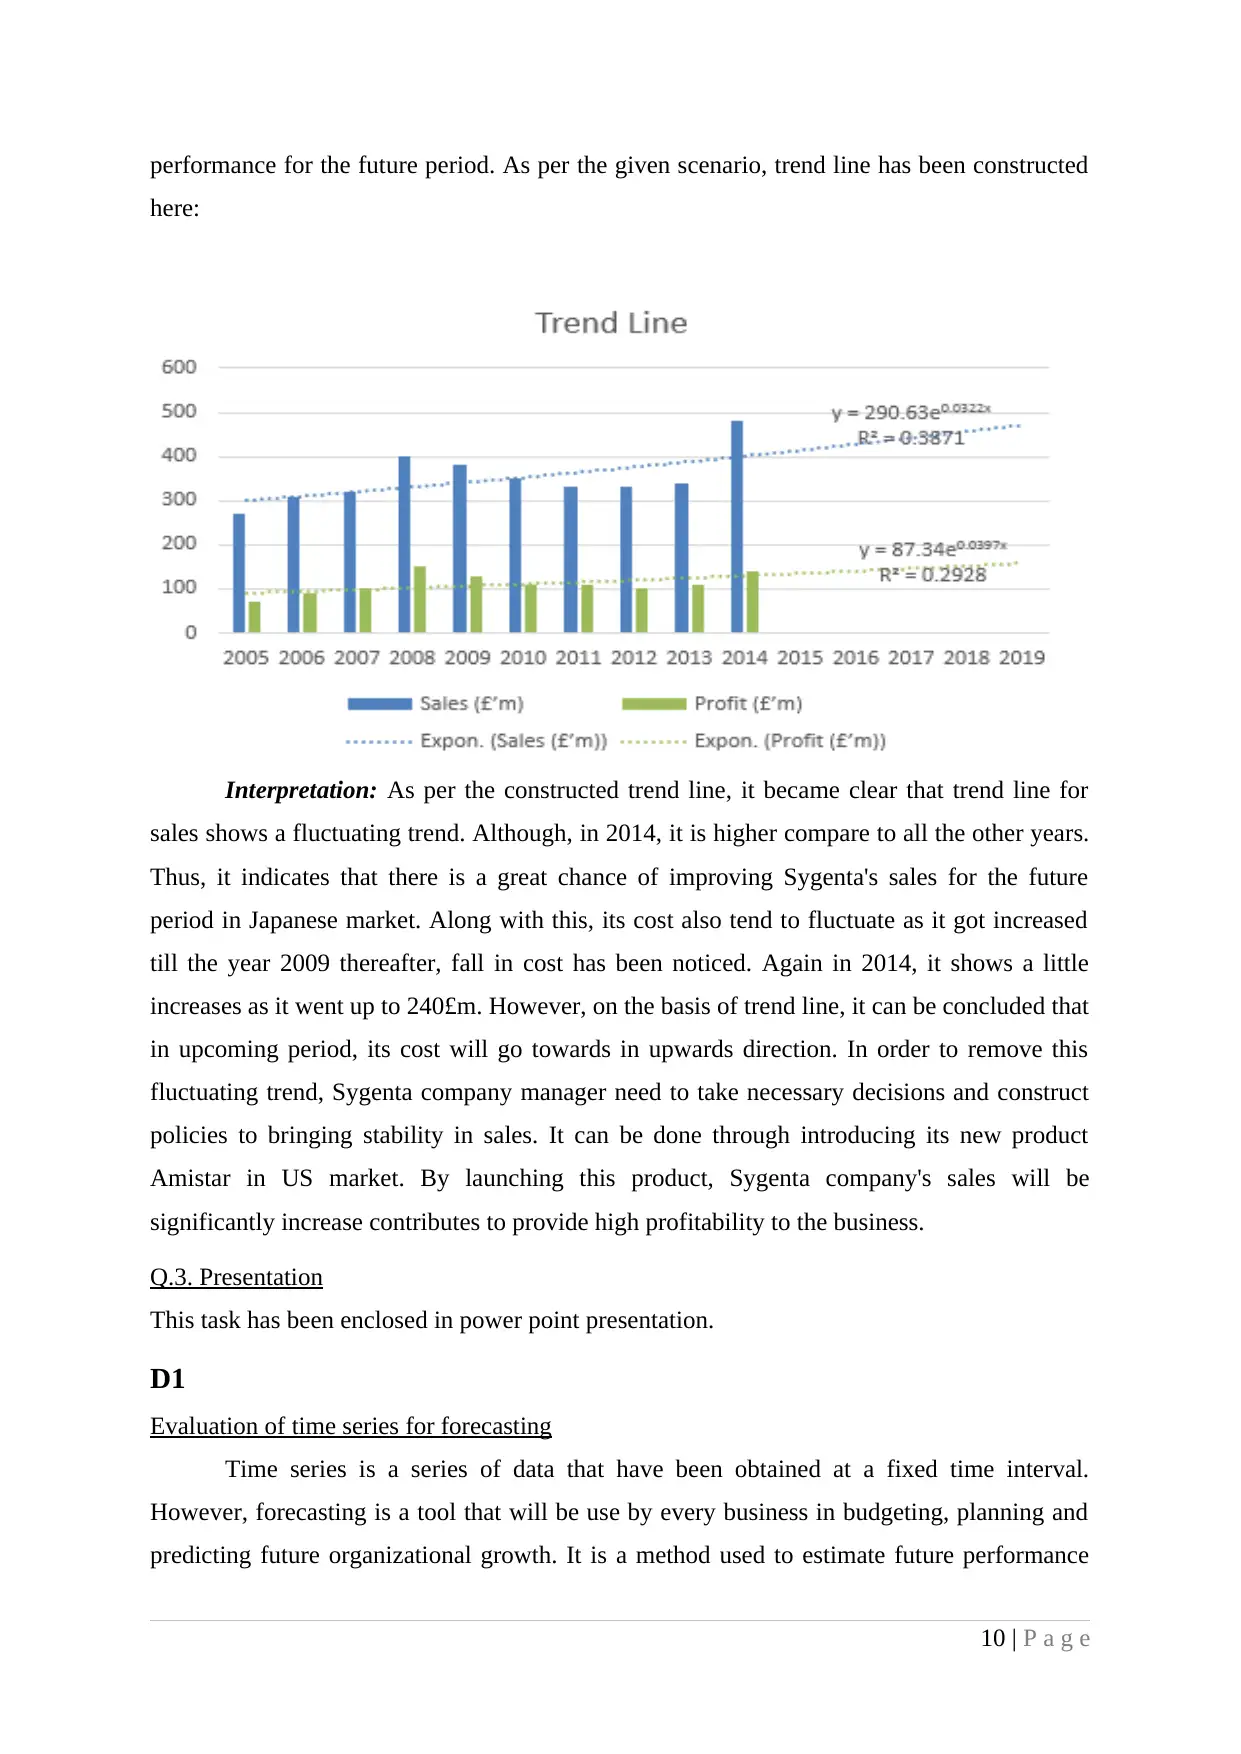
performance for the future period. As per the given scenario, trend line has been constructed
here:
Interpretation: As per the constructed trend line, it became clear that trend line for
sales shows a fluctuating trend. Although, in 2014, it is higher compare to all the other years.
Thus, it indicates that there is a great chance of improving Sygenta's sales for the future
period in Japanese market. Along with this, its cost also tend to fluctuate as it got increased
till the year 2009 thereafter, fall in cost has been noticed. Again in 2014, it shows a little
increases as it went up to 240£m. However, on the basis of trend line, it can be concluded that
in upcoming period, its cost will go towards in upwards direction. In order to remove this
fluctuating trend, Sygenta company manager need to take necessary decisions and construct
policies to bringing stability in sales. It can be done through introducing its new product
Amistar in US market. By launching this product, Sygenta company's sales will be
significantly increase contributes to provide high profitability to the business.
Q.3. Presentation
This task has been enclosed in power point presentation.
D1
Evaluation of time series for forecasting
Time series is a series of data that have been obtained at a fixed time interval.
However, forecasting is a tool that will be use by every business in budgeting, planning and
predicting future organizational growth. It is a method used to estimate future performance
10 | P a g e
⊘ This is a preview!⊘
Do you want full access?
Subscribe today to unlock all pages.
Trusted by 1+ million students worldwide
1 out of 20
Related Documents


Your All-in-One AI-Powered Toolkit for Academic Success.
+13062052269
info@desklib.com
Available 24*7 on WhatsApp / Email
![[object Object]](/_next/static/media/star-bottom.7253800d.svg)
Unlock your academic potential
Copyright © 2020–2026 A2Z Services. All Rights Reserved. Developed and managed by ZUCOL.