Business Report: Data Analysis and Project Planning for Syngenta
VerifiedAdded on 2020/01/23
|21
|4867
|83
Report
AI Summary
This report presents a comprehensive analysis of Syngenta's business decision-making processes, focusing on the potential launch of the Amistar fungicide in India. It begins with a detailed plan for collecting primary and secondary data, including a pest analysis of India and a market survey questionnaire. The report then delves into statistical analysis, calculating and interpreting mean, mode, median, standard deviation, range, quartiles, percentiles, and correlation coefficients to understand Syngenta's financial performance and market dynamics. Furthermore, it includes the development of graphs for data visualization and trend analysis. The report also covers project management aspects, such as the creation of a Gantt chart, network diagram, and the application of investment appraisal techniques to support decision-making. The conclusion summarizes the findings and recommendations for Syngenta's business strategy.

BDM
Paraphrase This Document
Need a fresh take? Get an instant paraphrase of this document with our AI Paraphraser
TABLE OF CONTENTS
INTRODUCTION...........................................................................................................................1
TASK 1............................................................................................................................................1
Plan for the collection of primary and secondary data for a given business problem............1
Survey methodology and sampling frame..............................................................................3
Market survey questionnaire (Customers of Syngenta).......................................................3
TASK 2............................................................................................................................................5
Calculation and importance of mean, mode and median.......................................................5
Computing and analyzing the benefits of standard deviations and range in Syngenta..........7
Use of quartile, percentile and correlation coefficient to Syngenta.......................................7
TASK 3............................................................................................................................................9
Development of graphs by using spread sheets and drawing conclusion based upon it........9
Stating the trend line which can be used for projecting the growth of sales and profit.......11
Power point presentation using suitable software................................................................12
TASK 4..........................................................................................................................................12
{D1}Preparing the Gantt chart and stating the importance of using of project management12
Preparation of network diagram for the activity stating critical path...................................15
{D3}Suitable decision taken by using investment appraisal techniques.............................16
CONCLUSION..............................................................................................................................18
REFERENCES..............................................................................................................................19
INTRODUCTION
Business decision making is a cognitive process of selecting the best alternative out of
several number of alternatives available (Anderson and et.al., 2015). In other words, it can be
said that business decision making is the process of maintaining the balance between all the
activities that take place within the organization in order to achieve the desired objectives of
business. This report is based on the case scenario of Syngenta, which is one of the leading
companies and headquartered in Basel, Switzerland. Company is operating its business in over
90 countries in which more than 28000 employees are working. It aims is to bring “plant
potential to the customer’s life.”
In the following report, research has been conducted by using primary and secondary
sources of data in order to understand and analyse the market structure of Syngenta. Data
collected by using primary and secondary sources have been used to draw various conclusion
out of it. In addition to this, business presentation has been equipped by using different
techniques and software with an aim to propagate information collected in an effective manner.
At the end of this report, project plan for business activities has been interpreted in order to
ascertain the critical path.
TASK 1
Plan for the collection of primary and secondary data for a given business problem
As per the case of study of Syngenta, it has been found that company is planning to
launch Amistar which is a fungicide product. Business can launch its product in India where
large numbers of people are indulged in agricultural business (Badran, Bin-Jaza and Sharshar,
2016). Thus, in order to protect their crops, they require fungicides. Moving toward India can
lead Syngenta towards the growth and success of product. In regard to which, some of the
primary and secondary data collected are listed below.
Pest analysis of India
Pest analysis is an analysis which is done in order to examine the political, economic,
social and technological factors that are present in the environment.
Political: - Number of rules and regulations imposed by government of India put a high
pressure on the new firms to enter. Thus, in order to enter in this market, a complete
understanding of political factors is very important.
⊘ This is a preview!⊘
Do you want full access?
Subscribe today to unlock all pages.
Trusted by 1+ million students worldwide
Economic: - Inflation rate, gross domestic product and foreign exchange rate have high
impact on the entry of firms. The developing country like India has a strong political economy in
place which is a good sign for the entry of new company.
Social: - Social factor of India is relatively good. These factors play a major role in
shaping the market for any type of industry.
Technological: - Reach of internet in India is very less as compared to countries like UK
and US. Thus, if Syngenta wants to start business online then it can create a problem; however, if
they start their business without using these kinds of technologies then they can easily flourish.
Primary data & Secondary data
Primary data is the data collected by the researcher for the first time by conducting
survey. In order to conduct survey in a healthy manner, questionnaire can be prepared with an
aim to analyse the view points of people and collect various information accordingly. In order to
expand its business plan, Syngenta can move with this method (Bai, Dhavale and Sarkis, 2016).
Survey will also help Syngenta to analyse the area where sales of its new products can be
increased. This can be done by considering various segments.
2
Paraphrase This Document
Need a fresh take? Get an instant paraphrase of this document with our AI Paraphraser
Secondary data is the data that has been collected by another researcher in the past.
Secondary data can be collected through website, books, Journals and newspapers (Champathed
and Chansa-ngavej, 2015). By using these sources, researcher can collect various data which is
highly related to the success of fungicides. Thus, by using both these methods, Syngenta will be
able to collect complete information about the future growth and success of product.
Survey methodology and sampling frame
Survey methodology
Concept of survey methodology has been used to collect various data through primary
source. In lieu of which questionnaire has been prepared by the researcher in order to anticipate
the view point of customers related to the fungicides products (Cohen and et.al., 2013). In
addition to this, Syngenta will also be able to analyze whether the launch of Amistar fungicides
in India will prove to be beneficial for company or not.
Sampling frame
A random sampling method has been taken into consideration in which 50 respondents
have been selected on the random basis (Dezső, Ross and Uribe, 2016). Along with this,
categorization has been done on random basis in order to avoid the condition of biasness.
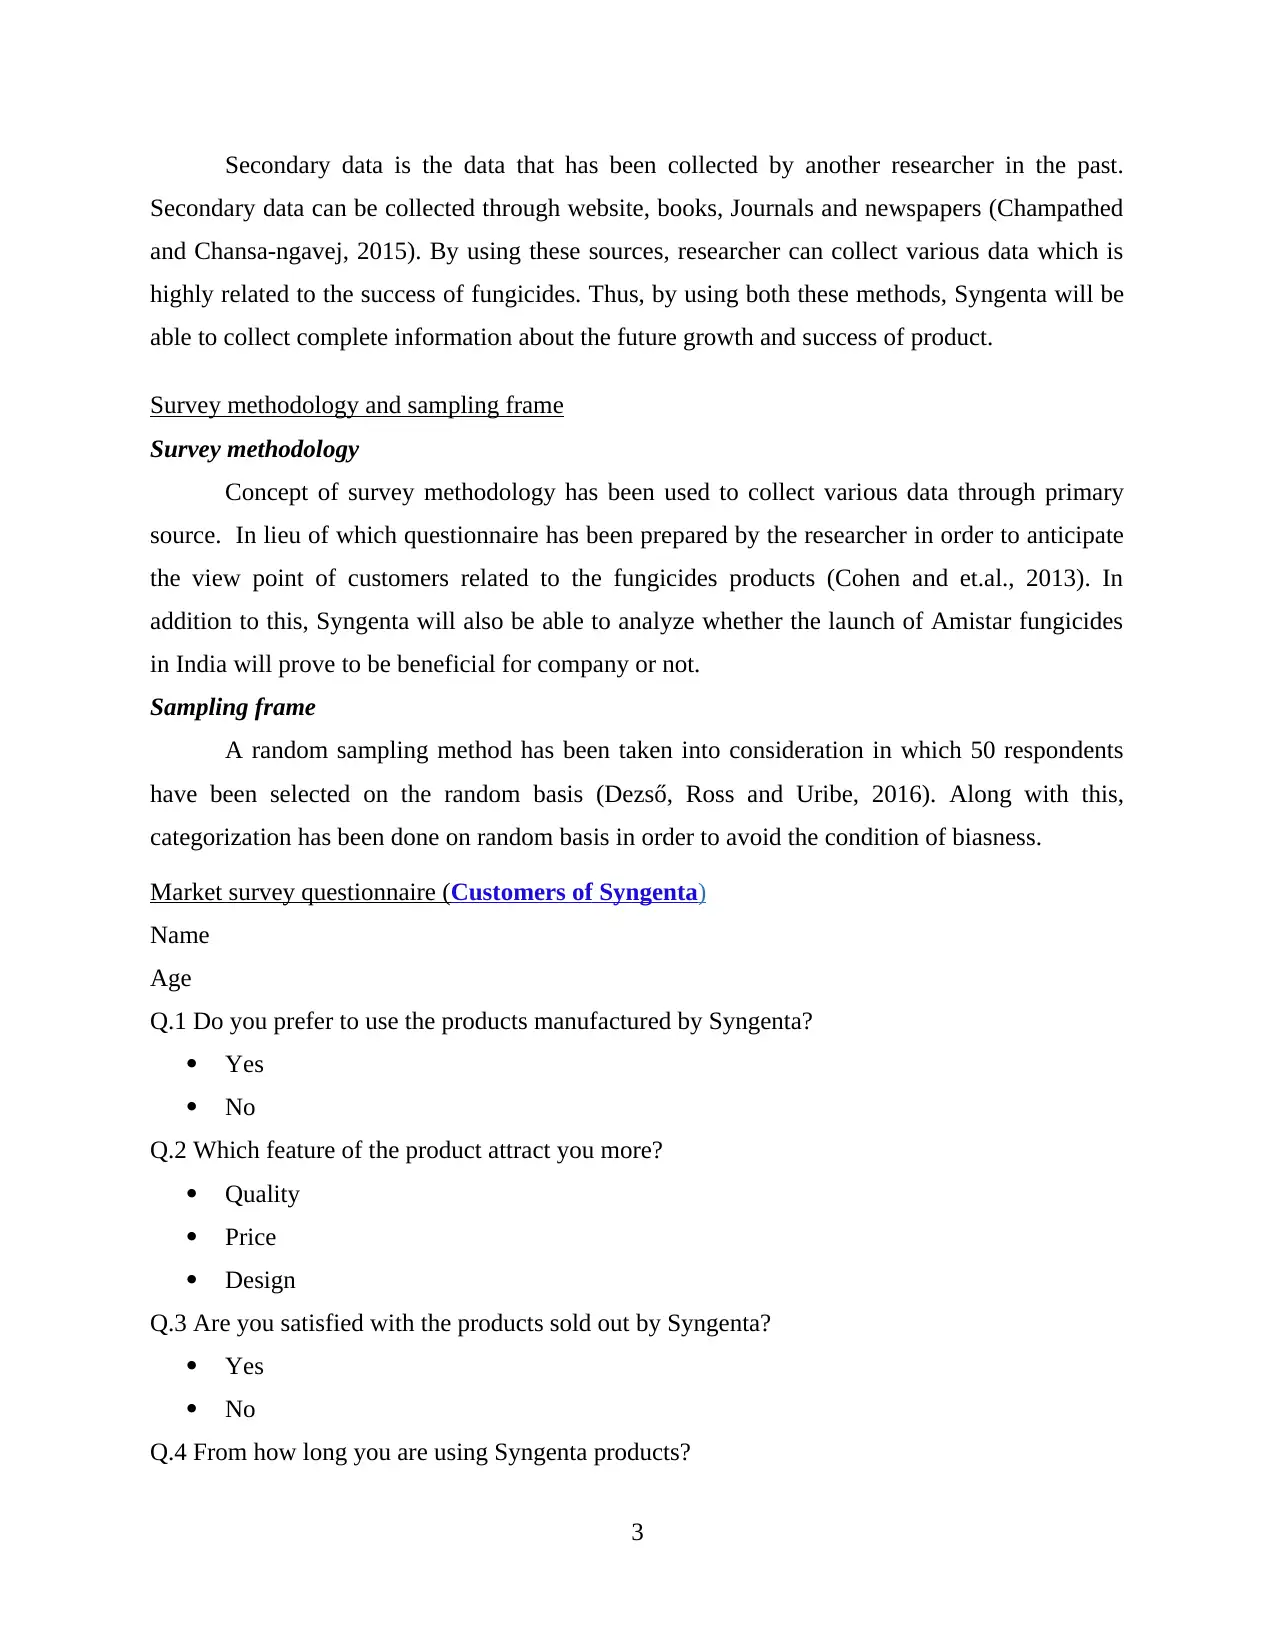
Market survey questionnaire (Customers of Syngenta)
Name
Age
Q.1 Do you prefer to use the products manufactured by Syngenta?
Yes
No
Q.2 Which feature of the product attract you more?
Quality
Price
Design
Q.3 Are you satisfied with the products sold out by Syngenta?
Yes
No
Q.4 From how long you are using Syngenta products?
3
Secondary data can be collected through website, books, Journals and newspapers (Champathed
and Chansa-ngavej, 2015). By using these sources, researcher can collect various data which is
highly related to the success of fungicides. Thus, by using both these methods, Syngenta will be
able to collect complete information about the future growth and success of product.
Survey methodology and sampling frame
Survey methodology
Concept of survey methodology has been used to collect various data through primary
source. In lieu of which questionnaire has been prepared by the researcher in order to anticipate
the view point of customers related to the fungicides products (Cohen and et.al., 2013). In
addition to this, Syngenta will also be able to analyze whether the launch of Amistar fungicides
in India will prove to be beneficial for company or not.
Sampling frame
A random sampling method has been taken into consideration in which 50 respondents
have been selected on the random basis (Dezső, Ross and Uribe, 2016). Along with this,
categorization has been done on random basis in order to avoid the condition of biasness.
Market survey questionnaire (Customers of Syngenta)
Name
Age
Q.1 Do you prefer to use the products manufactured by Syngenta?
Yes
No
Q.2 Which feature of the product attract you more?
Quality
Price
Design
Q.3 Are you satisfied with the products sold out by Syngenta?
Yes
No
Q.4 From how long you are using Syngenta products?
3
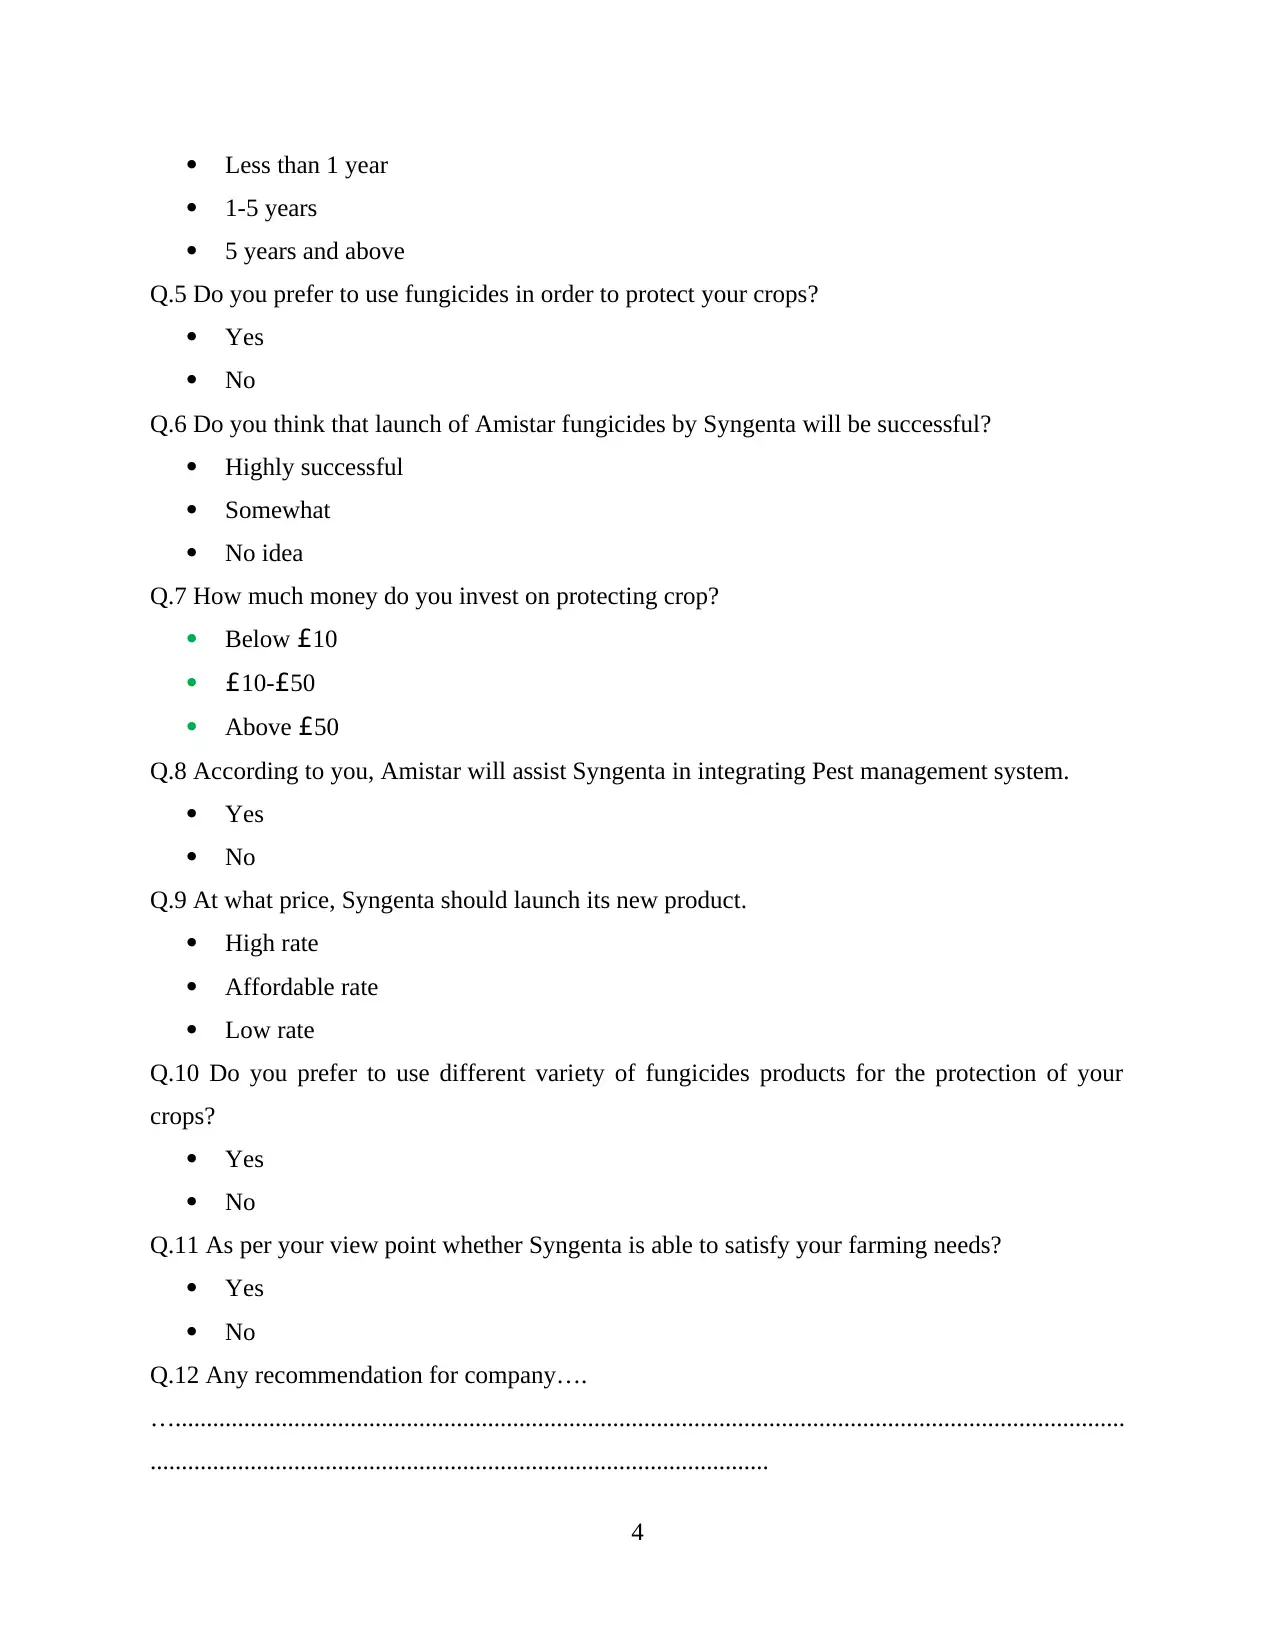
Less than 1 year
1-5 years
5 years and above
Q.5 Do you prefer to use fungicides in order to protect your crops?
Yes
No
Q.6 Do you think that launch of Amistar fungicides by Syngenta will be successful?
Highly successful
Somewhat
No idea
Q.7 How much money do you invest on protecting crop?
Below £10
£10-£50
Above £50
Q.8 According to you, Amistar will assist Syngenta in integrating Pest management system.
Yes
No
Q.9 At what price, Syngenta should launch its new product.
High rate
Affordable rate
Low rate
Q.10 Do you prefer to use different variety of fungicides products for the protection of your
crops?
Yes
No
Q.11 As per your view point whether Syngenta is able to satisfy your farming needs?
Yes
No
Q.12 Any recommendation for company….
…........................................................................................................................................................
...................................................................................................
4
⊘ This is a preview!⊘
Do you want full access?
Subscribe today to unlock all pages.
Trusted by 1+ million students worldwide
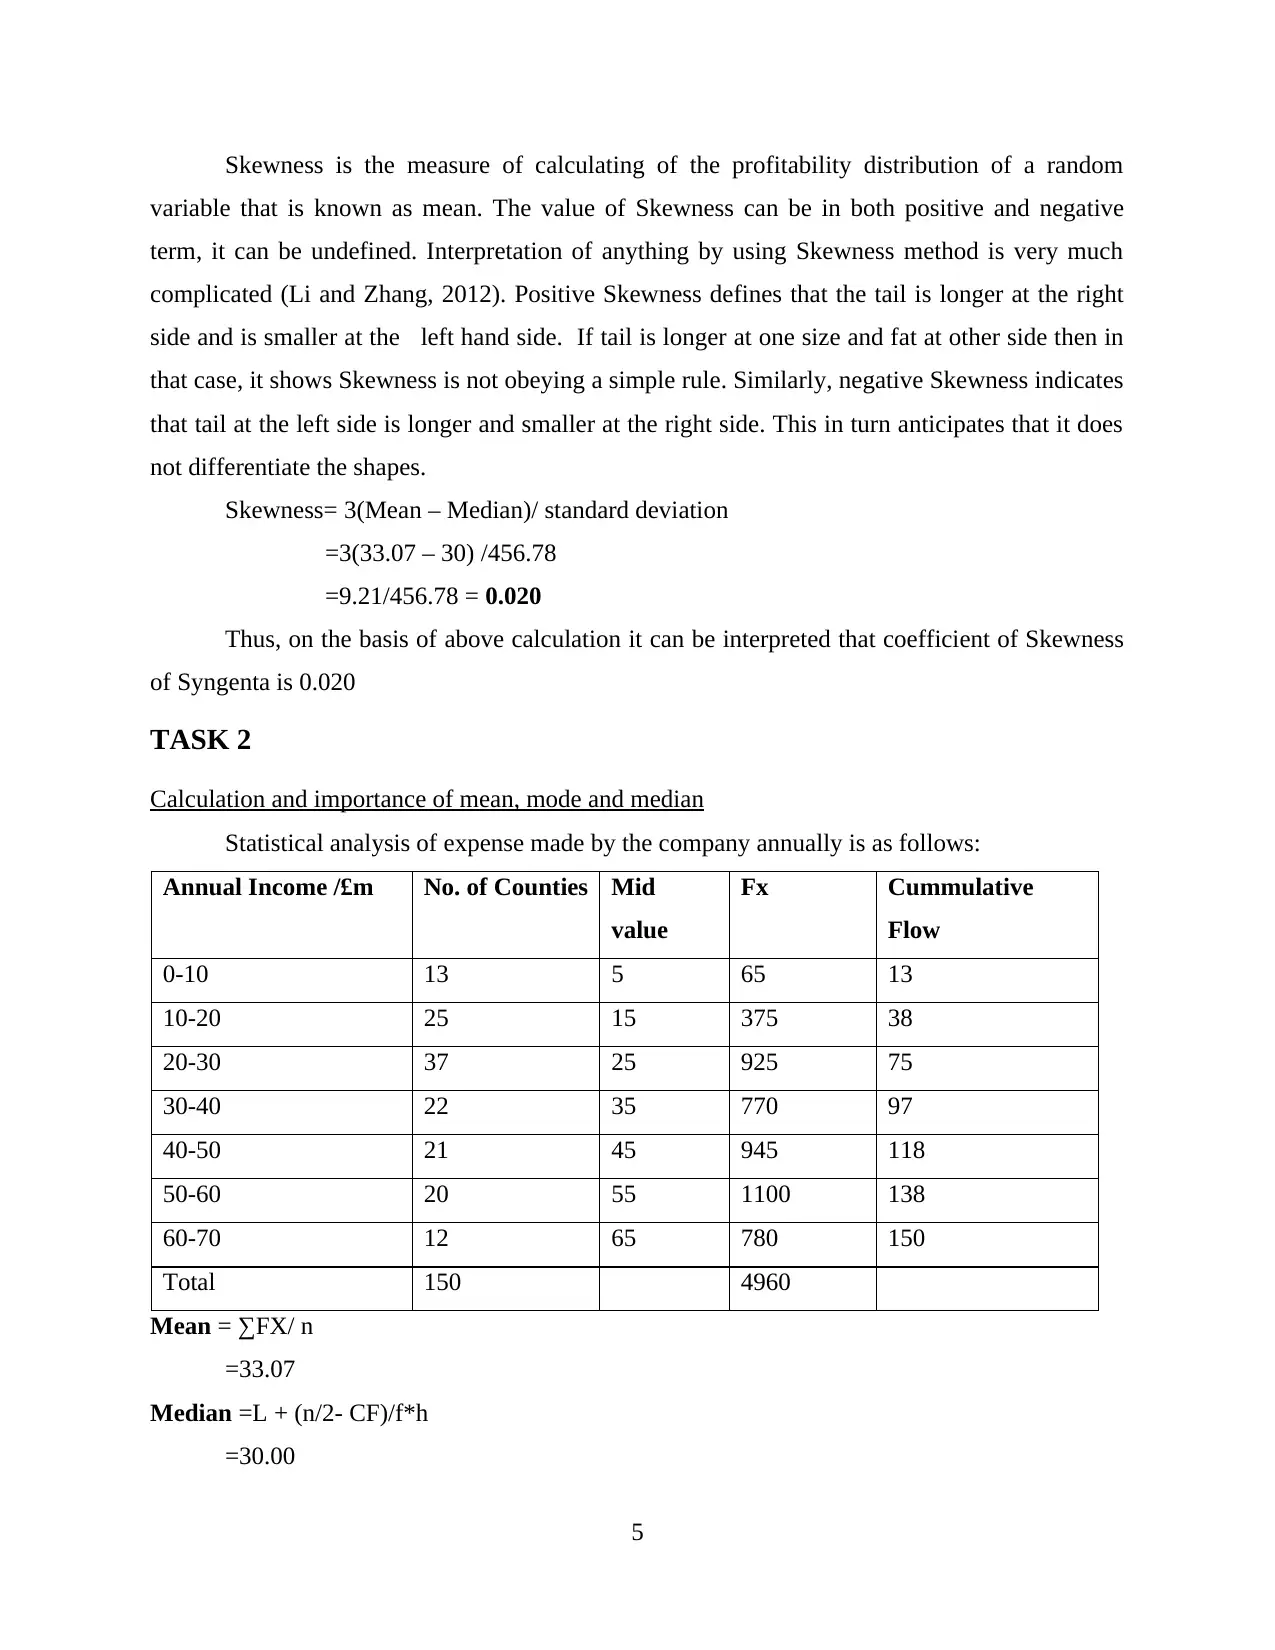
Skewness is the measure of calculating of the profitability distribution of a random
variable that is known as mean. The value of Skewness can be in both positive and negative
term, it can be undefined. Interpretation of anything by using Skewness method is very much
complicated (Li and Zhang, 2012). Positive Skewness defines that the tail is longer at the right
side and is smaller at the left hand side. If tail is longer at one size and fat at other side then in
that case, it shows Skewness is not obeying a simple rule. Similarly, negative Skewness indicates
that tail at the left side is longer and smaller at the right side. This in turn anticipates that it does
not differentiate the shapes.
Skewness= 3(Mean – Median)/ standard deviation
=3(33.07 – 30) /456.78
=9.21/456.78 = 0.020
Thus, on the basis of above calculation it can be interpreted that coefficient of Skewness
of Syngenta is 0.020
TASK 2
Calculation and importance of mean, mode and median
Statistical analysis of expense made by the company annually is as follows:
Annual Income /£m No. of Counties Mid
value
Fx Cummulative
Flow
0-10 13 5 65 13
10-20 25 15 375 38
20-30 37 25 925 75
30-40 22 35 770 97
40-50 21 45 945 118
50-60 20 55 1100 138
60-70 12 65 780 150
Total 150 4960
Mean = ∑FX/ n
=33.07
Median =L + (n/2- CF)/f*h
=30.00
5
Paraphrase This Document
Need a fresh take? Get an instant paraphrase of this document with our AI Paraphraser
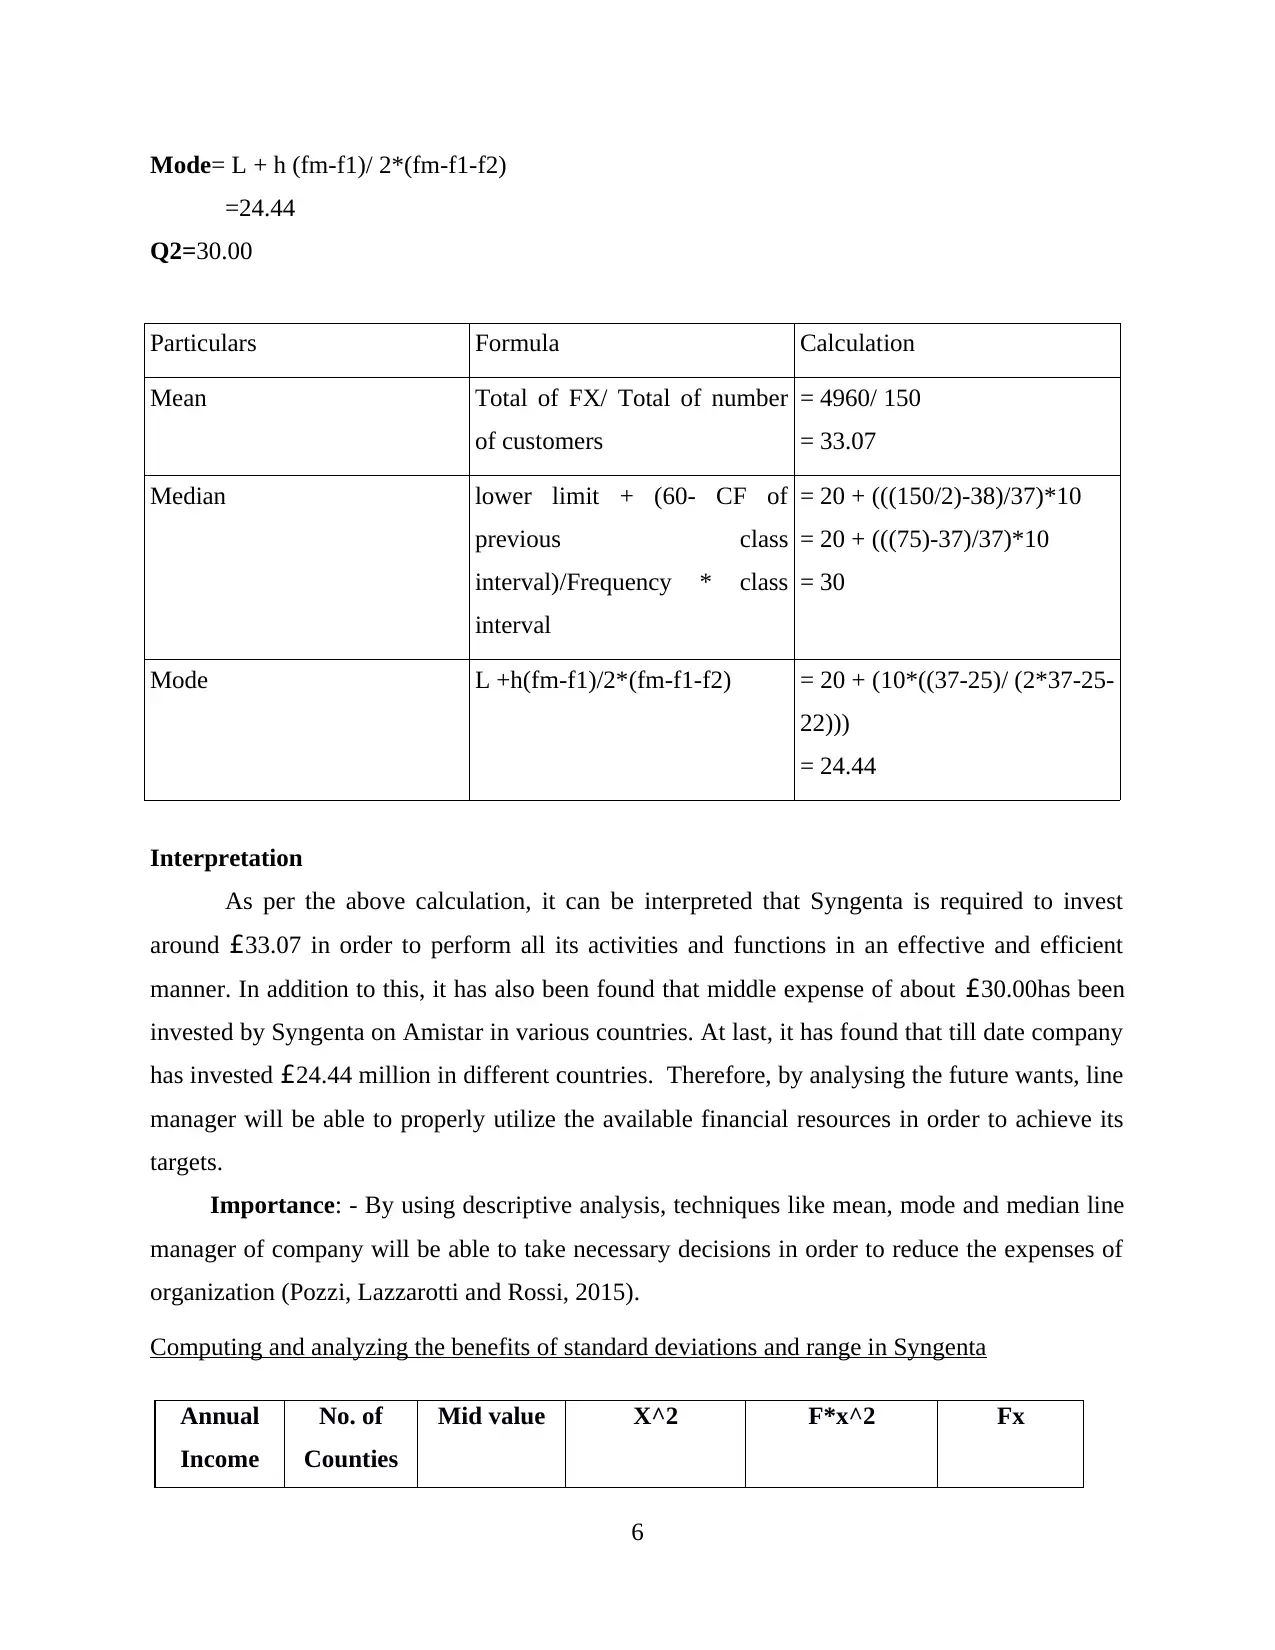
Mode= L + h (fm-f1)/ 2*(fm-f1-f2)
=24.44
Q2=30.00
Particulars Formula Calculation
Mean Total of FX/ Total of number
of customers
= 4960/ 150
= 33.07
Median lower limit + (60- CF of
previous class
interval)/Frequency * class
interval
= 20 + (((150/2)-38)/37)*10
= 20 + (((75)-37)/37)*10
= 30
Mode L +h(fm-f1)/2*(fm-f1-f2) = 20 + (10*((37-25)/ (2*37-25-
22)))
= 24.44
Interpretation
As per the above calculation, it can be interpreted that Syngenta is required to invest
around £33.07 in order to perform all its activities and functions in an effective and efficient
manner. In addition to this, it has also been found that middle expense of about £30.00has been
invested by Syngenta on Amistar in various countries. At last, it has found that till date company
has invested £24.44 million in different countries. Therefore, by analysing the future wants, line
manager will be able to properly utilize the available financial resources in order to achieve its
targets.
Importance: - By using descriptive analysis, techniques like mean, mode and median line
manager of company will be able to take necessary decisions in order to reduce the expenses of
organization (Pozzi, Lazzarotti and Rossi, 2015).
Computing and analyzing the benefits of standard deviations and range in Syngenta
Annual
Income
No. of
Counties
Mid value X^2 F*x^2 Fx
6
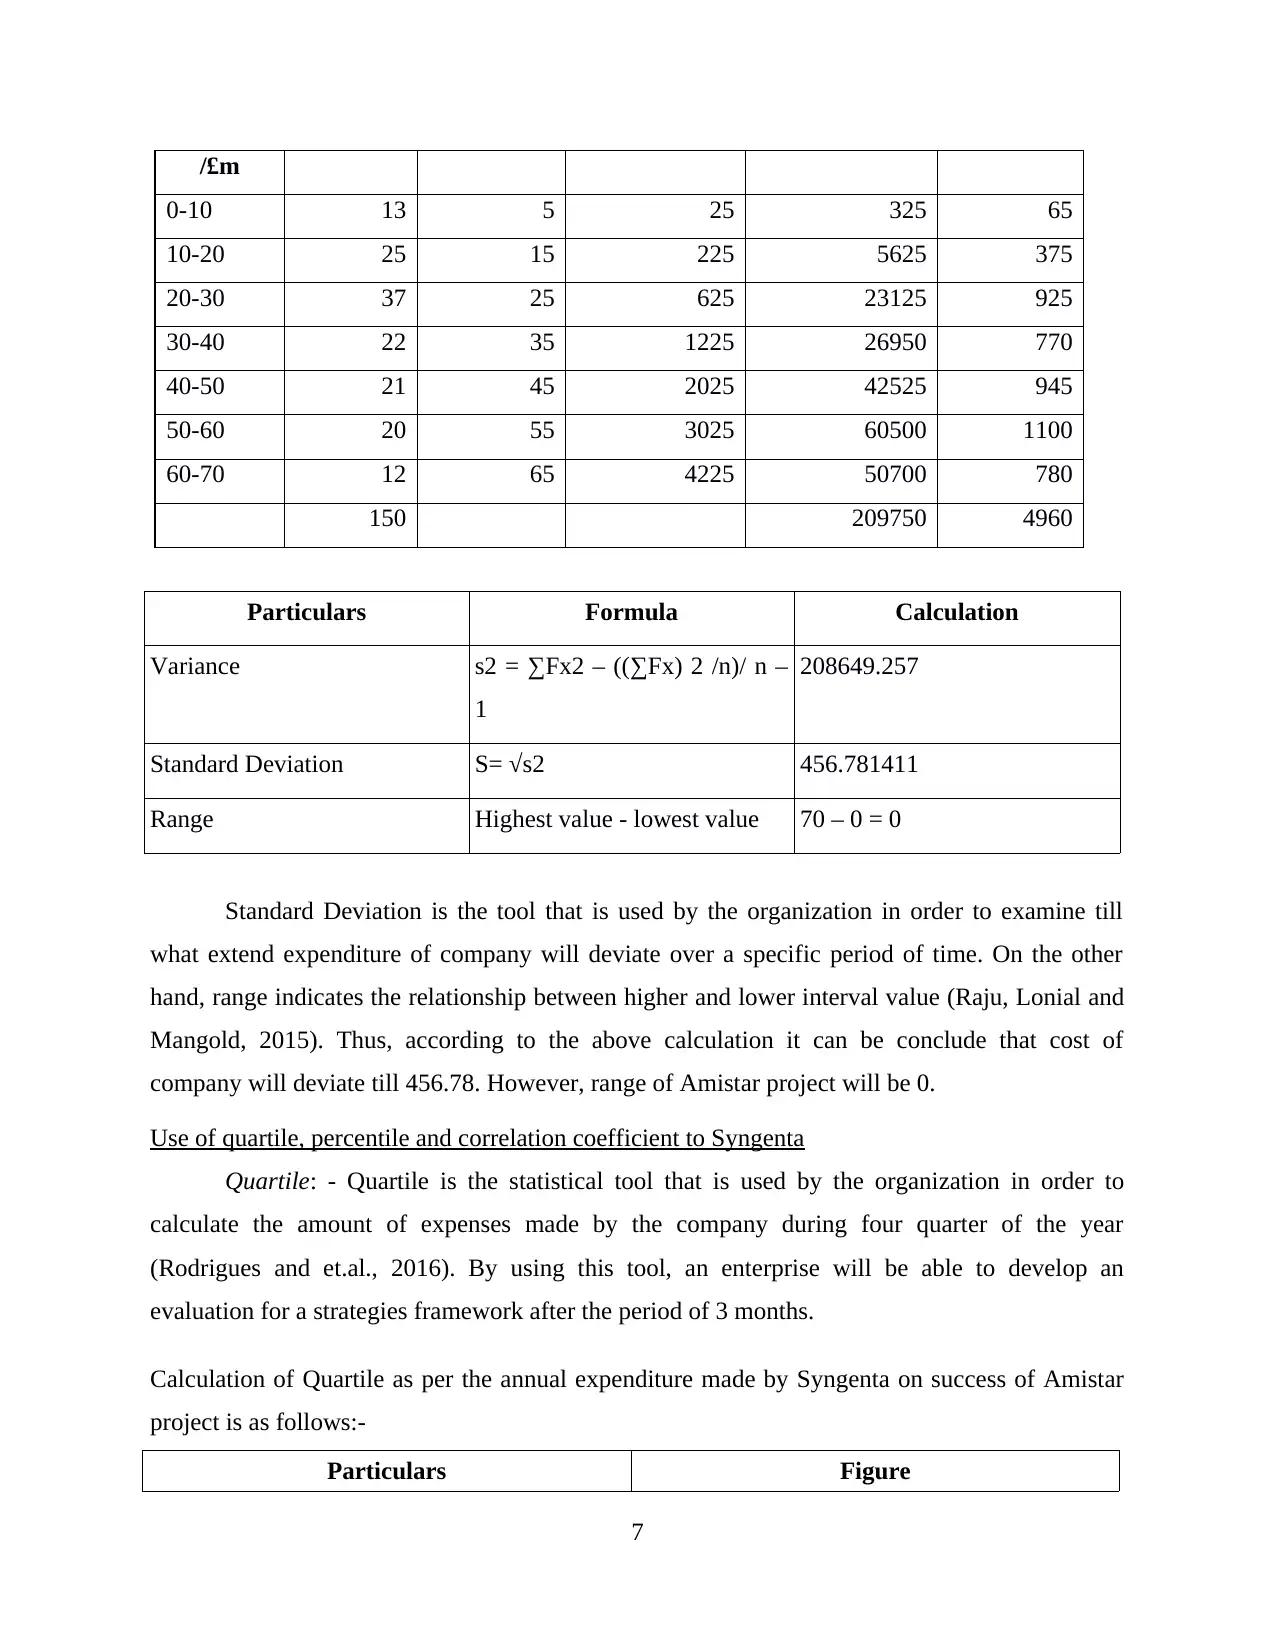
/£m
0-10 13 5 25 325 65
10-20 25 15 225 5625 375
20-30 37 25 625 23125 925
30-40 22 35 1225 26950 770
40-50 21 45 2025 42525 945
50-60 20 55 3025 60500 1100
60-70 12 65 4225 50700 780
150 209750 4960
Particulars Formula Calculation
Variance s2 = ∑Fx2 – ((∑Fx) 2 /n)/ n –
1
208649.257
Standard Deviation S= √s2 456.781411
Range Highest value - lowest value 70 – 0 = 0
Standard Deviation is the tool that is used by the organization in order to examine till
what extend expenditure of company will deviate over a specific period of time. On the other
hand, range indicates the relationship between higher and lower interval value (Raju, Lonial and
Mangold, 2015). Thus, according to the above calculation it can be conclude that cost of
company will deviate till 456.78. However, range of Amistar project will be 0.
Use of quartile, percentile and correlation coefficient to Syngenta
Quartile: - Quartile is the statistical tool that is used by the organization in order to
calculate the amount of expenses made by the company during four quarter of the year
(Rodrigues and et.al., 2016). By using this tool, an enterprise will be able to develop an
evaluation for a strategies framework after the period of 3 months.
Calculation of Quartile as per the annual expenditure made by Syngenta on success of Amistar
project is as follows:-
Particulars Figure
7
⊘ This is a preview!⊘
Do you want full access?
Subscribe today to unlock all pages.
Trusted by 1+ million students worldwide
Quartile 1 20.2
Quartile 2 24.44
Quartile 3 47.38
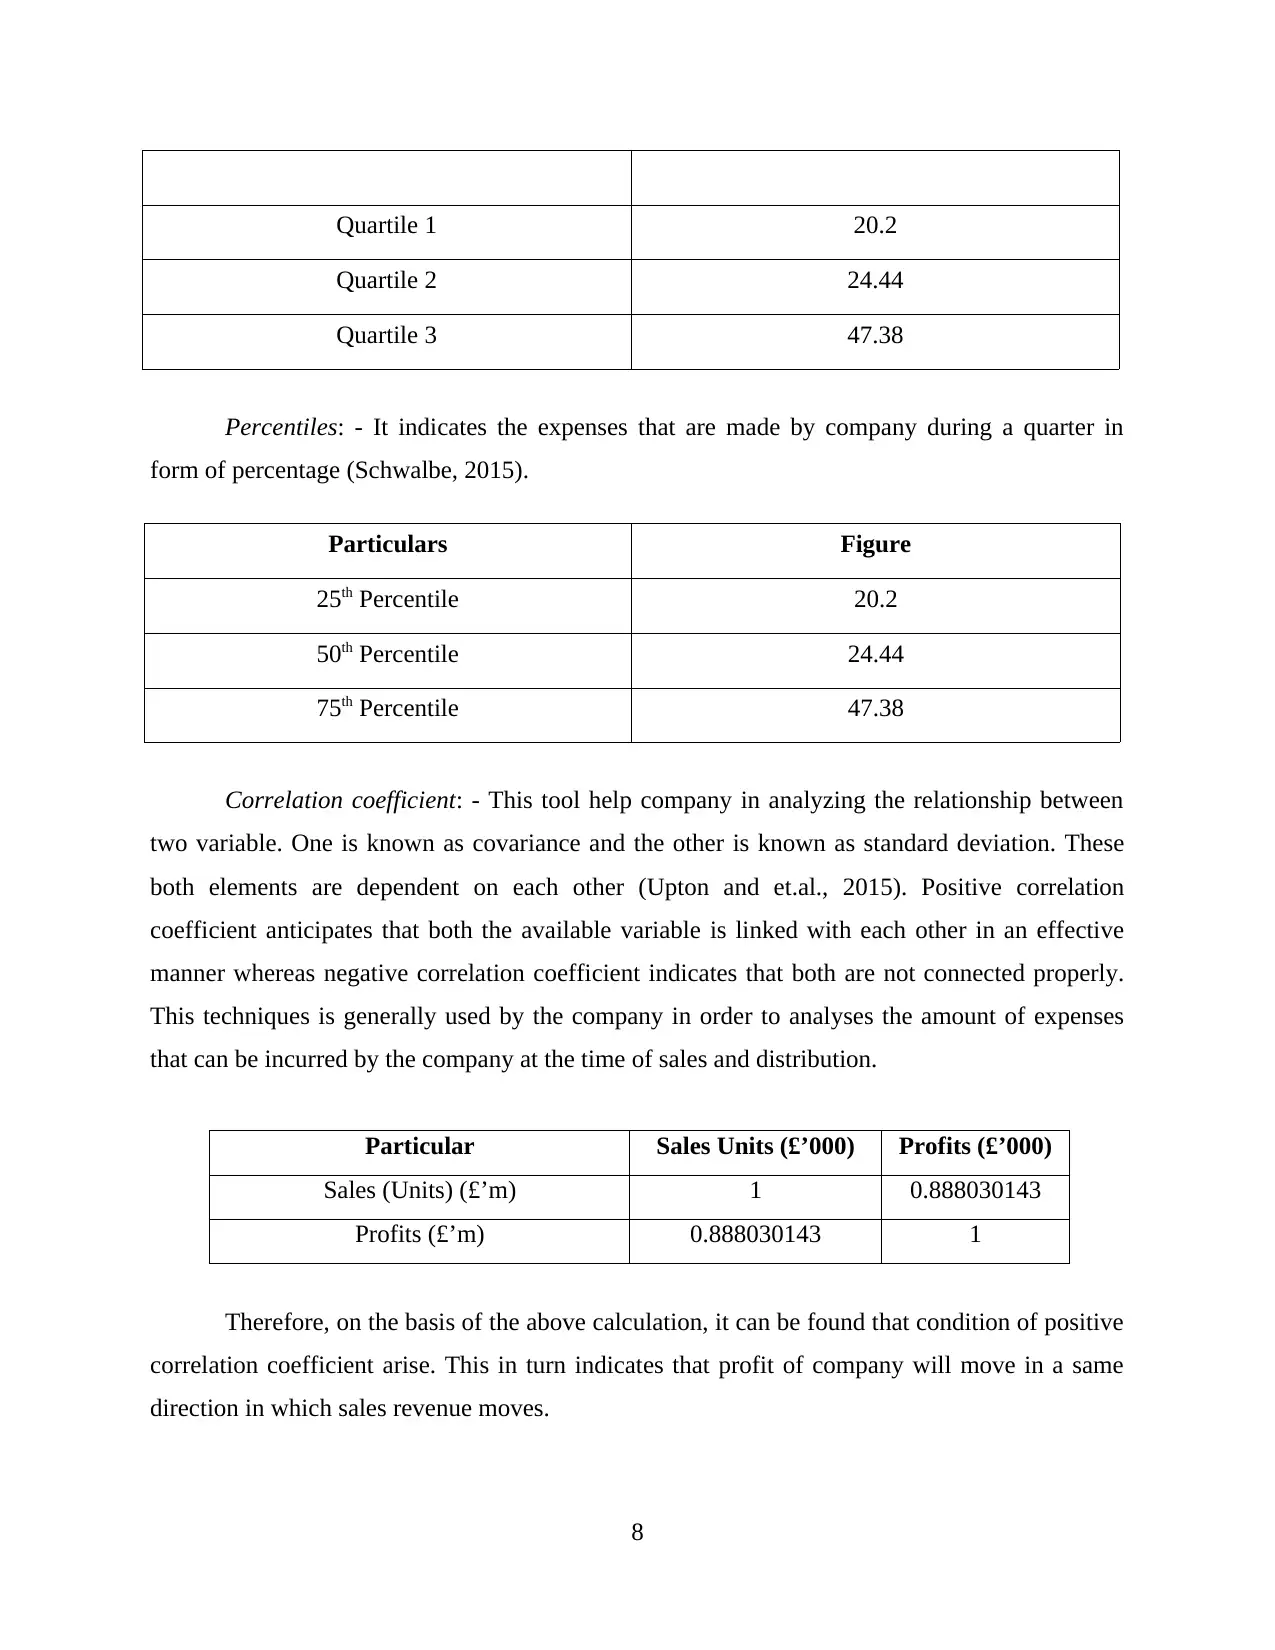
Percentiles: - It indicates the expenses that are made by company during a quarter in
form of percentage (Schwalbe, 2015).
Particulars Figure
25th Percentile 20.2
50th Percentile 24.44
75th Percentile 47.38
Correlation coefficient: - This tool help company in analyzing the relationship between
two variable. One is known as covariance and the other is known as standard deviation. These
both elements are dependent on each other (Upton and et.al., 2015). Positive correlation
coefficient anticipates that both the available variable is linked with each other in an effective
manner whereas negative correlation coefficient indicates that both are not connected properly.
This techniques is generally used by the company in order to analyses the amount of expenses
that can be incurred by the company at the time of sales and distribution.
Particular Sales Units (£’000) Profits (£’000)
Sales (Units) (£’m) 1 0.888030143
Profits (£’m) 0.888030143 1
Therefore, on the basis of the above calculation, it can be found that condition of positive
correlation coefficient arise. This in turn indicates that profit of company will move in a same
direction in which sales revenue moves.
8
Quartile 2 24.44
Quartile 3 47.38
Percentiles: - It indicates the expenses that are made by company during a quarter in
form of percentage (Schwalbe, 2015).
Particulars Figure
25th Percentile 20.2
50th Percentile 24.44
75th Percentile 47.38
Correlation coefficient: - This tool help company in analyzing the relationship between
two variable. One is known as covariance and the other is known as standard deviation. These
both elements are dependent on each other (Upton and et.al., 2015). Positive correlation
coefficient anticipates that both the available variable is linked with each other in an effective
manner whereas negative correlation coefficient indicates that both are not connected properly.
This techniques is generally used by the company in order to analyses the amount of expenses
that can be incurred by the company at the time of sales and distribution.
Particular Sales Units (£’000) Profits (£’000)
Sales (Units) (£’m) 1 0.888030143
Profits (£’m) 0.888030143 1
Therefore, on the basis of the above calculation, it can be found that condition of positive
correlation coefficient arise. This in turn indicates that profit of company will move in a same
direction in which sales revenue moves.
8
Paraphrase This Document
Need a fresh take? Get an instant paraphrase of this document with our AI Paraphraser
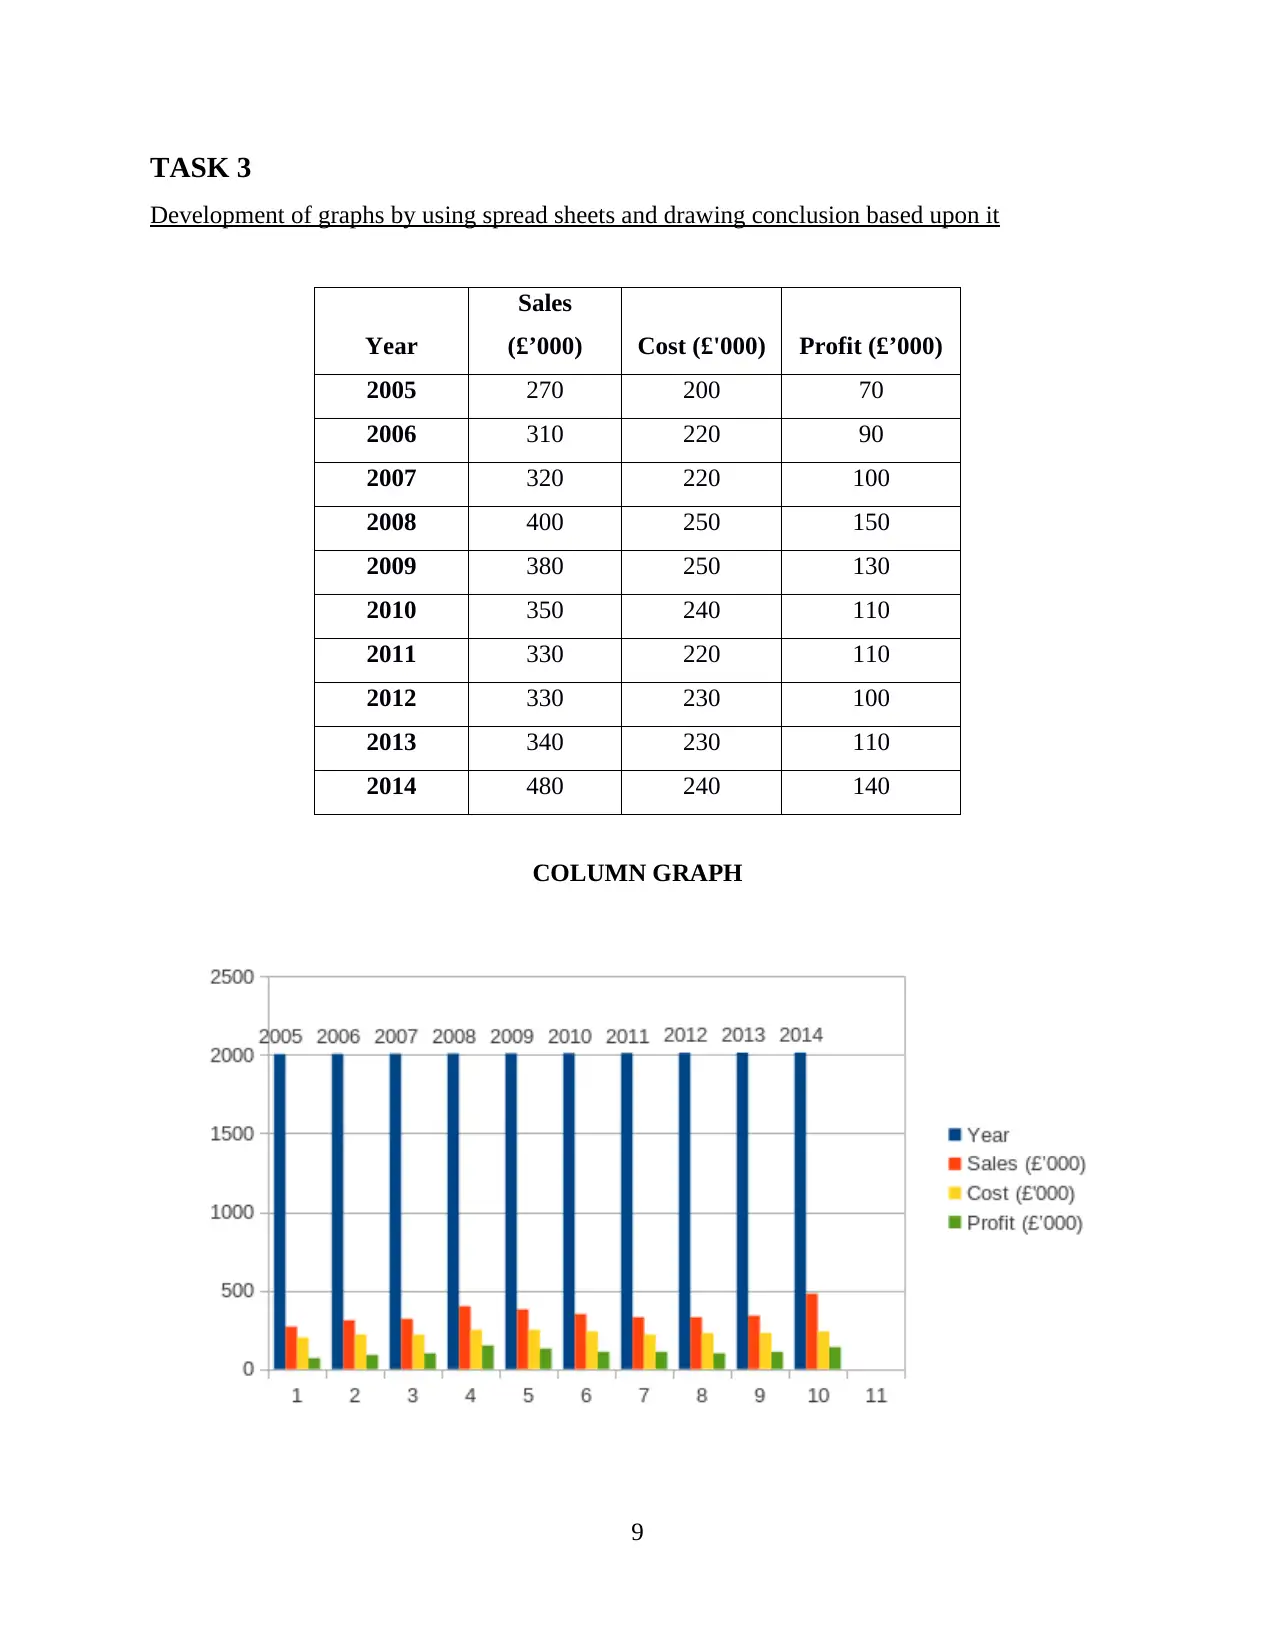
TASK 3
Development of graphs by using spread sheets and drawing conclusion based upon it
Year
Sales
(£’000) Cost (£'000) Profit (£’000)
2005 270 200 70
2006 310 220 90
2007 320 220 100
2008 400 250 150
2009 380 250 130
2010 350 240 110
2011 330 220 110
2012 330 230 100
2013 340 230 110
2014 480 240 140
COLUMN GRAPH
9
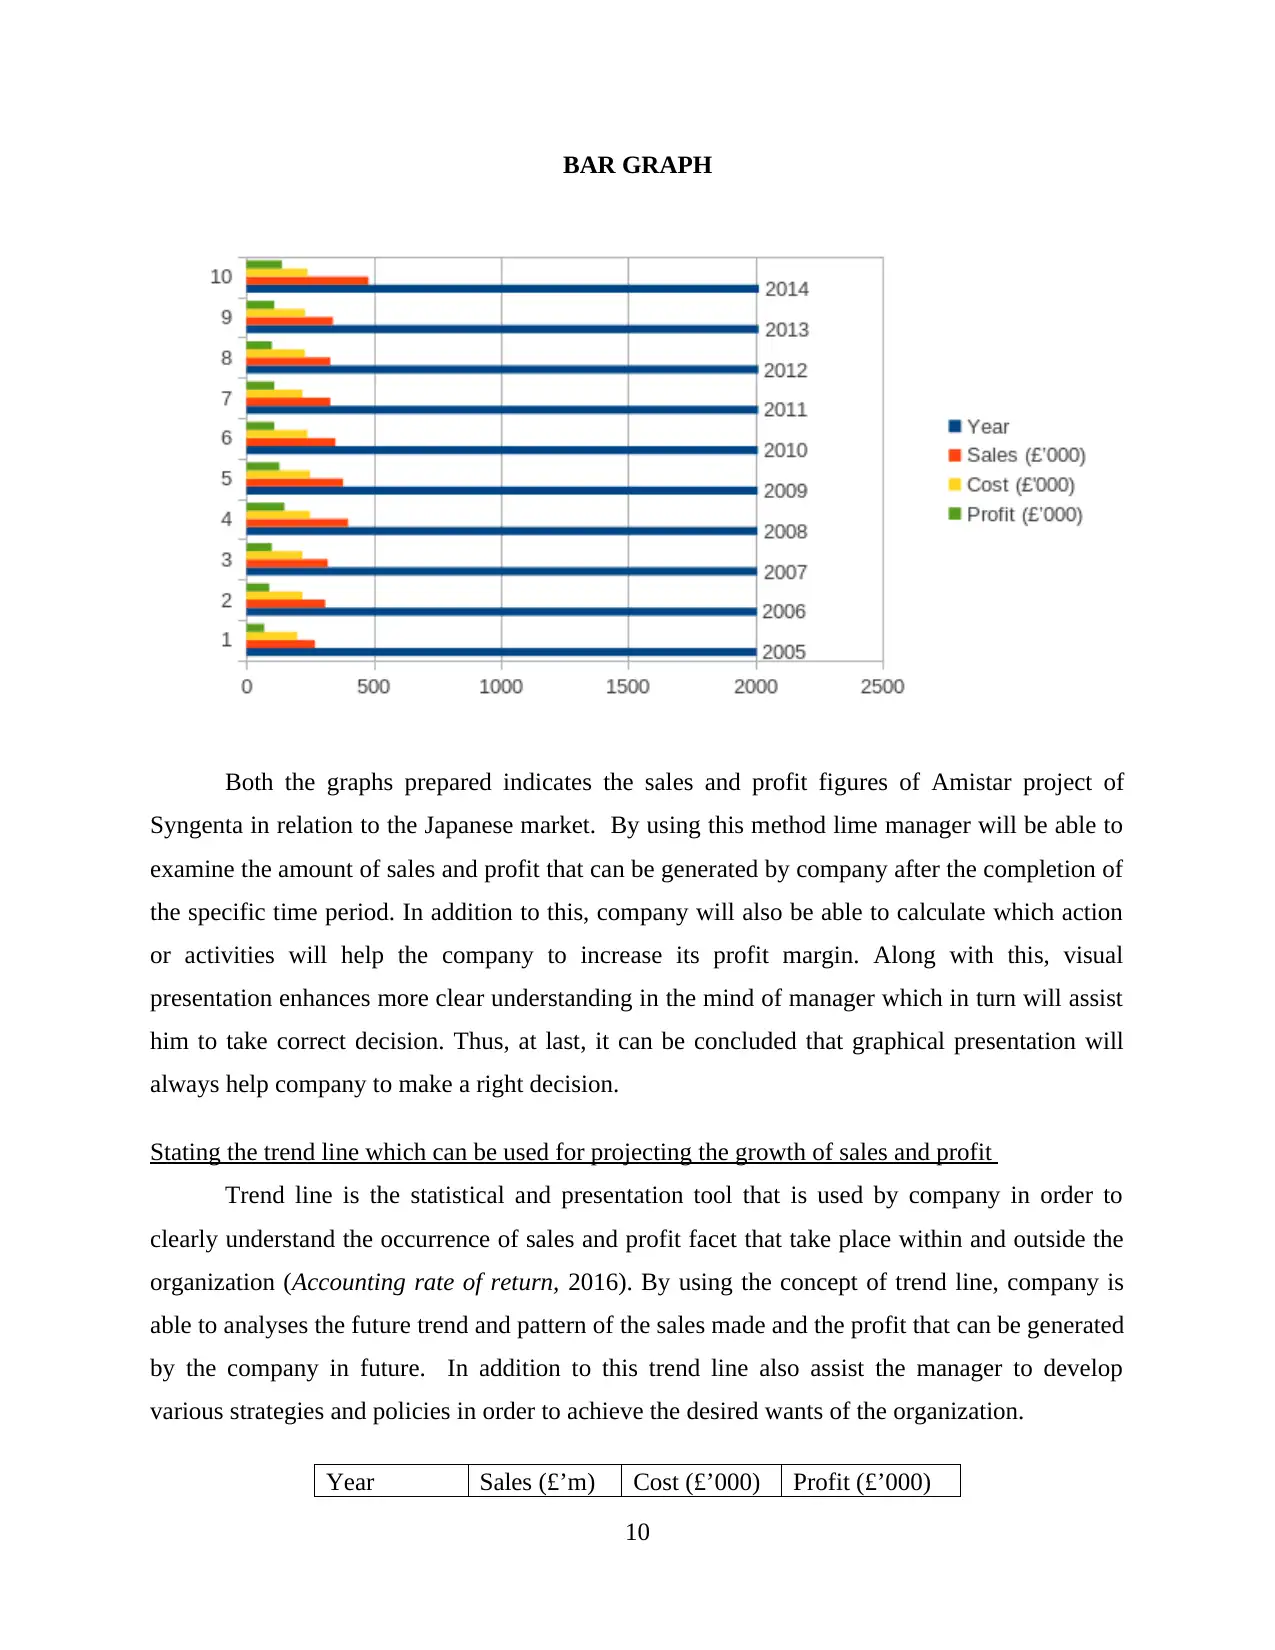
BAR GRAPH
Both the graphs prepared indicates the sales and profit figures of Amistar project of
Syngenta in relation to the Japanese market. By using this method lime manager will be able to
examine the amount of sales and profit that can be generated by company after the completion of
the specific time period. In addition to this, company will also be able to calculate which action
or activities will help the company to increase its profit margin. Along with this, visual
presentation enhances more clear understanding in the mind of manager which in turn will assist
him to take correct decision. Thus, at last, it can be concluded that graphical presentation will
always help company to make a right decision.
Stating the trend line which can be used for projecting the growth of sales and profit
Trend line is the statistical and presentation tool that is used by company in order to
clearly understand the occurrence of sales and profit facet that take place within and outside the
organization (Accounting rate of return, 2016). By using the concept of trend line, company is
able to analyses the future trend and pattern of the sales made and the profit that can be generated
by the company in future. In addition to this trend line also assist the manager to develop
various strategies and policies in order to achieve the desired wants of the organization.
Year Sales (£’m) Cost (£’000) Profit (£’000)
10
⊘ This is a preview!⊘
Do you want full access?
Subscribe today to unlock all pages.
Trusted by 1+ million students worldwide
1 out of 21
Related Documents


Your All-in-One AI-Powered Toolkit for Academic Success.
+13062052269
info@desklib.com
Available 24*7 on WhatsApp / Email
![[object Object]](/_next/static/media/star-bottom.7253800d.svg)
Unlock your academic potential
Copyright © 2020–2026 A2Z Services. All Rights Reserved. Developed and managed by ZUCOL.