Comprehensive Data Analysis and Report on Syngenta's Amistar Project
VerifiedAdded on 2019/12/04
|18
|4610
|187
Report
AI Summary
This report presents a comprehensive analysis of Syngenta's Amistar project, focusing on the application of business decision-making principles. It begins with an introduction to the project, followed by an overview of the data collection methods, including primary and secondary data sources, survey design, and sampling techniques. The report then delves into statistical analysis, calculating and interpreting mean, mode, median, range, and standard deviation to evaluate financial aspects. Furthermore, the report explores the use of quartiles, percentiles, and correlation coefficients to assess market trends and relationships between variables. Project management tools, such as Gantt charts and network diagrams, are utilized to plan and manage project activities, and investment appraisal techniques are applied to support decision-making. Finally, the report provides a conclusion summarizing the key findings and recommendations for the successful launch of the Amistar project.

BDM
Paraphrase This Document
Need a fresh take? Get an instant paraphrase of this document with our AI Paraphraser
Table of Contents
INTRODUCTION ..........................................................................................................................1
TASK 1............................................................................................................................................1
Q.1 Stating the plan for the primary and secondary data collection methods along with the
survey methodology as well as sampling frame used.................................................................1
Q.2 Designing of market survey questionnaire...........................................................................2
TASK 2............................................................................................................................................3
Q.1 Calculating and stating the significance of mean, mode and median along to Syngenta.....3
Q.2 Computing and analyzing the importance of range as well as standard deviation to the
business enterprise......................................................................................................................4
Q.3 Stating the use of quartile, percentile and correlation coefficient to Syngenta....................5
TASK 3............................................................................................................................................6
Q.1 Producing graphs by using spread sheets and drawing valid conclusion based upon it......6
.....................................................................................................................................................7
Q.2 Stating the trend line which can be used for projecting the growth of sales and profit.......8
Q.3 Preparing the presentation by using software......................................................................9
TASK 4............................................................................................................................................9
Q.1 Preparing the Gantt chart and stating the benefits of using such as a project management
tool...............................................................................................................................................9
Q.2 Preparing a network diagram for the activities and stating the critical path for new
warehouse project......................................................................................................................11
Q.3 Using investment appraisal tools and techniques for the decision making........................12
CONCLUSION..............................................................................................................................14
REFERENCES..............................................................................................................................15
INTRODUCTION
Business decision making is the continuous process in which manager of the enterprise
takes logical decisions that helps an organization in fulfilling their objectives. In business
organization it is the responsibility of the finance manager to take more suitable decisions out of
the alternatives which are available to them (Tamir and et.al., 2015). Moreover, growth and
success of a firm is highly dependent upon the financial and non- decision taken by them. This
project report is based upon the case scenario of Syngenta, which is the most leading company of
the world who employed 28000 employees and thereby serve its product or services to 90
countries. Now company is planning to launch Amistar project which is highly suited to the
integrated pest management system. The present report will depict the plan through which
researcher can gather primary and secondary data for the research purpose. Besides this, it will
also develop an understanding about the several statistical tools and techniques that helps in
analyzing the data gathered from the research.
TASK 1
Q.1 Stating the plan for primary and secondary data collection methods along with the survey
methodology and sampling frame
On the basis of cited case scenario Syngenta is planning to introduce Amistar which is a
fungicide. Business organization can launch this product in India and thereby expand its business
operations or functions more successfully. Company needs to select India because it holds
second position in the world in the category of agricultural business. Thus, people who are in
agricultural business prefers to make use of fungicide products to protect their crops from
fungus. In order to identify the growth and success aspect of the new project of Syngenta
research that gathers data from both primary and secondary sources.
Plan for the collection of primary and secondary data: Primary data refers to those which are
collected by the researcher for the first time in accordance with the research issue. Whereas,
secondary data is one which is already gathered by another researcher or investigator (Raju,
Lonial and Mangold, 2015). To collect primary data about Amistar, researcher conducts survey
via questionnaires. Survey is the best tool that helps researcher in collecting appropriate data
about the expansion project of Syngenta. To organize survey in an effective manner researcher
requires to select sample from the population. Thereafter, scholar needs to prepare suitable open
1
⊘ This is a preview!⊘
Do you want full access?
Subscribe today to unlock all pages.
Trusted by 1+ million students worldwide
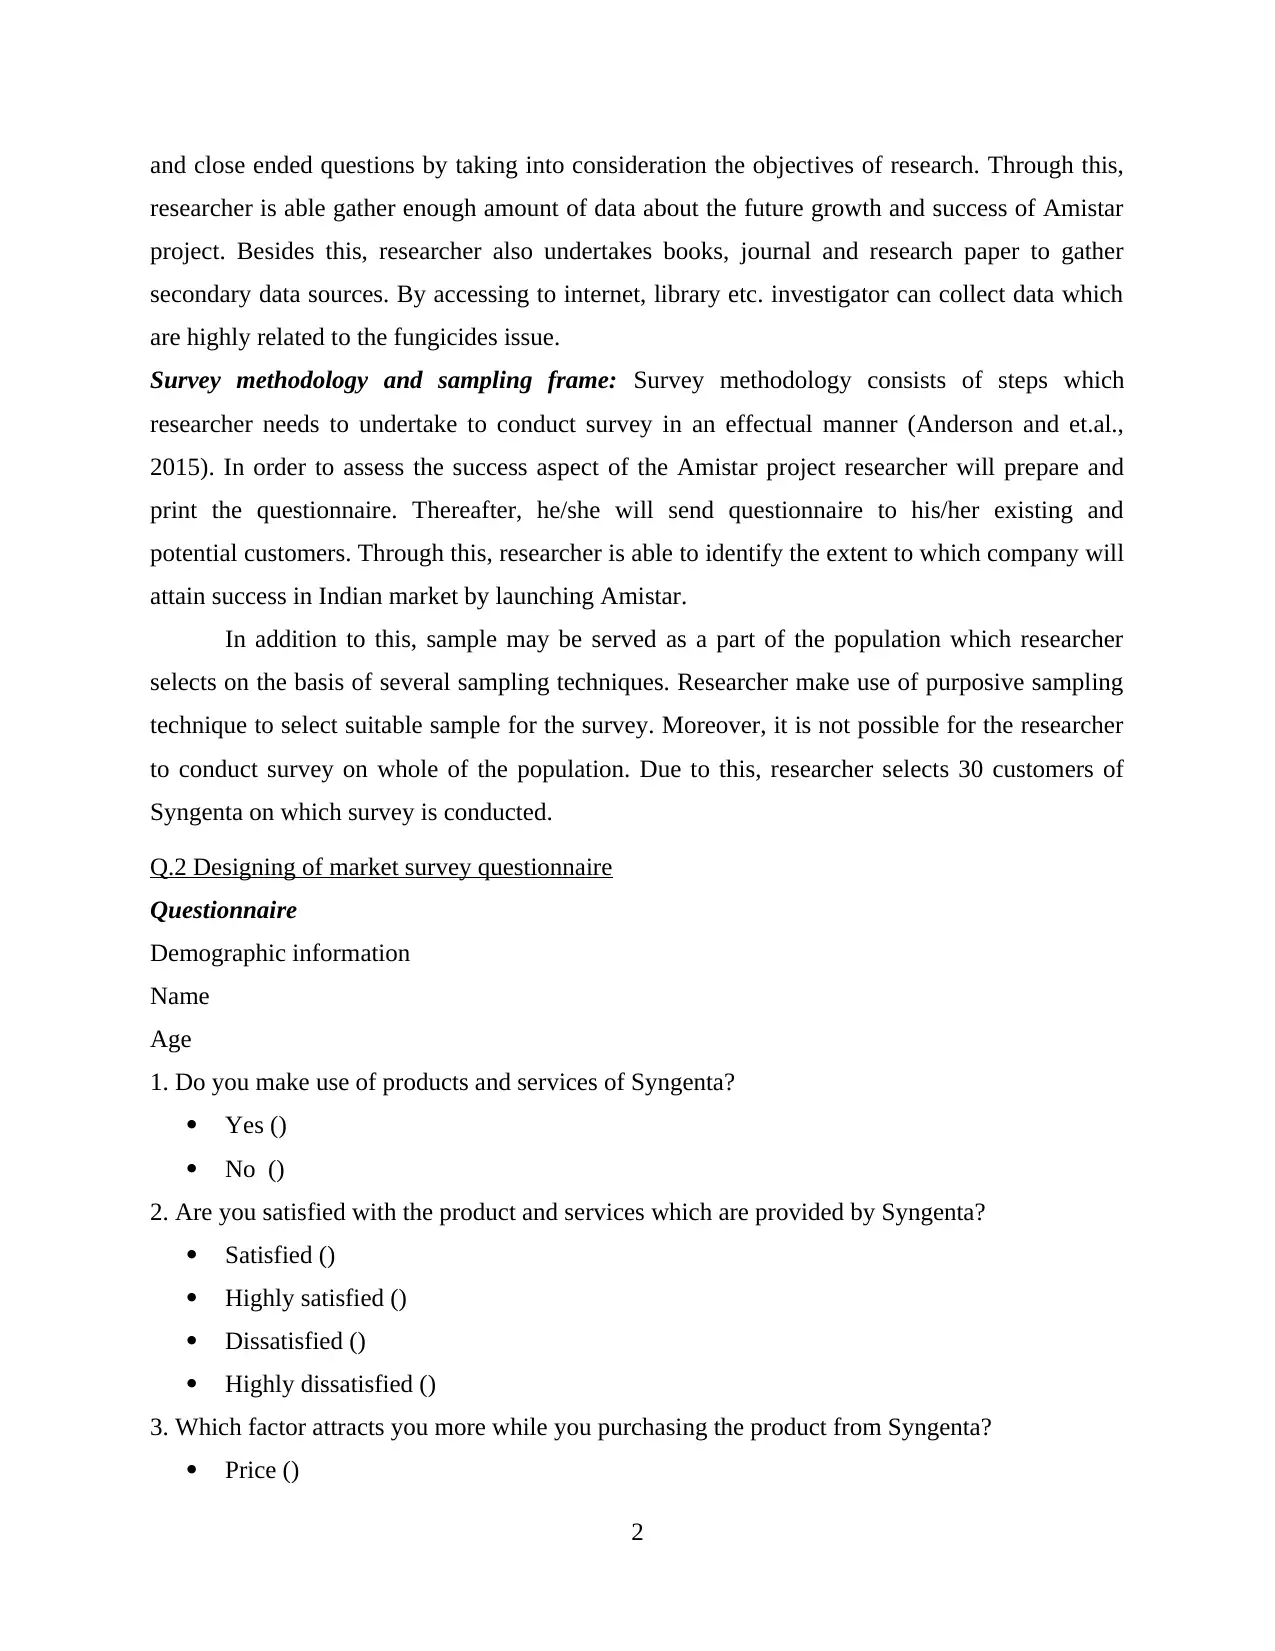
and close ended questions by taking into consideration the objectives of research. Through this,
researcher is able gather enough amount of data about the future growth and success of Amistar
project. Besides this, researcher also undertakes books, journal and research paper to gather
secondary data sources. By accessing to internet, library etc. investigator can collect data which
are highly related to the fungicides issue.
Survey methodology and sampling frame: Survey methodology consists of steps which
researcher needs to undertake to conduct survey in an effectual manner (Anderson and et.al.,
2015). In order to assess the success aspect of the Amistar project researcher will prepare and
print the questionnaire. Thereafter, he/she will send questionnaire to his/her existing and
potential customers. Through this, researcher is able to identify the extent to which company will
attain success in Indian market by launching Amistar.
In addition to this, sample may be served as a part of the population which researcher
selects on the basis of several sampling techniques. Researcher make use of purposive sampling
technique to select suitable sample for the survey. Moreover, it is not possible for the researcher
to conduct survey on whole of the population. Due to this, researcher selects 30 customers of
Syngenta on which survey is conducted.
Q.2 Designing of market survey questionnaire
Questionnaire
Demographic information
Name
Age
1. Do you make use of products and services of Syngenta?
Yes ()
No ()
2. Are you satisfied with the product and services which are provided by Syngenta?
Satisfied ()
Highly satisfied ()
Dissatisfied ()
Highly dissatisfied ()
3. Which factor attracts you more while you purchasing the product from Syngenta?
Price ()
2
Paraphrase This Document
Need a fresh take? Get an instant paraphrase of this document with our AI Paraphraser
Quality ()
Price and quality ()
4. Do you agree that Amistar will offer better protection to the crops from fungus and other
elements who badly affect them?
Yes ()
No ()
5. Do you think that Syngenta will attain success by launching Amistar in India?
Yes ()
No ()
6. Do you agree that Amistar will help Syngenta in integrating pest management system?
Agree ()
Strongly agree ()
Disagreement ()
Neutral ()
7. Any suggestion, if you want to give it to the organization related to the product or services
…...................................................................................................................................................
TASK 2
Q.1 Calculating and stating the significance of mean, mode and median along to Syngenta
Statistical analysis of annual expenses are as follows:
Annual Expenditure
/£m
No. of
Counties
Mid value Fx CF
0-10 13 5 65 13
10-20 25 15 375 38
20-30 37 25 925 75
30-40 22 35 770 97
40-50 21 45 945 118
50-60 20 55 1100 138
60-70 12 65 780 150
150 4960
Mean ∑FX/ n 33.07
3
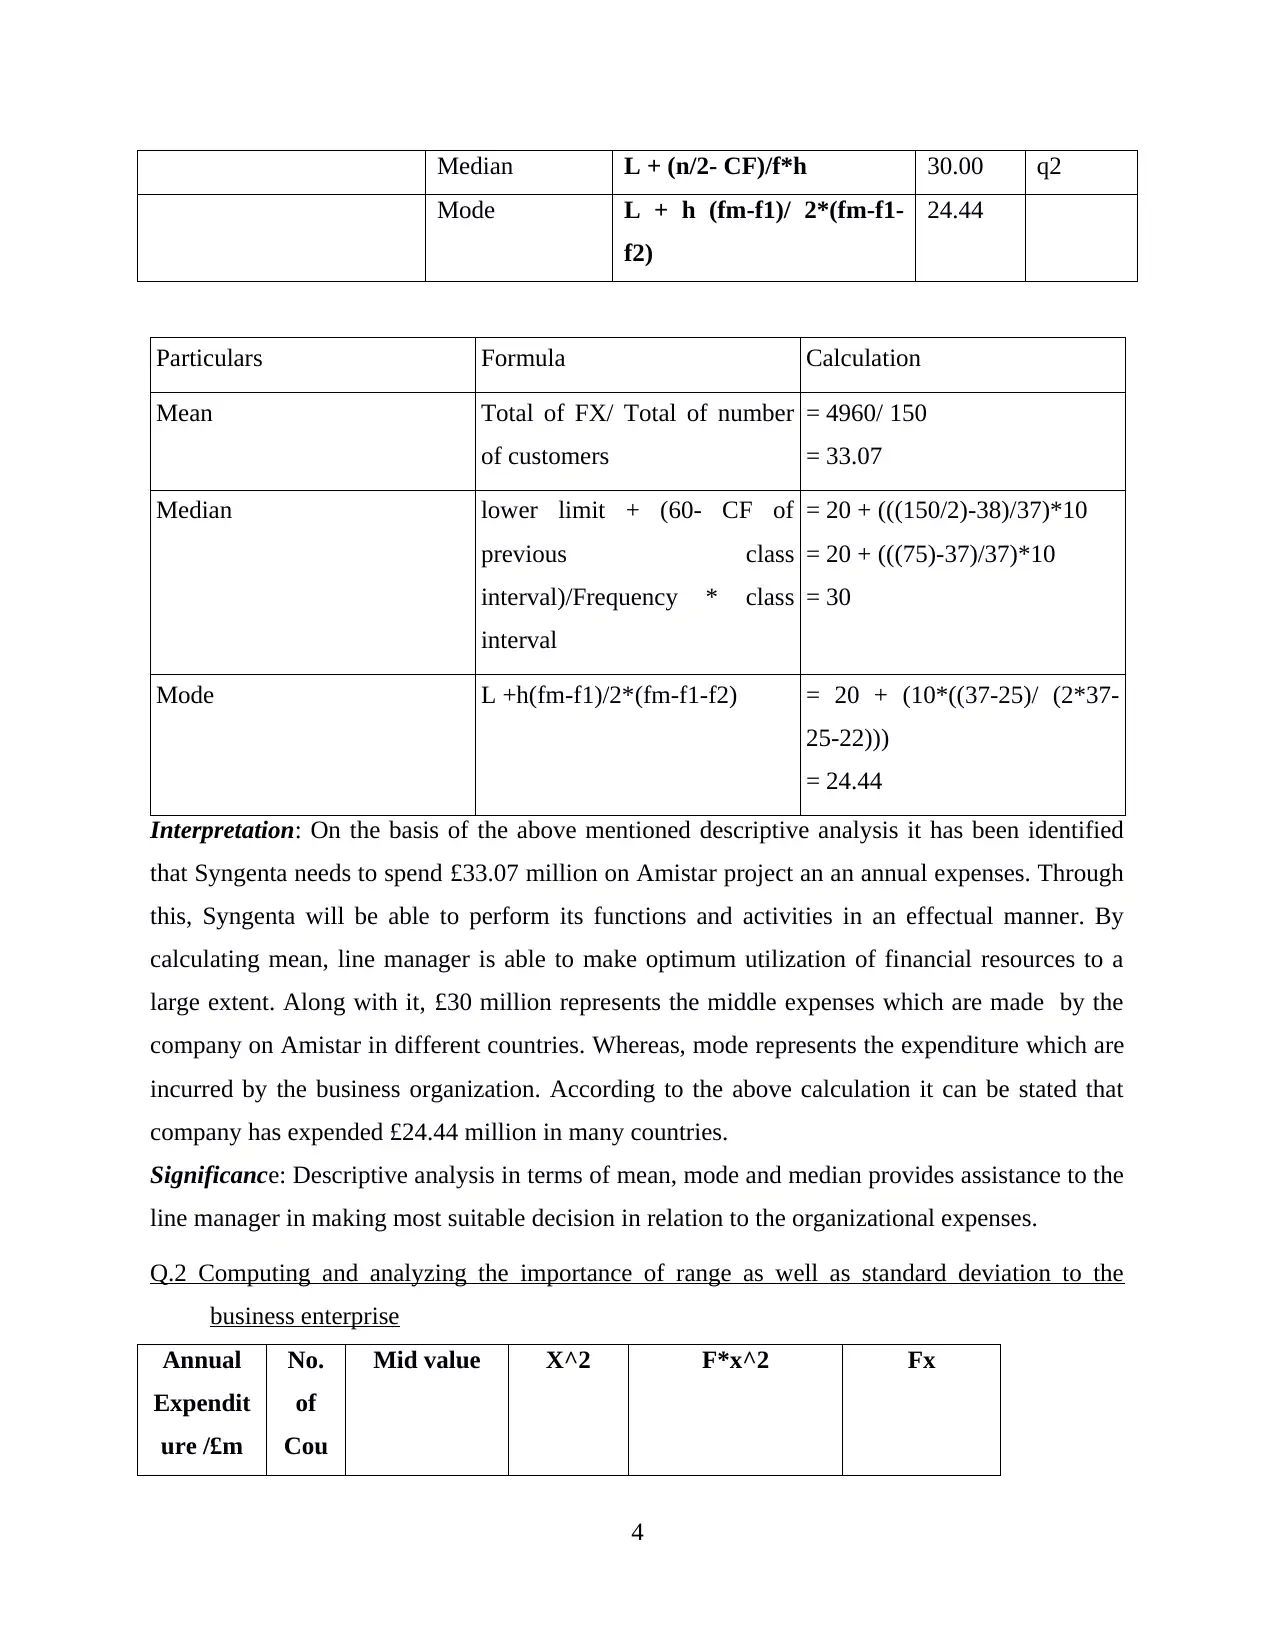
Median L + (n/2- CF)/f*h 30.00 q2
Mode L + h (fm-f1)/ 2*(fm-f1-
f2)
24.44
Particulars Formula Calculation
Mean Total of FX/ Total of number
of customers
= 4960/ 150
= 33.07
Median lower limit + (60- CF of
previous class
interval)/Frequency * class
interval
= 20 + (((150/2)-38)/37)*10
= 20 + (((75)-37)/37)*10
= 30
Mode L +h(fm-f1)/2*(fm-f1-f2) = 20 + (10*((37-25)/ (2*37-
25-22)))
= 24.44
Interpretation: On the basis of the above mentioned descriptive analysis it has been identified
that Syngenta needs to spend £33.07 million on Amistar project an an annual expenses. Through
this, Syngenta will be able to perform its functions and activities in an effectual manner. By
calculating mean, line manager is able to make optimum utilization of financial resources to a
large extent. Along with it, £30 million represents the middle expenses which are made by the
company on Amistar in different countries. Whereas, mode represents the expenditure which are
incurred by the business organization. According to the above calculation it can be stated that
company has expended £24.44 million in many countries.
Significance: Descriptive analysis in terms of mean, mode and median provides assistance to the
line manager in making most suitable decision in relation to the organizational expenses.
Q.2 Computing and analyzing the importance of range as well as standard deviation to the
business enterprise
Annual
Expendit
ure /£m
No.
of
Cou
Mid value X^2 F*x^2 Fx
4
⊘ This is a preview!⊘
Do you want full access?
Subscribe today to unlock all pages.
Trusted by 1+ million students worldwide
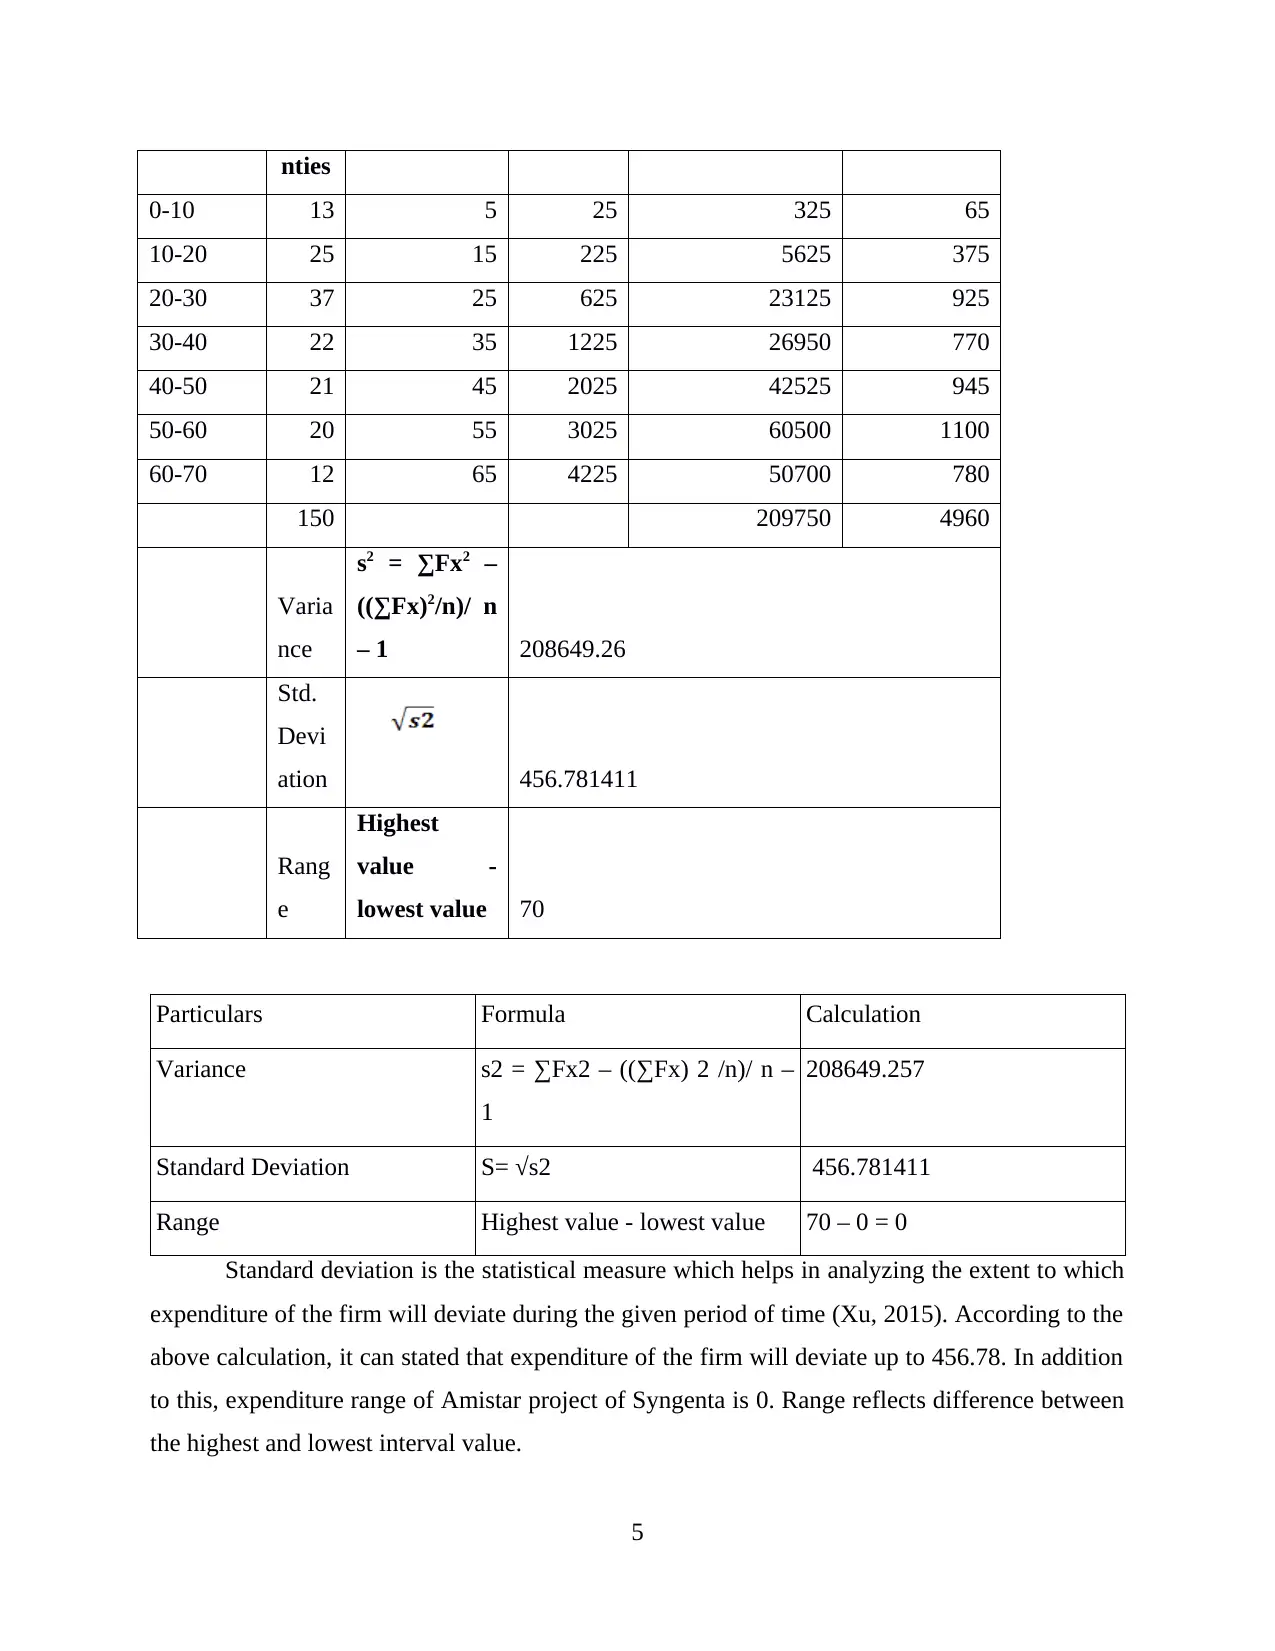
nties
0-10 13 5 25 325 65
10-20 25 15 225 5625 375
20-30 37 25 625 23125 925
30-40 22 35 1225 26950 770
40-50 21 45 2025 42525 945
50-60 20 55 3025 60500 1100
60-70 12 65 4225 50700 780
150 209750 4960
Varia
nce
s2 = ∑Fx2 –
((∑Fx)2/n)/ n
– 1 208649.26
Std.
Devi
ation 456.781411
Rang
e
Highest
value -
lowest value 70
Particulars Formula Calculation
Variance s2 = ∑Fx2 – ((∑Fx) 2 /n)/ n –
1
208649.257
Standard Deviation S= √s2 456.781411
Range Highest value - lowest value 70 – 0 = 0
Standard deviation is the statistical measure which helps in analyzing the extent to which
expenditure of the firm will deviate during the given period of time (Xu, 2015). According to the
above calculation, it can stated that expenditure of the firm will deviate up to 456.78. In addition
to this, expenditure range of Amistar project of Syngenta is 0. Range reflects difference between
the highest and lowest interval value.
5
Paraphrase This Document
Need a fresh take? Get an instant paraphrase of this document with our AI Paraphraser
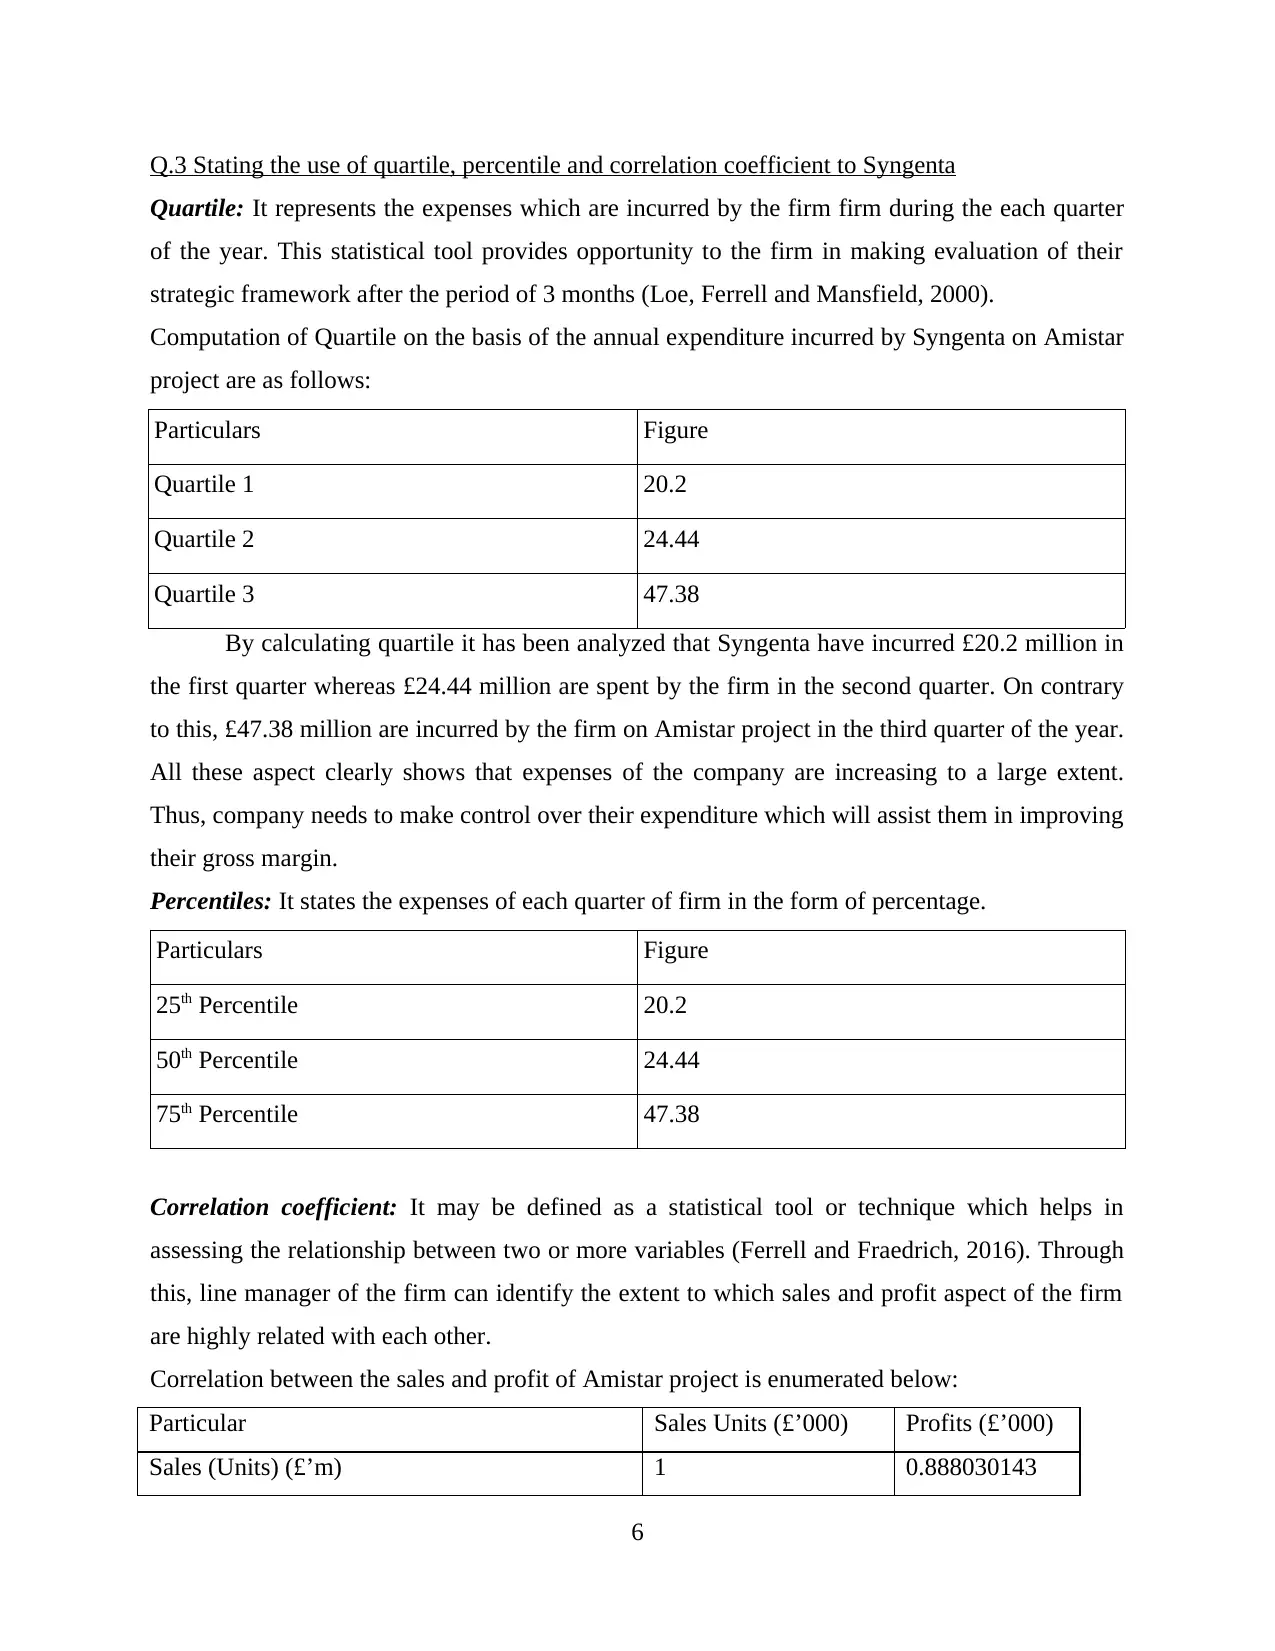
Q.3 Stating the use of quartile, percentile and correlation coefficient to Syngenta
Quartile: It represents the expenses which are incurred by the firm firm during the each quarter
of the year. This statistical tool provides opportunity to the firm in making evaluation of their
strategic framework after the period of 3 months (Loe, Ferrell and Mansfield, 2000).
Computation of Quartile on the basis of the annual expenditure incurred by Syngenta on Amistar
project are as follows:
Particulars Figure
Quartile 1 20.2
Quartile 2 24.44
Quartile 3 47.38
By calculating quartile it has been analyzed that Syngenta have incurred £20.2 million in
the first quarter whereas £24.44 million are spent by the firm in the second quarter. On contrary
to this, £47.38 million are incurred by the firm on Amistar project in the third quarter of the year.
All these aspect clearly shows that expenses of the company are increasing to a large extent.
Thus, company needs to make control over their expenditure which will assist them in improving
their gross margin.
Percentiles: It states the expenses of each quarter of firm in the form of percentage.
Particulars Figure
25th Percentile 20.2
50th Percentile 24.44
75th Percentile 47.38
Correlation coefficient: It may be defined as a statistical tool or technique which helps in
assessing the relationship between two or more variables (Ferrell and Fraedrich, 2016). Through
this, line manager of the firm can identify the extent to which sales and profit aspect of the firm
are highly related with each other.
Correlation between the sales and profit of Amistar project is enumerated below:
Particular Sales Units (£’000) Profits (£’000)
Sales (Units) (£’m) 1 0.888030143
6
Profits (£’m) 0.888030143 1
The above table shows that there is high level of positive correlation existing between
sales and profits. On the basis of this aspect it can be stated that profit of the firm will move in
the same direction in which sales revenue moves. If sales increases then profit margin will also
rise and vice versa. Therefore, company needs to employ cost effective strategies that helps them
in building and sustaining the competitive edge over others.
TASK 3
Q.1 Producing graphs by using spread sheets and drawing valid conclusion based upon it
Year
Sales
(£’000) Cost (£'000) Profit (£’000)
2005 270 200 70
2006 310 220 90
2007 320 220 100
2008 400 250 150
2009 380 250 130
2010 350 240 110
2011 330 220 110
2012 330 230 100
2013 340 230 110
2014 480 240 140
Graphical presentation of sales, cost and profit is enumerated below:
Column graphs
7
⊘ This is a preview!⊘
Do you want full access?
Subscribe today to unlock all pages.
Trusted by 1+ million students worldwide
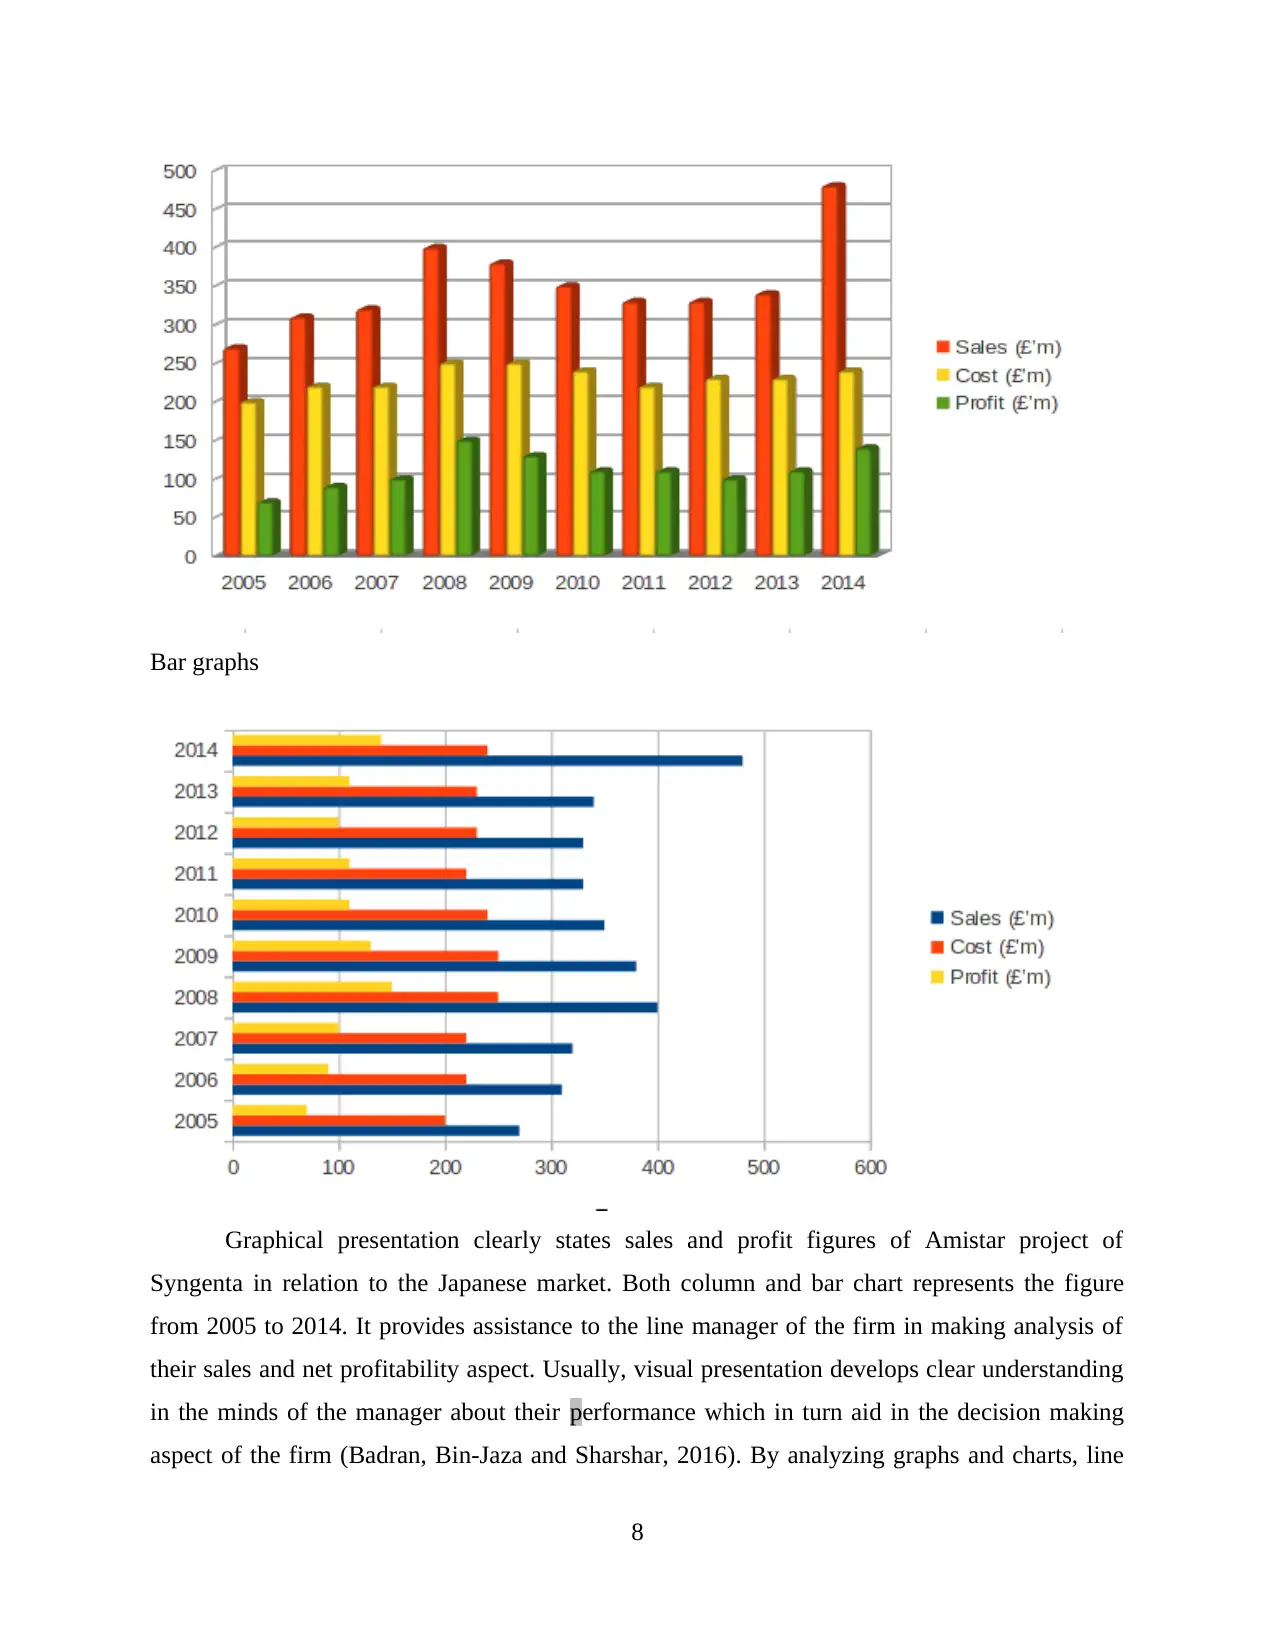
Bar graphs
Graphical presentation clearly states sales and profit figures of Amistar project of
Syngenta in relation to the Japanese market. Both column and bar chart represents the figure
from 2005 to 2014. It provides assistance to the line manager of the firm in making analysis of
their sales and net profitability aspect. Usually, visual presentation develops clear understanding
in the minds of the manager about their performance which in turn aid in the decision making
aspect of the firm (Badran, Bin-Jaza and Sharshar, 2016). By analyzing graphs and charts, line
8
Paraphrase This Document
Need a fresh take? Get an instant paraphrase of this document with our AI Paraphraser
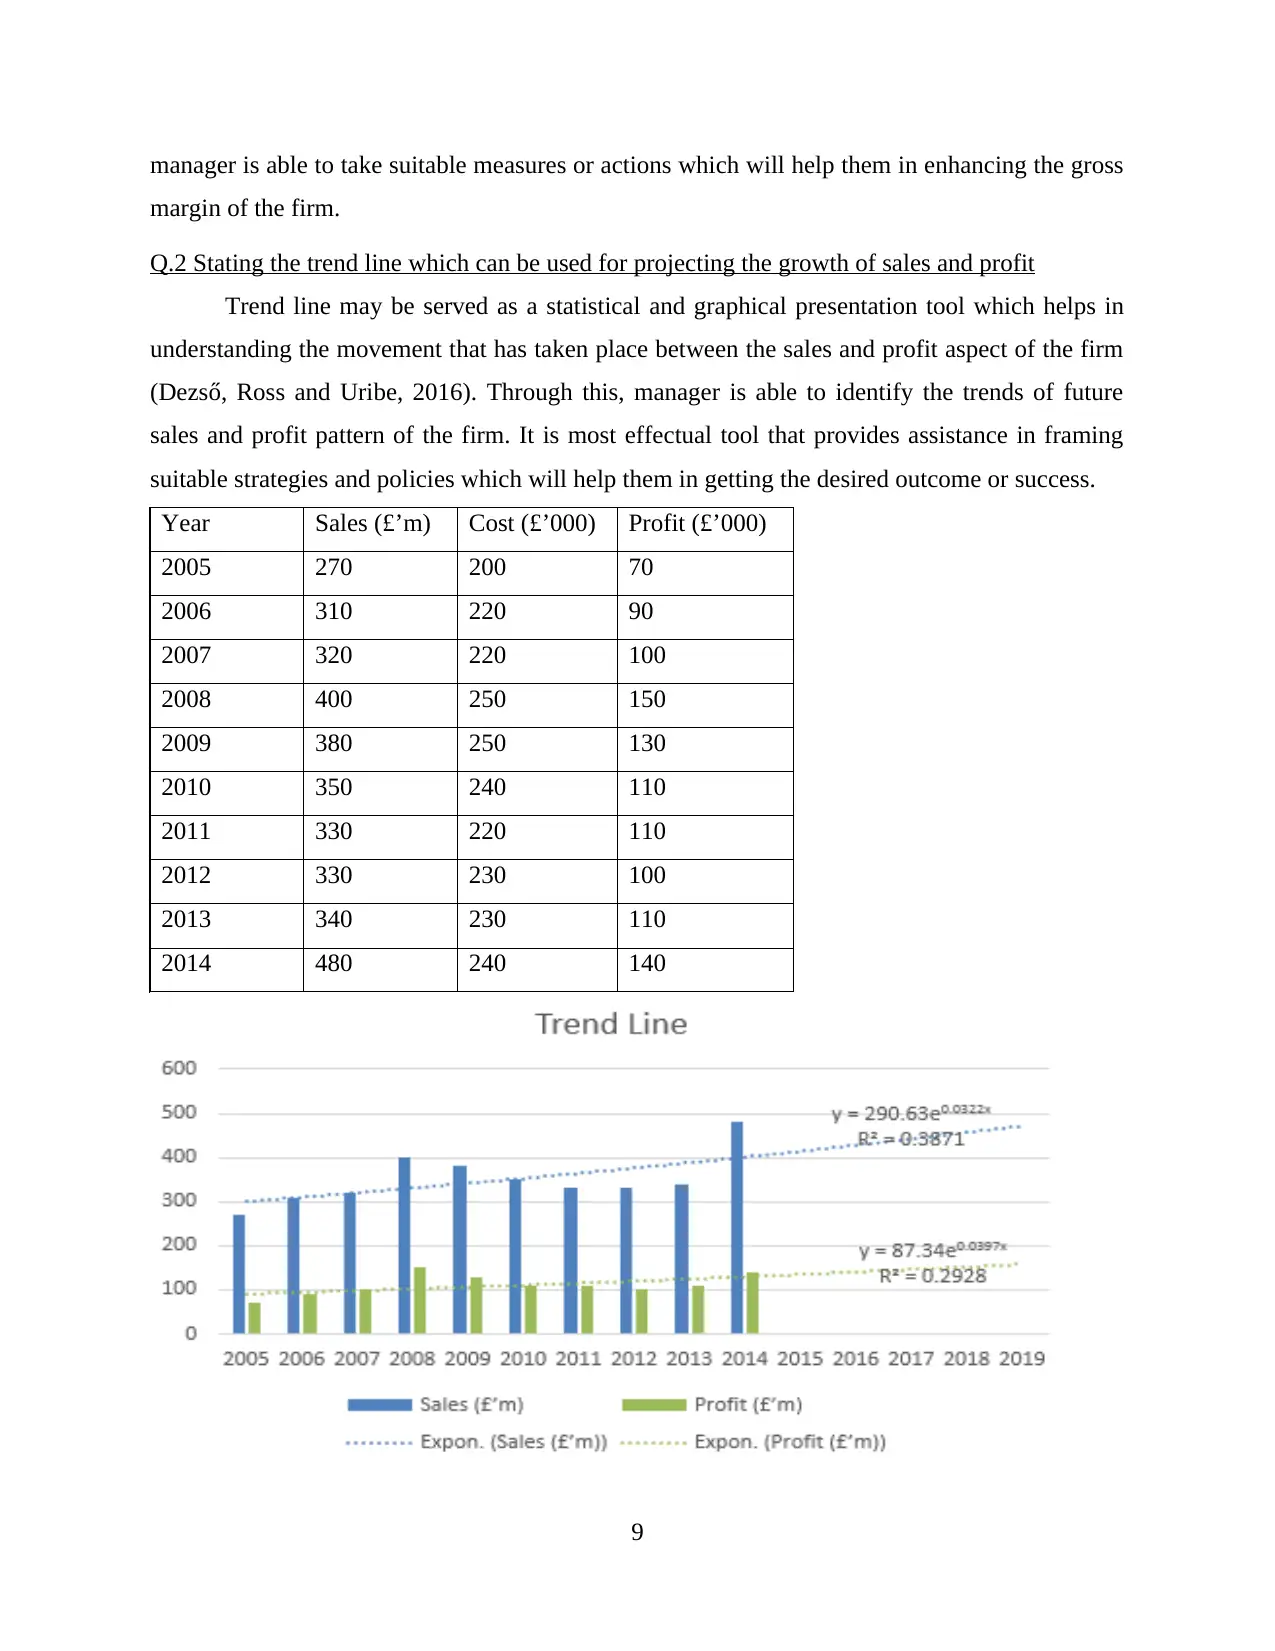
manager is able to take suitable measures or actions which will help them in enhancing the gross
margin of the firm.
Q.2 Stating the trend line which can be used for projecting the growth of sales and profit
Trend line may be served as a statistical and graphical presentation tool which helps in
understanding the movement that has taken place between the sales and profit aspect of the firm
(Dezső, Ross and Uribe, 2016). Through this, manager is able to identify the trends of future
sales and profit pattern of the firm. It is most effectual tool that provides assistance in framing
suitable strategies and policies which will help them in getting the desired outcome or success.
Year Sales (£’m) Cost (£’000) Profit (£’000)
2005 270 200 70
2006 310 220 90
2007 320 220 100
2008 400 250 150
2009 380 250 130
2010 350 240 110
2011 330 220 110
2012 330 230 100
2013 340 230 110
2014 480 240 140
9
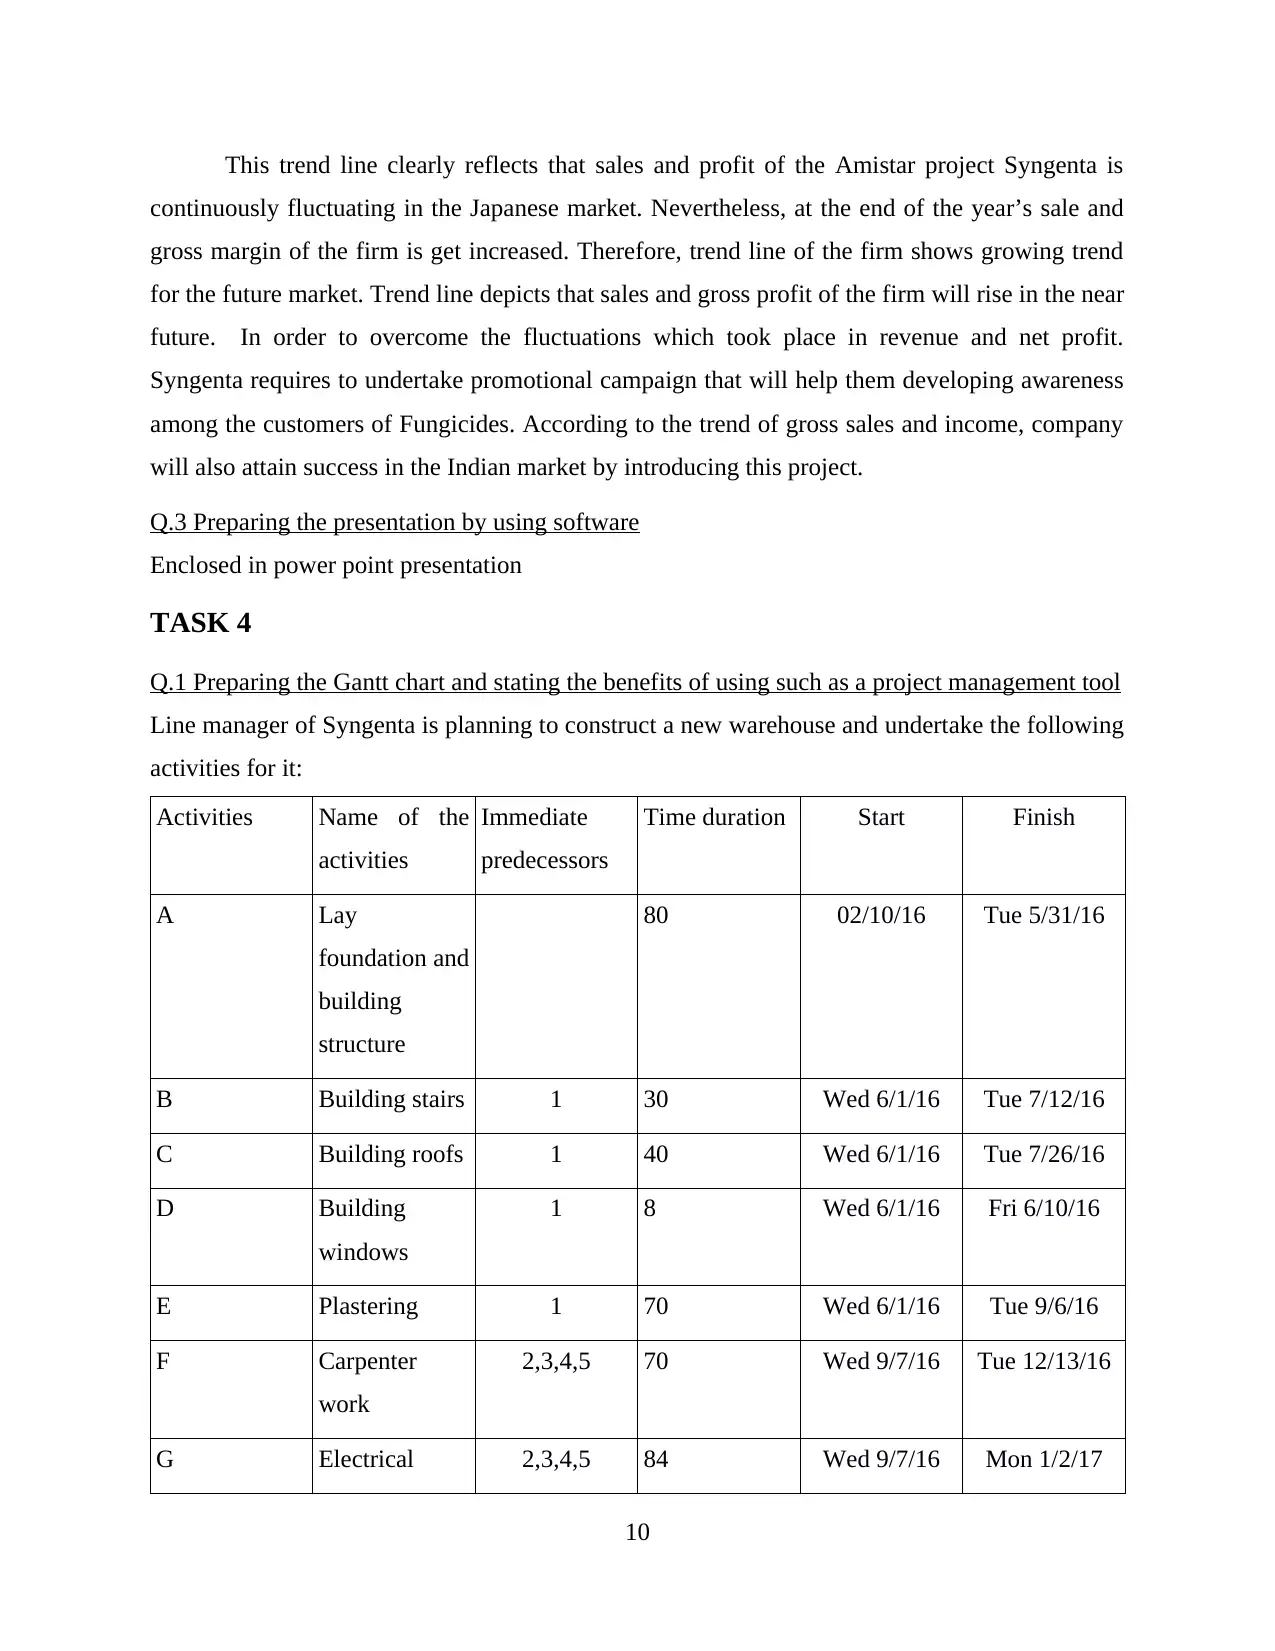
This trend line clearly reflects that sales and profit of the Amistar project Syngenta is
continuously fluctuating in the Japanese market. Nevertheless, at the end of the year’s sale and
gross margin of the firm is get increased. Therefore, trend line of the firm shows growing trend
for the future market. Trend line depicts that sales and gross profit of the firm will rise in the near
future. In order to overcome the fluctuations which took place in revenue and net profit.
Syngenta requires to undertake promotional campaign that will help them developing awareness
among the customers of Fungicides. According to the trend of gross sales and income, company
will also attain success in the Indian market by introducing this project.
Q.3 Preparing the presentation by using software
Enclosed in power point presentation
TASK 4
Q.1 Preparing the Gantt chart and stating the benefits of using such as a project management tool
Line manager of Syngenta is planning to construct a new warehouse and undertake the following
activities for it:
Activities Name of the
activities
Immediate
predecessors
Time duration Start Finish
A Lay
foundation and
building
structure
80 02/10/16 Tue 5/31/16
B Building stairs 1 30 Wed 6/1/16 Tue 7/12/16
C Building roofs 1 40 Wed 6/1/16 Tue 7/26/16
D Building
windows
1 8 Wed 6/1/16 Fri 6/10/16
E Plastering 1 70 Wed 6/1/16 Tue 9/6/16
F Carpenter
work
2,3,4,5 70 Wed 9/7/16 Tue 12/13/16
G Electrical 2,3,4,5 84 Wed 9/7/16 Mon 1/2/17
10
⊘ This is a preview!⊘
Do you want full access?
Subscribe today to unlock all pages.
Trusted by 1+ million students worldwide
1 out of 18
Related Documents


Your All-in-One AI-Powered Toolkit for Academic Success.
+13062052269
info@desklib.com
Available 24*7 on WhatsApp / Email
![[object Object]](/_next/static/media/star-bottom.7253800d.svg)
Unlock your academic potential
Copyright © 2020–2026 A2Z Services. All Rights Reserved. Developed and managed by ZUCOL.